U.S. Department of Transportation
Federal Highway Administration
1200 New Jersey Avenue, SE
Washington, DC 20590
202-366-4000
Sign up to have Safety Compass delivered right to your inbox!

Best for printing: PDF Version (2.71 MB)
In this issue:
A Message from the FHWA Associate Administrator for Safety, Cheryl Walker
What's New?
USDOT Announces Comprehensive National Roadway Safety Strategy
FHWA Updates HSIP Eligibility and Special Rules Guidance
FHWA’s Complete Streets Initiative Releases Report to Congress and a New Website
Safety-Driven Changes and Improvements
New FHWA Web Resource Summarizes Research and Technology Efforts, Including Safety Research Projects
Comprehensive Safety Action Plans a Key Component of New SS4A Grant Program
MATCHing Needs With Expertise to Solve Local Road Safety Concerns
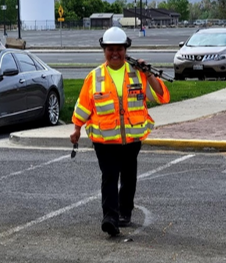
Implementing a Safety Culture: Experience from the Private Sector
Assessment and Analysis
Crowdsourcing for Safer Transportation Systems
Virtual Tours Camera Kit and GIS Crowdsourcing – FHWA Office of Federal Lands Highway
Advancing Implementation of FHWA’s Proven Safety Countermeasures
State of the Practice: Updates from Safety Partners
Prioritizing Systemic Projects for Horizontal Curves in Rhode Island
Addressing Lane Departure Fatalities in Puerto Rico
Implementing Highly Reflectorized Durable Pavement Markings on the Pennsylvania Turnpike
Estes Park Project Provides Equitable Design, Engagement for Underrepresented Community
Learning Together
Cite the Site! Always Share the CMF ID When Referencing a Specific CMF
Announcements
New Community of Practice for Vision Zero Launched!
National Work Zone Awareness Week – Work Zones are a Sign to Slow Down

Cheryl Walker, Associate Administrator for Safety.
We are facing a national crisis of roadway fatalities. Fatalities have surged over these past two years, with 38,824 deaths on our roads in 2020. This is the highest level since 2007. That number–38,824–is not just a statistic. Each is a person–a mother, a father, a son, a daughter, a friend, a coworker–a person whose loss is deeply felt by others. And although traffic crashes affect all of us, they disproportionately impact pedestrians, bicyclists, communities of color, lower income communities, and people living in rural and Tribal areas.
This crisis of roadway fatalities is urgent, unacceptable, and preventable. We all agree that zero is the only acceptable number of deaths on our roads, and the USDOT is committed to this single, shared goal.
Launched this past January, the National Roadway Safety Strategy is the USDOT’s comprehensive plan to significantly reduce serious injuries and fatalities on America’s roads (full story on page 2). The strategy includes a goal of zero deaths and outlines the tangible deliverables that the Department will produce in the next few years to significantly advance roadway safety. It embraces a Safe System Approach, which builds multiple layers of protection around road users, and is based on the reality that although people make mistakes, these mistakes do not have to be fatal. The strategy will also allow us to address the inequities in our transportation system and ensure a Safe System for all users.
At this moment in time, we have a unique opportunity and unprecedented resources to implement the National Roadway Safety Strategy and reduce the fatalities on our roadways. The Bipartisan Infrastructure Law (BIL) provides critical resources–including $6 billion in safety funding–to improve our roads. The Notice of Funding Opportunity (NOFO) for the Safe Streets and Roads for All (SS4A) Grants Program has been released–take a look at the article on page 8 for links to more information and the grant application. You can read more about BIL and related updates to HSIP eligibility guidance on page 4. The newly released Complete Streets website (see page 6) details FHWA’s commitment to advance widespread implementation of this design model to help improve safety and accessibility for all users. This issue of the Safety Compass has lots of information on some of FHWA’s signature safety efforts, such as the Safe System Approach (page 8); implementation of the Proven Safety Countermeasures (page 18); resources that help practitioners connect with each other, such as the MATCH mentor program (page 9) and the Vision Zero community of practice (page 27); and noteworthy safety practices from our partners (pages 20-24).
Getting to zero will take a sustained, urgent, and lasting commitment from all of us. Our efforts must include coordination with our stakeholders across the public sector, private sector, advocacy, and research communities. We look forward to working with all of you in preventing fatalities and serious injuries on our Nation’s roadways. Together, we will make a difference.
By Jennifer Warren and Norah Ocel, FHWA Office of Safety
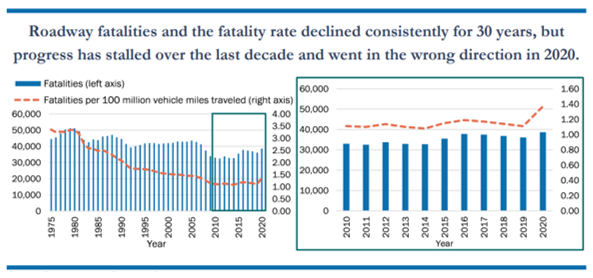
In January 2022, the USDOT announced the new, comprehensive National Roadway Safety Strategy (NRSS), a roadmap for addressing the crisis in fatalities and serious injuries on the Nation’s roadways. While the number of annual roadway fatalities had declined for many years, progress plateaued over the past decade. However, fatalities rose dramatically during the pandemic.
–Pete Buttigieg
Secretary of Transportation
The NRSS outlines USDOT’s comprehensive approach to significantly reducing deaths and serious injuries on our Nation’s highways, roads, and streets. It provides concrete steps USDOT will take to address this crisis systemically and prevent these tragic and avoidable losses.
Specifically, the NRSS:
With adoption of the Safe System Approach, the NRSS acknowledges that humans make mistakes and are vulnerable. The NRSS emphasizes the importance of designing a redundant system to protect everyone by preventing crashes and ensuring that if crashes do occur they do not result in serious injury or death. USDOT will use a five-pronged model that corresponds to the Safe System elements: safe road users, safe roads, safe vehicles, safe speeds, and post-crash care.
The NRSS also recognizes that reducing traffic fatalities is a shared responsibility–another key principle of the Safe System Approach. This will take sustained and concerted action from all sectors and levels of government, the public and private sector, and advocacy and research communities. It will take an urgent yet lasting commitment from all involved to support actions that protect people and prevent harm. To that end, in conjunction with the NRSS, USDOT is starting a Call to Action campaign for stakeholders to commit to specific and tangible actions that would significantly advance safety.
This is a pivotal moment–now is the time for action, and now more than ever we need everyone to do their part to get closer to zero.
To learn more, read the complete National Roadway Safety Strategy or contact Jennifer Warren at jennifer.warren@dot.gov or Norah Ocel at norah.ocel@dot.gov.
By Karen Scurry and Sarah Weissman Pascual, FHWA Office of Safety
On February 2, 2022, FHWA released updated guidance on Highway Safety Improvement Program (HSIP) (23 U.S.C. 148) eligibility and special rules to support implementation of the Infrastructure Investment and Jobs Act, also known as the Bipartisan Infrastructure Law (BIL) (Pub. L. 117-58).
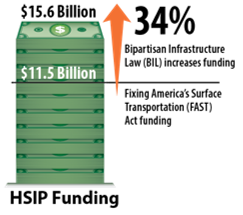
BIL substantially increased funding for HSIP from $11.5 billion under the Fixing America’s Surface Transportation (FAST) Act to $15.6 billion, which represents a 34-percent increase. BIL also emphasized the importance of vulnerable road user safety and increased HSIP eligibilities. The HSIP Fact Sheet provides additional information on the program purpose, funding features, Federal share, eligible activities, and vulnerable road user requirements.
HSIP Eligibility Guidance complements USDOT’s National Roadway Safety Strategy; clarifies HSIP eligibility requirements under BIL; and outlines recommendations that can help State, local, and Tribal transportation agencies save lives on the roads and bridges they own and operate. HSIP funds can be used for any highway safety improvement project on any public road or publicly owned bicycle or pedestrian pathway or trail. The eligibility guidance emphasizes that all highway safety improvement projects must be consistent with a State’s Strategic Highway Safety Plan (SHSP), identified through a data-driven safety analysis process, and contribute to a reduction in fatalities and serious injuries.
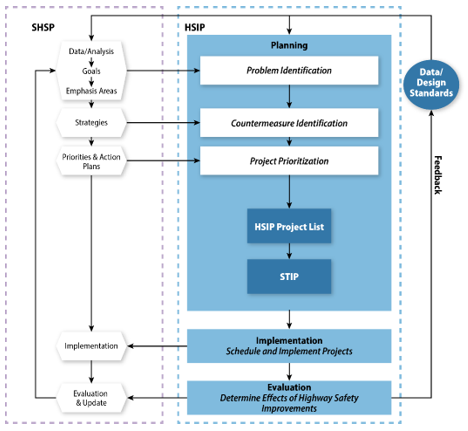 Relationship between SHSP, State HSIP, and the HSIP data-driven process.
While HSIP focuses on infrastructure safety improvements, BIL provides States with more flexibility to use up to 10 percent of their HSIP funds for “specified safety projects.” These include non-infrastructure safety projects, such as public awareness campaigns, research, automated traffic enforcement systems, emergency services, and efforts to protect children such as Safe Routes to School.
Consistent with the National Roadway Safety Strategy, FHWA recommends that HSIP funds be used to incorporate a more data-driven, holistic, and equitable Safe System Approach to roadway safety, which builds in redundancies so if one element of a transportation system fails, other elements provide protection to save lives and prevent serious injuries on our Nation’s roads.
In addition to advancing implementation of the Safe System Approach, FHWA is recommending that States leverage HSIP funds to:
The HSIP Special Rules Guidance replaces both the guidance FHWA previously issued in 2012 for the High Risk Rural Roads (HRRR) Special Rule as well as the guidance previously issued in 2013 and 2016 for the Older Drivers and Pedestrians Special Rule. The HSIP Special Rules Guidance also adds new guidance for the Vulnerable Road Users (VRU) Safety Special Rule, established in BIL (23 U.S.C. 148(g)). Although each special rule has specific requirements established in the statute, FHWA has aligned the notification schedules of all three HSIP special rules to streamline communications.
The HRRR Special Rule applies to a State where the fatality rate on rural roads in a State increases over the most recent 2-year period. States subject to the HRRR Special Rule must obligate 200 percent of the HRRR funds they received in fiscal year 2009 for HRRRs, as defined in a State’s SHSP.
The new VRU Special Rule applies to States where the total annual fatalities among vulnerable road users (including people who walk, bicycle, and use personal conveyances) represents 15 percent or more of total annual fatalities. States subject to the VRU Special Rule must obligate 15 percent of their HSIP funds on projects that address vulnerable road user safety in the next fiscal year.
FHWA hosted a webinar for external customers and stakeholders on February 28, 2022. The passcode for the archived recording of the webinar is h@T37kWt.
If you have additional questions about:
By: Anthony Boutros, FHWA Office of Safety
In 2021, FHWA developed a Complete Streets initiative to work with State, Tribal, and local transportation agencies to implement a Complete Streets design model as these agencies plan, develop, and operate streets and networks. A Complete Street is safe, and feels safe, for all users. Complete Streets create a safe, connected, and equitable transportation network for travelers of all ages and abilities, particularly those from underserved communities facing historic disinvestment. FHWA has established a website to showcase resources that support transportation professionals in developing and implementing a Complete Streets strategy.
The first new resource was posted on March 2, 2022, when FHWA released a report to Congress detailing the agency’s commitment to advancing widespread implementation of the Complete Streets design model. In that report, Moving to a Complete Streets Design Model: A Report to Congress on Opportunities and Challenges, FHWA adopted Complete Streets as its default approach for funding and designing the majority of federally funded roadways. The report identifies five overarching opportunity areas that will inform FHWA as it moves ahead with its efforts to increase the proportion of federally funded transportation projects that are routinely planned, designed, built, and operated as Complete Streets:
FHWA recognizes that a Complete Streets design model is a powerful tool to help reverse the trend of increasing fatalities and serious injuries and creating a healthier, greener, and more equitable roadway system. The Complete Streets initiative reflects FHWA’s commitment to advance widespread implementation of the Complete Streets design model.
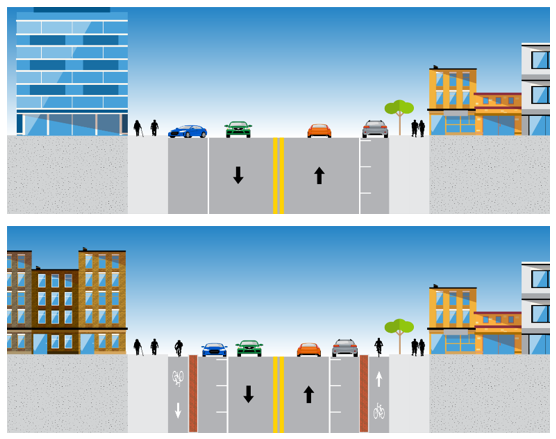
Another new resource released in early March is Complete Streets Transformations, a document that provides six hypothetical scenarios illustrating how common arterial corridor configurations can be transformed to accommodate the needs of different users by implementing Complete Streets. The purpose of these scenarios is to stimulate ideas for improving existing streets as part of developing a Complete Streets network, with an emphasis on developing safe and complete bicycle and pedestrian networks and access to public transportation.
Other resources posted on the website are drawn from a variety of FHWA program offices, FHWA’s implementation of the Bipartisan Infrastructure Law (BIL), and other agencies and organizations. Watch for frequent updates as new information and resources become available.
BIL defines Complete Streets standards or policies as those which “ensure the safe and adequate accommodation of all users of the transportation system, including pedestrians, bicyclists, public transportation users, children, older individuals, individuals with disabilities, motorists, and freight vehicles.”
BIL provides new tools and resources that allow States and local governments to build Complete Streets. This includes a requirement that States and metropolitan planning organizations use at least 2.5 percent of their planning funding on activities related to Complete Streets. BIL also continues to provide funding for Complete Streets activities through Rebuilding American Infrastructure with Sustainability and Equity grants and the National Highway Performance Program. Surface Transportation Block Grant Program funds can also be used for Complete Streets implementation. FHWA recently released guidance for the Highway Safety Improvement Program, which can be used for Complete Streets projects and which received an additional $4 billion in funding under BIL. A new $6 billion competitive grant program for local governments, Safe Streets and Roads for All, was also created under BIL, details of which will be announced in the coming months. Information about BIL can be found on FHWA’s BIL website.
For more information, contact Barbara McCann at Barbara.mccann@dot.gov or Anthony Boutros at anthony.boutros@dot.gov.By: Mary Huie, FHWA Office of Research, Development, and Technology
The Office of Research, Development, and Technology recently launched the FHWA Research and Technology (R&T) Portfolio web pages, a new digital resource highlighting research projects from across the agency, including FHWA’s Safety R&T Program.
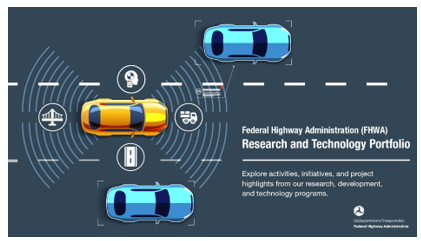
The R&T Portfolio web pages provide a broad overview of FHWA’s research and technology activities, initiatives, and projects. The R&T Portfolio covers the entire R&T Program, including agenda setting, research and development, technology testing and evaluation, deployment and evaluation of market-ready technologies and innovations, development of regulations and guidance, and technical assistance.
The new web pages offer examples of FHWA’s cutting-edge approaches to solving today’s highway challenges. The R&T Portfolio web pages do not replace the program offices’ web pages; rather, they present a program overview, highlight selected projects from across the agency, and provide links to more information. e R&T Portfolio includes a section dedicated to FHWA safety research grouped by program delivery, design and operations, human factors, and data and analysis. Each area features several research efforts and provides a specific example of a safety issue that our research addresses. For example, the Drivers Failing to Yield at Multilane Roundabout study focuses on FHWA’s efforts to reduce fatalities in intersections.
Please visit, bookmark, and share this valuable resource with your stakeholders and colleagues. The R&T Portfolio web pages provide useful information on safety research at FHWA for reports, articles, and presentations.
For more information, please contact Mary Huie at Mary.Huie@dot.gov.
By: Jennifer Warren, FHWA Office of Safety
The text of the Bipartisan Infrastructure Law (BIL) establishes the new Safe Streets and Roads for All (SS4A) discretionary program that will provide $5-6 billion in grants over the next 5 years. This funding supports regional, local, and Tribal initiatives through grants to prevent roadway deaths and serious injuries. The development and establishment of a Comprehensive Safety Action Plan is a key component of this program.
The SS4A program supports Secretary of Transportation Pete Buttigieg’s National Roadway Safety Strategy and a goal of zero deaths and serious injuries on our Nation’s roadways.
The Notice of Funding Opportunity (NOFO) for Safe Streets and Roads for All grants was released on May 16, 2022 (information on the NOFO is posted on SS4A web page). Interested parties may now visit the page and learn how to apply for SS4A grants.
Award announcements are expected to be made by the end of calendar year 2022 or early 2023.
Who will be eligible to apply for grant funding?
For more information about this program and tips on how to prepare for applying, visit the Safe Streets and Roads for All (SS4A) Grant Program webpage.
You can also subscribe to receive email updates and receive notifications about webinars and other information as it becomes available.
For more information, please contact Jennifer Warren at Jennifer.Warren@dot.gov.
By: Rosemarie Anderson, FHWA Office of Safety

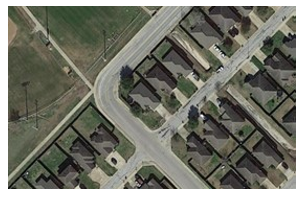
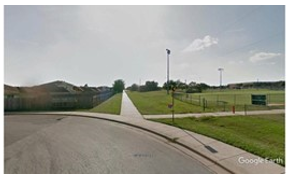
In October 2021, the College Station Public Works Department requested assistance from the MATCH Program to address crashes occurring on a collector road where two roads intersect at a 90–degree curve with residential homes on either side (see aerial photo). The MATCH Program matched College Station with mentor James Nall, P.E., based on his experience with similar challenges. Mr. Nall is a traffic and safety engineer who previously served as the Traffic Division Director for Mesa County, CO.
Mr. Nall requested data about the curve and the crashes from the public works department. The speed limit at this section of the road is 30 mph, and there are sidewalks on both side of the road. The average daily traffic is 1,151 vehicles per day. There were four crashes at the curve between 2011 and 2021, with three of those crashes being westbound vehicles. All crashes occurred at night or during dark conditions. In some of these crashes, the vehicle ended up in the yard of the home adjacent to the curve.
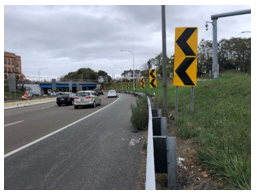
In 2020, the College Station Public Works Department installed advisory speed limit signs, chevrons, and a double yellow line to warn motorists of the upcoming curve. However, even with these countermeasures, a crash occurred at the location in 2021. After receiving and reviewing this information, the mentor and mentee met virtually to discuss in further detail the issues experienced and potential countermeasures to resolve the issues.
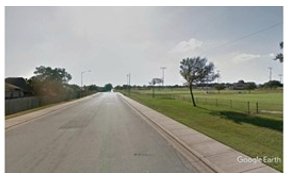
Mr. Nall suggested that while speed and darkness were contributing risk factors, they were not the primary risk factors resulting in the crashes. Instead, the roadway alignment seemed to be the primary factor. As one is approaching the curve on Arnold Road before it turns into Schaffer Road, it appears that the roadway alignment is straight. This is what traffic engineers refer to as a visual trap. In this case, when viewing the pedestrian path that continues straight where the road curves (see images below) some drivers could mistakenly assume the road is going straight. As such, some drivers on the approach may be surprised by the 90–degree curve. This is compounded at night because there are very few visual cues to alert the driver of the coming curve. In addition, the chevrons that inform drivers of the change in alignment are not clearly visible. The chevrons can be seen at the curve, but it may be too late for drivers to slow down and adjust to the alignment as they enter the curve.
Based on the information gathered and discussions with the agency’s traffic engineer, Mr. Nall recommended the following countermeasures as a priority:
Other countermeasures recommended include
– James Nall, former Traffic Division Director, Mesa County, Colorado and Region Traffic Engineer for the Colorado DOT.
The College Station Public Works Department was proactive in addressing the crashes at the curve but realized that additional assistance was needed to identify other countermeasures that had successfully worked in similar locations. By pairing the Public Works Department with an engineer who had previously worked for a local agency and had faced similar issues, the MATCH Program helped College Station benefit from a peer’s expertise rather than having to continue with trial and error to identify a solution to this safety issue.
The MATCH program can assist with your local or Tribal roadway safety challenges. All local and Tribal agencies are eligible to apply for this FREE technical assistance from a mentor through the MATCH program. For assistance, prospective mentee agencies must fill out and submit a short online application. Response is quick and, depending on the issue, technical assistance may be provided immediately. Requests must be directly submitted by a public official. When necessary, FHWA may coordinate with the mentee's respective State DOT or FHWA division office to support the mentoring request. Upon approval for the program, the applicant will be matched with a mentor.
You can also participate in the MATCH Program as a mentor. Public agency transportation safety professionals who have specific expertise related to local and/or Tribal road safety may serve as mentors. Mentors must be actively employed by or retired from a public transportation agency with a minimum of 5 years of continuous transportation safety experience. Mentors’ schedules will be accommodated; however, they will be asked to make a commitment to assist the mentees. Both mentors and mentees will be required to produce a short report once the activity is completed in an effort to document and share noteworthy practices.
Learn more about the MATCH program or contact Rosemarie Anderson at rosemarie.anderson@dot.gov.
By: Nicole Waldheim, Burgess & Niple, and Lacy Brown, DKS Associates
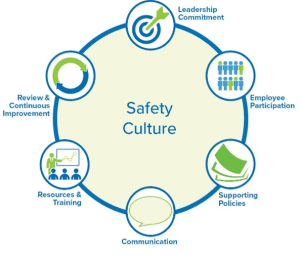
A transportation safety culture is the shared values, actions, and behaviors that demonstrate a commitment to safety over competing goals and demands. Incorporating the core elements (see graphic) of this culture within an organization or agency could increase the level of energy staff dedicate to the Safe System Approach and increase the impact of the approach by prioritizing safe roads, safe road users, safe speeds, post-crash care, and safe vehicles in transportation plans, programs, and projects. Ideally, the ultimate outcome of this approach will be a profound reduction in fatal and serious injury crashes.
Initiating a transportation safety culture does not have to be complicated, resource intensive, or time consuming. Even small changes can result in a shift in how employees and leadership embrace and embody a commitment to safety. There is no “single way” to develop a transportation safety culture for an organization, so the path forward will look very different for companies of different sizes, sectors, and technical disciplines. Burgess & Niple (B&N) and DKS Associates (DKS), two transportation consulting firms, applied the following framework in different ways to establish a culture of transportation safety.
Step 1: Secure Initial Commitment. B&N began by outlining the idea of transportation safety culture and developing a vision of how it could be implemented throughout our workplaces. We framed the discussion around the core elements of a transportation safety culture: leadership commitment, employee participation, supporting policies, communication, and resources and training. While buy-in from leadership is important, it is possible for anyone within an organization to become a champion and begin working with their immediate supervisors to build broad-based support for a shift in culture.
DKS took a different approach by engaging leadership to support small-scale actions that were timely and would have an immediate impact on staff safety.
Step 2: Find Your Safety Champions. As noted, anybody within an organization can become a champion for instituting a safety culture. We found that the primary prerequisite for the role is to have a passion for safety and desire to take meaningful action. Being able to engage with leadership and “have their ear” is also helpful in keeping momentum going.
Step 3: Develop Goals and Principles. Our next step was to decide which transportation safety culture elements resonated within our organizations and how we wanted to invest our time and resources. There are many ways to structure a culture, so it was important for us to customize an approach that was right for us. B&N did this by bringing together a cross-section of interested staff to brainstorm potential culture goals, principles, and program ideas. Then, we worked with our core team to refine our transportation safety culture vision, goals, and principles and share them with the larger group for buy-in.
Step 4: Implement a Transportation Safety Culture Campaign. Once we defined the elements of our transportation safety culture and brainstormed ideas to implement them, the fun really began! It is essential for a transportation safety culture campaign not to “sit on the shelf.” We worked to raise employee awareness about the campaign and scheduled related activities (at least twice a year) to engage staff. Here are some ideas that worked for us:
Two B&N staff took ownership of the program and engaged colleagues from marketing and HR to create the core B&N safety culture team.
DKS started with a few technical staff who were passionate about safety and became champions before they even knew what a "safety culture" was.
B&N also developed the hashtag #BNSafe for all internal and external communications related to safety culture.
B&N Vision
One Team, One Goal. Zero Fatalities.
B&N Principles
For more information, please contact Nicole Waldheim at nicole.waldheim@burgessniple.com and Lacy Brown at lacy.brown@dksassociates.com.
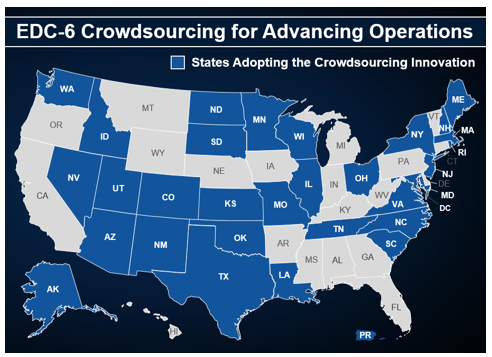
By: James Colyar, Greg Jones, and Ralph Volpe, FHWA Co-Leads for the Every Day Counts Round Six Innovation, Crowdsourcing for Advancing Operations
Most public agencies and nearly all private entities use some form of crowdsourcing, which is the practice of addressing a need or a problem by enlisting the services of large numbers of people through technology. Organizations crowdsource product reviews, idea generation, feature detection, funding, and much more. With the proliferation of location-based technologies, an unprecedented wave of crowdsourced data is now also available to transportation agencies. Moreover, analytics tools and services make processing and using crowdsourced data a true game-changer.
Since 2018, the FHWA Every Day Counts (EDC) Program, Crowdsourcing for Advancing Operations, has been supporting the adoption and use of crowdsourced data across 30+ States and their local agencies to improve operational practices related to traffic incidents, road weather, work zones, traffic signals, and emergency management along with a host of other functions often referred to as transportation systems management and operations (TSMO). The program more recently began discovering greater uses of crowdsourced data for transportation safety applications and, specifically, multiple elements of the Safe System Approach, which accounts for human error when designing and operating transportation systems to mitigate deaths and serious injuries on roadways.
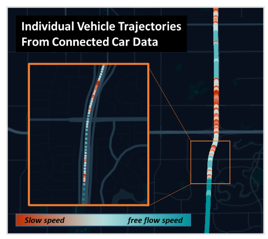
Crowdsourced data is collected passively (no action required from the individual) or actively (human-reported information) from individuals when they use travel-related mobile applications (apps) such as multimodal, navigation, 311 non-emergency, and agency-developed tools as well as a host of non-travel-related apps. Connected cars and scooters, GPS-enabled fleet vehicles, and social media platforms also generate crowdsourced data that benefits transportation agencies.
Crowdsourced data offers more geographic coverage across roadway types not typically captured through traditional roadway monitoring equipment, more representative sample sizes, more types of data, and more complete data. These crowdsourced data offer a wide array of information specific to road segments (e.g., speed, travel time, incidents, fleet composition), intersections (e.g., turning movement or arrival on green), trips (e.g., origin-destination, routes, mode), and vehicle behaviors (e.g., harsh braking, road friction, windshield wiper status). To derive even greater insights, private providers and a few public agencies also integrate crowdsourced data with other demographic and transportation data, as in the following examples.
Vehicle speed data are an invaluable product of crowdsourced data that benefits operations. Vehicle speed data also support proactive safety countermeasures. For example, Maine Department of Transportation (DOT) uses crowdsourced data to establish speed advisories on horizontal curves based on 85th percentile speeds. Similarly, in Oregon, variable speed limits are adjusted in real-time according to roadway conditions obtained from crowdsourced vehicle probe data.
The Maricopa Association of Governments (MAG) in Arizona and the Indiana DOT are two agencies that have begun using speed and acceleration data from connected car data. Both agencies have confirmed that road segments with high frequencies of hard braking correspond to those with high crash rates. Consequently, these agencies now identify safety hotspots much sooner than the traditional method requiring amassing crash data over multiple years.
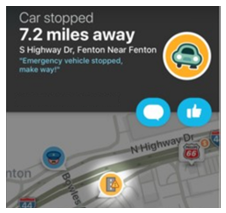
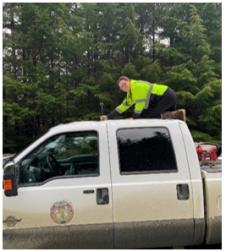
A vital aspect of the safe roads element of the Safe System Approach is alerting users to hazards and other road users to reduce the frequency and severity of crashes. States such as Ohio, Indiana, and Tennessee are using real-time crowdsourced data from vehicle probe providers to identify the backs of queues in real-time. Knowing where these dangerous locations are can help traffic management center (TMC) operators better deploy resources to alert travelers to these dangerous slowdowns by quickly detecting the ends of queues. For example, the Indiana DOT deploys more than 20 queue-warning trucks statewide based on the locations of queues. Indiana DOT and many other States also use back-of-queue information to post information on their dynamic message signs and, in some instances, through vehicle-embedded systems and mobile-based navigation applications. For example, the New Jersey and North Carolina DOTs offer traffic congestion and slowdown alerts to commercial vehicle drivers directly through an in-cab system. Many State and local agencies also share work zone, flood, and other road-closure data through crowdsourced navigation applications to alert travelers of atypical road conditions.
Personal injury or fatal crashes require quick detection and timely dispatch of the right resources and incident responders. By complementing traditional detection technologies with social media posts and free navigation app user reports, Iowa DOT, the Pennsylvania Turnpike, Lake County (Illinois) Division of Transportation, and many other agencies are detecting more incidents and detecting them more quickly. A few agencies are also exploring crowdsourced data for better routing of incident-response vehicles to the crash site. With quicker detection, more information on the nature of the incident, and quicker response, agencies can clear roadways faster, which means that the chances of a secondary crash are significantly reduced.
Missouri, Maryland, the Pennsylvania Turnpike, and many other DOTs also share alerts about roadside incident responder activity through a popular navigation app. Missouri DOT measured a 40 percent reduction in collisions with emergency response vehicles by third parties through their real-time digital warning system.
Multimodal crowdsourced data support the Safe System philosophy of shared responsibility and offer insights into driver decisions that improve the safety of all road users. For example, the City of Chicago evaluated location-based data from approximately 7,400 e-scooters over a 4-month period. This evaluation confirmed that geofencing effectively slowed down and stopped scooters from entering restricted areas such as specific trails, university campuses, and the central business district.

Safety-focused, commercially available analytics platforms are also available to help agencies leverage multiple forms of crowdsourced and demographic data through visualization of multimodal travel, modeling of multimodal demand, and even identification and assessment of appropriate safety countermeasures. For example, the City of Pittsburgh, PA, used a commercially available analytics platform to overlay bicycle and pedestrian origin-destination data with crash data to determine whether high-travel bicycle corridors correlate with crash severity.
Collectively, crowdsourced data support proactive and more holistic approaches to improve safety and operations for road users who walk, bike, drive, and travel by other modes. Crowdsourcing benefits transportation agencies by expanding and improving real-time monitoring, by supporting targeted and more timely responses, and by informing strategic and programmatic improvements across a host of TSMO and safety strategies and countermeasures. Applying crowdsourced data to transportation systems also helps garner public acceptance of transportation decisions, improves the transparency and efficiency of public expenditures, and promotes a sense of community and greater citizen satisfaction.
To learn more about how crowdsourced data can help your agency’s safety goals, reach out to the FHWA EDC-6 Crowdsourcing co-leads, James Colyar at James.Colyar@dot.gov, Greg Jones at Greg.Jones@dot.gov, or Ralph Volpe at ralph.volpe@dot.gov.
By Adam Larsen, FHWA Office of Tribal Transportation, and Matt Hinshaw, Western Federal Lands Highway Division
 Hollyanna Littlebull, transportation planner at the Yakama Nation.
Many have theorized that one day robots will rule the world. While they haven’t entirely taken over yet, technology today can drive our vehicles, vacuum our houses, and tell us bad jokes. And now, technology is available that can augment travel by creating virtual tours of road and trail projects.
The FHWA Office of Tribal Transportation now has a virtual tours camera kit that can be loaned to Tribal governments. Tribal partners mount the camera on a vehicle and drive through a road project or mount the camera on a tripod next to a road feature. After capturing the virtual tour, the camera kit is returned to FHWA where the images are processed and can be posted online in various ways.
Virtual tour video and photos are different from cellular phone images because they can look in any direction from the camera’s location, as if you are standing there. In addition, the camera captures GPS data that can be mapped along with other geospatial data. The map can also contain hyperlinks to the corresponding locations in the video.
"The video turned out awesome! I am super impressed with the quality, even with the potholes it turned out great!"
– Transportation Director Sara Yockey, Organized Village of Kasaan
Each camera kit is a protective gear case that contains a 360-degree camera, a magnetic camera mount, a tripod, a bicycle clamp mount, extra batteries, and spare lens covers. The kit weighs about 17 pounds and is ready for shipping, or it can travel as luggage.
Using these virtual tours, the Office of Tribal Transportation can offer more timely technical assistance, stewardship, and oversight that might otherwise be prohibited by travel restrictions.
The video also makes it easy to bring additional expertise to special situations. For example, the camera kit was sent to the Navajo Nation to conduct a final construction inspection because travel had not been allowed due to pandemic restrictions. Because the inspection was conducted by video, the FHWA Resource Center Safety and Design Team, who likely would not have otherwise visited the site, could see the project and provide advice that will influence the design of future roundabouts.
Tribes have used the camera kits to create virtual tours to accompany grant proposals, document video logs for asset management, and conduct virtual site reviews for road safety audits (RSA) and construction inspections.
Recently a virtual tour was created to support an RSA at the Tohono O’odham Nation. The number of people allowed to gather at the Nation’s facilities had been limited due to pandemic restrictions. This hampered the RSA process, in which the team gathers a wide variety of input from stakeholders. Typically the RSA process is conducted in person so team members can discuss how the route is managed and to review available data. The team then drives the route to examine concerns and capture photographs for an RSA findings report. Instead, for this RSA, Jeff King, a safety specialist in the FHWA Arizona Division, recorded 360-degree video and photos of the roads being studied. He then sent the camera kit to the FHWA Office of Tribal Transportation for publication.
"Thank you for letting us discover a whole new way to document our roadway and irrigation issues. I believe it will make a huge difference."
– Hollyanna Littlebull, Yakama Nation
Next, a crowdsourcing feature was added to gather input from the RSA team and other Nation stakeholders. An online data collection map was generated, which includes a simple form for users to geospatially locate areas of concern, note the issue, and provide comments and files, such as photos. This functionality is straightforward and simple to set up using typical industry solutions for geographic information systems (GIS).
A Federal Lands Highway research project is underway that is examining both common and customized solutions for using GIS to improve transportation safety for partner agencies such as Tribal Nations, Federal land management agencies, and State and local governments. The project has reviewed current practices and research; has developed a safety and traffic data framework and schema; and is conducting case studies for partners to collect and analyze data in support of RSAs, safety action plans, and other projects.
GIS-based tools can greatly improve the impact and efficiency of safety efforts like the RSA Tohono O’odham Nation is conducting. These tools enable team members who otherwise would not have been able to contribute to participate in the RSA.
Images extracted from the virtual tour will be used in the RSA findings report, as will the input gathered from the crowdsourcing feature. Additionally, these virtual tours have been used by the Arizona Department of Transportation and FHWA to conduct virtual RSA training.
For additional information about camera kits, please contact Adam Larsen at 360-619-2601. For additional information about using GIS to improve transportation safety, please contact Matt Hinshaw at 360-619-7677.
A video outlining the use of this camera kit is available.
The video can be viewed using different methods.
These virtual tours can be used for video logs, asset or risk management, safety studies, grant applications, and more. Tribal government employees can borrow virtual tour camera kits from FHWA for transportation purposes. In addition, FHWA will process your videos and post them online for easy sharing and use. Those interested can find a list of the contents of the virtual tours camera kit online.
In addition to video, the camera records GPS coordinates (and other telemetry) so users can extract a map from the video. Here is an example map from Seldovia Native Village in Alaska.
By: Phillip Bobitz, FHWA Office of Safety
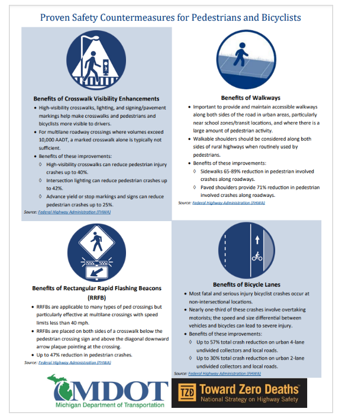
Widespread use of FHWA’s Proven Safety Countermeasures (PSCs) can offer significant, measurable impacts as part of any agency’s approach to improving safety. The PSCs are a collection of 28 countermeasures and strategies that are effective in reducing roadway fatalities and serious injuries. They are eligible under most Federal-aid highway funding programs and can serve as the basis for what agencies consider and implement when designing any highway project to save lives on our roadways.
In October 2021, FHWA released its fourth major update to the PSC initiative. The release included nine new PSCs; updates to a booklet and all existing PSCs and fact sheets; and revamped web pages, videos, and other tools to assist with consideration and implementation of the PSCs. Just months after the release, several agencies have taken action to advance implementation and consideration of PSCs.
MDOT bases a majority of its project programming approach on FHWA’s list of PSCs. MDOT assists local agencies in identifying safety projects by providing resources such as traffic crash maps, safety guides, locally calibrated Highway Safety Manual (HSM) spreadsheets, and local/regional road safety plans. Through its Local Safety Initiative (LSI), MDOT helps local agencies analyze their crash data and provides recommendations on countermeasures, with an emphasis on proven, low-cost fixes.
As part of its fiscal year 2021 Highway Safety Improvement Program (HSIP) implementation plan, several actions were identified for the State of Michigan to undertake to achieve or make significant progress toward achieving Michigan’s safety performance targets in subsequent years. Two actions included:
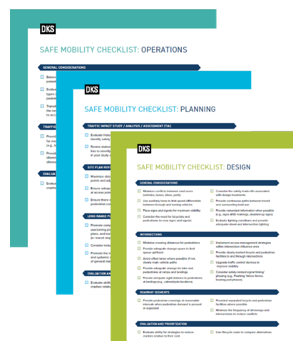
The full set of FHWA’s 28 PSCs can be overwhelming to local agencies, and while FHWA has added functionality (search and filter tools) to its web pages, MDOT has identified a subset of the PSCs for local agencies. Following FHWA’s most recent iteration of the PSC initiative, MDOT developed, and recently updated, two reference documents for local agencies to use when identifying appropriate PSCs for a location of interest:
The documents highlight crash reductions associated with each PSC, outline key considerations for and benefits of the PSCs, and reference other documents that can provide additional information on the PSCs. MDOT has provided links to its own policies and guidance for several PSCs in Making our Roads Safer: One Countermeasure at a Time. MDOT has identified other opportunities through the streamlined systemic HSIP process and other project selection efforts to emphasize the use of the PSCs, all with the goal of elevating safety as its top priority.
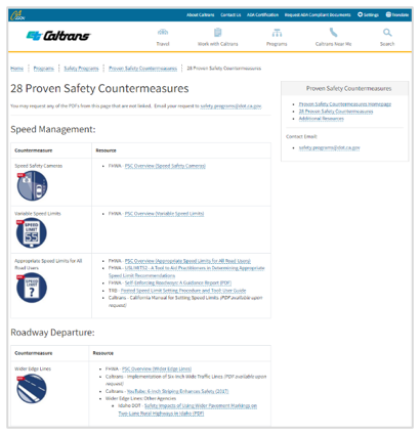
To address an unacceptable trend of increases in fatalities and serious injuries on its roadways, Caltrans has taken a bolder, more focused approach by updating the State’s Strategic Highway Safety Plan (SHSP) with four new pillars of traffic safety:
Implementation of PSCs aligns with most pillars, and most directly with the first, Double Down on What Works. California’s 2020–2024 SHSP implementation plan calls on challenge area teams to maximize the use of countermeasures that have demonstrated effectiveness. The teams are strongly encouraged to consider actions that are consistent with strategies documented in safety-related resources, including FHWA’s PSCs.
As part of the commitment to the strategies and actions identified in the SHSP, Caltrans launched a new website as a one-stop-shop for PSC tools and guidance. While FHWA’s PSC materials served as the foundation of the content and information on the website, Caltrans added supplementary resources under each PSC, including other relevant publications and guidance, Caltrans-specific policies, and noteworthy practices from other agencies.
Caltrans, recognizing the need to evolve with the changing environment and maximize statewide efforts to eliminate fatalities and serious injuries, has committed to issuing guidance and standards that support the effective implementation of PSCs.
“We currently have four teams working on new PSC guidance,” said Russell Wenham, the PSC portfolio manager for Caltrans. “We look forward to publishing the new guidance in summer 2022 and then starting up additional teams to tackle other PSC topics,” he went on to say.
FHWA’s PSC web pages provide many resources to assist agencies with implementation of the PSCs in their jurisdictions. The PSCs are referenced widely throughout many other FHWA publications, initiatives, and resources. They can be a great addition to any agency’s safety toolbox when trying to address a safety problem. As evidenced by recent highway safety trends, we have a lot of work to do, and the PSC initiative is an area where there is tremendous opportunity to consider and integrate them into everything we do.
For more information or assistance, please contact Phillip Bobitz, P.E., at Phillip.bobitz@dot.gov.
By Cate Satterfield, FHWA Office of Safety
An ounce of prevention is worth a pound of cure. The Rhode Island Department of Transportation (RIDOT) performed a systemic analysis so it could apply proven countermeasures at horizontal curves before crashes happen. This is critical because approximately 40 percent of roadway departure fatalities in Rhode Island occur on curves, but these crashes often don’t happen twice at the same curve.
RIDOT developed a systemic risk assessment for all horizontal curves on State roadways to determine which curves have the highest potential for crashes. Using 5 years of injury crash data (from 2014 to 2018) and the RIDOT Model Inventory of Roadway Elements (MIRE) data for analysis, RIDOT found that focus crash types were fixed object and motorcycle crashes. Crash tree diagrams were developed for each crash type to determine the risk factors, which included curve radius, shoulder width, and traffic volume. Being a small State, even with 5 years of data, using only fatal and suspected serious injuries was too small a sample size, so RIDOT added in the other injury types.
RIDOT then reviewed the entire network for the identified risk factors to assign a risk score to each curve location. Curves where crashes had not been reported recently still had a high risk score if the curves had many of the same features as those where crashes have occurred–this indicates the curve’s potential for future crashes. The risk score assisted RIDOT in prioritizing the curve locations for countermeasure implementation in its transportation improvement plan
The year 2020 significantly challenged our industry due to the pandemic. Data collection halted, causing many projects to flounder with so many future unknowns. Despite the uncertain times and inability to collect realistic traffic data, this systemic approach to implementing countermeasures allowed RIDOT to move the project forward. During this unprecedented time, RIDOT expanded the initiative to develop a data-collection application to streamline field efforts and ongoing data collection at curve locations.
As part of this effort, RIDOT developed a flow chart that streamlined the diagnosis process. The designer begins with planning-level MIRE data and collects additional data in the field, such as stopping sight distance, speeds, and the presence of signage for each project. RIDOT applies the information collected in the field, along with a detailed crash review (if crashes occurred), to the flow chart to select the appropriate countermeasure (or enhancements to existing countermeasures). Once a countermeasure has been identified, the improvements are programmed to be implemented via maintenance work order (e.g., signing, striping, guardrail) or as part of a contract (e.g., high friction surface treatment, shoulder widening).
Systemic risk assessment is a powerful tool to support the implementation of lifesaving countermeasures. Even when data are scarce and a pandemic changes the landscape of transportation data collection, as RIDOT discovered, this method of risk assessment can keep a State moving toward zero deaths and serious injuries.
For more information, contact Cate Satterfield at cathy.satterfield@dot.gov.
By: Dick Albin, FHWA Resource Center and Juan Carlos Rivera-Ortiz, Puerto Rico and U.S. Virgin Islands Division
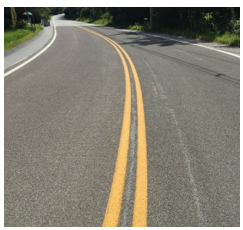
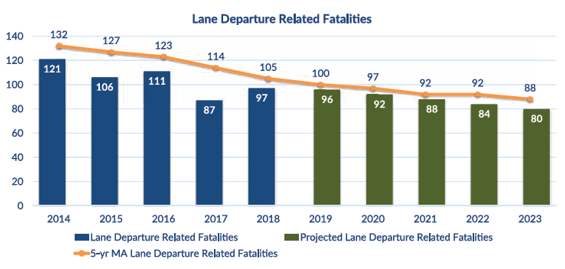
In Puerto Rico, lane departures account for 38 percent of roadway fatalities. While the number of these crashes has been declining, the Puerto Rico Strategic Highway Safety Plan showed that over 100 people are killed each year. This is a large number for a small island. The challenge is amplified by the fact that treatments can be difficult to implement due to geometric constraints, especially in the mountainous region of the island.
As part of the Focus on Reducing Rural Roadway Departures (FoRRRwD) initiative, Puerto Rico Local Technical Assistance Program (LTAP) staff attended a train-the-the trainer session for a course on roadway departure countermeasures and then delivered several webinars to nearly 300 participants. In addition, the LTAP provided translations that were used to develop Spanish-language versions of the FoRRRwD trading cards. Translating these cards facilitated the explanation and visualization of rural roadway departure crash types, countermeasures, and tools.
To combat these crashes, the Puerto Rico Highway and Transportation Authority (PRHTA) developed highway safety corridors where they evaluated countermeasures such as rumble strips (shoulder and center line), horizontal curve warning signs, high friction surface treatments (HFST), SafetyEdgeSM, and guardrail upgrades. As part of the Highway Safety Improvement Program (HSIP), designers must consider the aforementioned countermeasures to promote a forgiving approach to the highway system.
More than 200 kilometers (125 miles) of shoulder rumble strips and 50 kilometers (30 miles) of centerline rumble strips have been installed in Puerto Rico over the last 10 years. PRHTA installed HFST on five horizontal curves and will be evaluating their performance for possible use at additional locations in the future. PRHTA will continue to work on data analysis to identify appropriate locations to implement FoRRRwD countermeasures, and the LTAP will continue to educate the professional community.
For more information, please contact Juan Carlos Rivera-Ortiz at juan.riveraortiz@dot.gov or Dick Albin at dick.albin@dot.gov.
By Scott Seibel, E.I.T., Michael Baker International
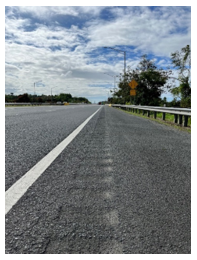
Historically, longitudinal pavement markings across the Pennsylvania Turnpike Commission (PTC) have consisted of waterborne markings in conjunction with snowplowable raised pavement markers (SRPMs) to provide travelers with adequate lane guidance along the roadway. SRPMs, which consist of a retroreflective lens with a heavy cast iron housing embedded into the roadway, have previously been the only solution to provide suitable wet retroreflectivity in conjunction with longitudinal pavement markings.
Although waterborne pavement markings are cost-effective to install, they degrade significantly over a short period of time because of winter maintenance activities and traffic. Due to the quick degradation of waterborne pavement markings, PTC installs them two times per year (spring and fall) to ensure adequate delineation across the turnpike year-round. SRPMs are in place to supplement the longitudinal waterborne pavement markings and better delineate the lane assignments for nighttime and wet weather conditions. SRPMs require inspection and lens replacement every 2 years. SRPM maintenance is a tedious and manual task that requires personnel to be in close proximity to live traffic. SRPMs may also create a hazard to motorists if castings become dislodged from the pavement surface.
PTC began to assess the performance of highly reflectorized durable pavement markings to improve the quality and visibility of pavement markings across the turnpike while also minimizing installation and maintenance costs and safety risks. These markings would replace waterborne pavement markings and SRPMs by simultaneously providing wet nighttime retroreflectivity. In 2011, PTC began installing highly reflectorized durable markings in a recessed groove along the roadway as a pilot program. As of 2021, PTC has deployed these markings for approximately 80 percent of the longitudinal lines across the system.


Highly reflectorized durable pavement markings are similar to typical markings, except they contain additional retroreflective elements suitable for wet (submerged) conditions. These wet-retroreflective elements are comprised of smaller beads clustered around a central core, making them larger in size. Due to the increased size, longitudinal markings are typically applied in a recessed groove to prevent damage from winter maintenance operations and traffic. With this additional wet-retroreflective element, highly reflectorized durable pavement markings provide adequate retroreflectivity during wet nighttime conditions without the need for SRPMs.
Currently PTC deploys two types of highly reflectorized durable pavement markings: recessed all-weather tape and recessed highly reflective polyurea pavement markings. Recessed all-weather tape is a premanufactured, highly durable, and abrasion-resistant tape with an approximate life expectancy of 8–10 years. This life expectancy allows for a no-touch approach, matching PTC’s current pavement life cycle at most locations. Highly reflective polyurea is a liquid-based material that requires adding retroreflective elements during installation. It has an approximate life expectancy of 3–4 years. In addition to installing recessed polyurea markings, PTC installs surface-applied polyurea pavement markings if the expected remaining pavement life is 2 years or less at the time of installation.
While PTC conducts a blanket replacement of waterborne pavement markings twice per year, it conducts a retroreflectivity and conditions assessment once per year across the PTC to ensure that retroreflectivity standards are met and all pavement markings are in adequate condition. The results are integrated into a pavement marking asset management system to aid PTC’s future planning.
Using historical pavement marking degradation rates and costs, PTC conducted an analysis to better understand the life cycle costs and best practices of pavement markings across its system. The analysis compared and contrasted installation and maintenance costs of recessed all-weather tape, recessed polyurea markings, and waterborne markings (with SRPMs) based on varying pavement life of the roadway over a 30-year period. The analysis concluded that with PTC’s current installation practices, recessed all-weather tape and recessed polyurea markings are comparable in cost to waterborne markings (with SRPMs) when considering the entire life cycle of the marking.
PTC has determined that adequate pavement markings are a critical component of the safe operation of the system. Incorporating highly reflectorized durable pavement markings enhances retroreflectivity and creates a safer roadway environment for motorists and maintenance personnel by eliminating SRPMs and the need to paint the roadway twice each year. Although PTC has developed a robust highly reflectorized durable pavement marking program since 2011, it continues to test and analyze current and new practices to improve safety across the system.
For more information, please contact Justina Wentling, PTC’s assistant manager of traffic engineering, at jwentlin@paturnpike.com.
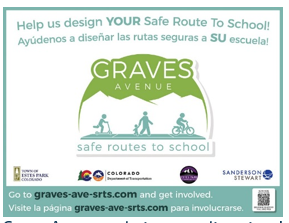
By: Kerry Perrillo Childress, P.E., RSP1 Sanderson Stewart, and Dahir Egal, FHWA Colorado Division Office
The Town of Estes Park, CO, was awarded a Safe Routes to School grant to construct sidewalk along Graves Avenue, a 1,150-foot-long corridor that connects a major arterial roadway (Highway 7) with the campus of the Town’s elementary, middle, and high schools as well as the adjacent Estes Valley Community Center. Approximately 25 percent of the school district’s student population lives along Graves Avenue or across Highway 7, where a pedestrian-actuated crossing has been installed to help guide pedestrians across the highway. Graves Avenue is a primary travel route to the school district and community center, but it lacks continuous sidewalks along either side of the road. The existing Graves Avenue corridor consists of a 32-foot-wide paved street with a dirt shoulder on both sides and an on-street parking lane alongside the southbound travel lane. There are 13 driveway access points for businesses and multifamily residences along the corridor. Crash data revealed sight-distance issues at these access points, which are created by the on-street parking lane for vehicles entering and exiting the south-side properties, as well as sight-distance issues on the north side at some steep driveway crests.
A large Latinx population lives along both sides of Graves Avenue and across Highway 7. The town’s request for proposal specifically mentioned providing equitable outreach to the Latinx community given their elevated presence in this area. A Spanish-language website and dual-language materials (e.g., yard signs, flyers) were created to help guide the Spanish-speaking community to the website with the help of the school district’s translator and community liaison Jose Almeida. The Spanish-language website included the initial project survey, which asked about concerns, desires, and user information for students traveling to school via Graves Avenue. The analytics showed that the website was not well utilized during this first phase of outreach: Only two initial surveys were filled out via the Spanish-language website.
The project’s conceptual design phase included more planned community engagement to allow the public to rank its preferred designs and include any additional design ideas, comments, or concerns. Learning from the unsuccessful efforts of the first phase of the project, a new approach was developed to help engage the Latinx community. The school district partnered with the town and the design team to plan a summer celebration located in the residential parking lot on the south side of Graves Avenue. The event featured food, ice cream, festive music, and a presentation of the design options with the intent to engage the Latinx community and encourage their opinions to be voiced on the conceptual designs.
The school district provided multiple translators at this event to help facilitate discussion. The event was a success and resulted in robust participation, including more than 60 completed surveys. The town provided funding for food and additional outreach to engage this traditionally underrepresented community, and representatives happily served food and mingled with residents.
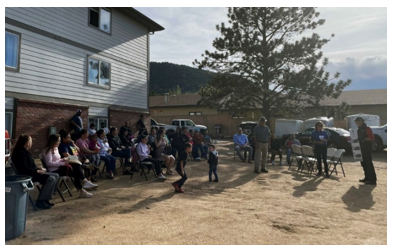
During the presentation of design options, there was an open and effective dialogue between Latinx community members and the town that was invaluable and likely not attainable from either an online survey alone or in a traditional town-wide meeting. The Spanish-speaking community voiced new ideas and considerations that had not previously been heard or considered. The Town of Estes Park is a terrific example of making a unique and deliberate effort to engage diverse populations to gather feedback, which will ultimately help create a transportation system that will better serve all members of the community.
For more information, please contact Dahir Egal at dahir.egal@dot.gov or Kerry Childress at kchildress@sandersonstewart.com.
By Wilfred Hernandez, Ph.D., P.E., FHWA Rhode Island Division
Throughout the United States, fatalities and serious injuries are on the rise among vulnerable road users such as pedestrians and bicyclists. Rhode Island Department of Transportation (RIDOT) developed a statewide pedestrian and bicycle initiative to address these crashes. To help kick off this initiative, RIDOT applied for and was awarded funding from FHWA through the State Transportation Innovation Councils (STIC) to advance the development of an uncontrolled midblock crossing evaluation tool.
With the support of STIC funding, RIDOT’s pedestrian and bicycle initiative began to address safety at more than 900 State-owned midblock crosswalks. An inventory and a risk assessment of all State crosswalks and roadways were conducted to help prioritize improvements at unprotected (i.e., unsignalized) crosswalks. An application was developed for collecting data, streamlining field visits, and eliminating paperwork. The application geolocated signage, pavement markings, and the supplemental pictures of roadway elements that accompany the traditional field documentation.
As this is not a new technology, presenting these data within a dashboard allowed the team to develop an automated countermeasure selection for each individual crosswalk, which is a revolutionary twist on existing technology. Through streamlining data collection, the dashboard was developed to automate crash countermeasure selection for each inventoried crosswalk. The risk assessment was then incorporated within the dashboard, allowing the team to use predictive methods to determine the crosswalks with the highest risk factors.
Creating the fluid dashboard enabled the team to pivot from traditional field inventory techniques and paper documentation to a user-friendly, geolocated application that allows multiple people and groups to access and review information. This dashboard also allows RIDOT to track the enhanced crosswalks in real time. These data can also be cross-referenced for asset management purposes.
To help further diagnose the best improvements for each crosswalk, RIDOT developed a flowchart of several inputs (number of lanes, traffic volume, speed, etc.). This flowchart is based on FHWA STEP guidance and helps RIDOT select the most applicable treatment, such as enhanced signing and striping, geometric improvements, or enhanced warning such as rapid rectangular flashing beacons (RRFB) and pedestrian hybrid beacons (PHB/HAWK).
RIDOT is currently implementing the findings of the newly developed RIDOT uncontrolled midblock crossing evaluation. Locations were prioritized based on the potential risk to pedestrians using more than 20 attributes, including traffic volume, crash history, roadway characteristics, and adjacent land use features such as proximity to schools and transit stops.
To help streamline the implementation phase of the STEP program, RIDOT applied for and was awarded $1 million from FHWA through the Accelerated Innovation Deployment Demonstration Program. As part of this project,
20 State-owned crosswalks will be improved at the most critical crosswalk locations. Enhancements to the crosswalks include innovative technologies such as RRFBs and PHB/HAWK.
This demonstration program will allow RIDOT to kick-start its pedestrian initiative and evaluate and identify how the crosswalk enhancements improve pedestrian connectivity and community mobility. Successful application of this project will allow RIDOT to implement these technologies as a standard practice throughout the State as well as work with local municipalities to share the results of this evaluation.
As part of the current SHSP and STIP rewrites, RIDOT is allocating HSIP funding to this program to help address midblock crosswalks on a statewide level. RIDOT plans to deploy most, if not all, future improvements through project bundling or other contracting vehicles. This will not only maximize funding by reducing overhead costs but also streamline installation.
RIDOT is also working on pedestrian safety through other crosswalk improvement initiatives, such as installing Road Diets on more than 20 4-lane roads statewide, upgrading pedestrian clearance timings, and deploying lead pedestrian intervals, where applicable, at more than 700 State-owned signals.
For more information, please contact Wilfred Hernandez at wilfred.hernandez@dot.gov.
By Karen Scurry, FHWA Office of Safety
Did you know that every crash modification factor (CMF) in the FHWA CMF Clearinghouse has a unique identification number (ID)? The CMF ID allows you to easily document the CMF in a report, study, or presentation for future reference. The CMF ID also allows others to quickly and easily find the CMF in the CMF Clearinghouse to determine if it is applicable to a particular scenario.
The CMF ID is listed at the top of the CMF Details web page. This page provides all the details about a particular CMF, as shown in the screenshot below. Each CMF Details page has a unique URL, or web address. For example, the URL for CMF ID 3127 is http://www.cmfclearinghouse.org/detail.cfm?facid=3127. The CMF ID is noticeable as the final characters at the end of that URL.
There are two ways to locate specific CMFs using the CMF ID number, as illustrated in the screenshot above:
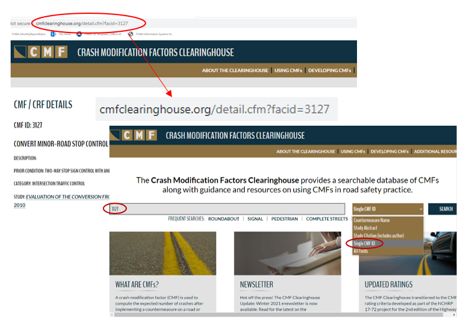
For additional information about the CMF Clearinghouse, using CMFs, developing CMFs, or finding CMF resources, visit http://www.cmfclearinghouse.org or contact Karen Scurry at karen.scurry@dot.gov or 202-897-7168.
By Esther Strawder, FHWA Office of Safety
NHI has a new award-winning, web-based training. The course, entitled Where Highways Meet Rails: Crossing Safety (FHWA-NHI-380126), is an updated, virtual version of NHI’s course on highway-rail grade crossing safety that covers material from the Highway-Rail Crossing Handbook, Third Edition. The interactive course is now available free of charge on NHI’s website for all rail highway professionals.
For more information, contact Esther Strawder at esther.strawder@dot.gov.
By: Thomas Elliott, FHWA NHI and Sabrina Sylvester, NHI contractor
FHWA’s National Highway Institute (NHI) focuses on providing innovative, learner-centric, and relevant training that meets the needs of today’s transportation community.
NHI has revised the Using Interactive Highway Safety Design Model (IHSDM) (FHWA-NHI-380100) online training course, which teaches participants about the IHSDM software program. IHSDM is a collection of software analysis tools that evaluates the operational effects and safety of geometric design decisions on our Nation’s highways. The online training teaches participants how to evaluate highway designs, compare alternatives, and provide investment decisions through IHSDM and how it can produce data-driven decisionmaking to make our Nation’s highways, roads, and streets safer for our communities. IHSDM automates policy designs, safety performance evaluations, and economic assessments that help provide data-driven decisionmaking in the highway design process. Participants will also learn the concepts behind the IHSDM and how the software should be used, including using it to analyze and evaluate real highway designs.
NHI designed this online training as an interactive, engaging, and blended course where learners will be able not only to learn about IHSDM but to use it in real-life applications.
Participants will begin by learning the basics of IHSDM at their own pace with guided, web-based training. Then, they will take virtual, instructor-led training where they will learn how to apply IHSDM modules and outputs to make real-world decisions pertaining to highway design.
This course is expected to take an average of 14 hours of training time. Participants can work through the course materials, interact with the instructors, and complete all the course assignments virtually. At the end of the training period, participants who pass the exam with a grade of 70-percent or higher will earn 1.4 continuing education credits. More important, participants will have a level of understanding of IHSDM that will enable them to better create, analyze, and justify geometric design decisions throughout the highway designs process.
To learn about the IHSDM course along with other highway safety training courses, visit the NHI website. For more information about IHSDM, and to access this free, publicly available software tool, visit FHWA’s Interactive Highway Safety Design Model (IHSDM) Overview page.
For more information, please contact Thomas Elliott at Thomas.elliott@dot.gov.
By: Chimai Ngo, Office of Safety
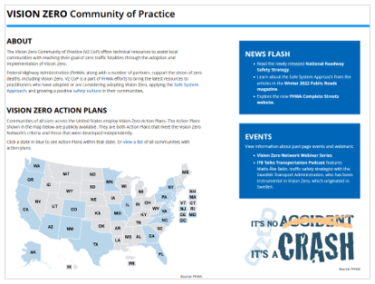
FHWA is pleased to announce the launch of the FHWA Vision Zero Community of Practice (CoP) web page. The Vision Zero CoP offers a one-stop shop for technical resources and information that local communities can use to develop and implement safety efforts to reach their goal of zero roadway fatalities.
FHWA supports the vision of zero deaths, including Vision Zero. The Vision Zero CoP is a component of FHWA technical assistance efforts to bring the latest resources to practitioners who have adopted or are considering adopting Vision Zero, applying the Safe System Approach, and growing a safety culture in their communities.
The Vision Zero CoP web page includes a database of Vision Zero action plans; reports, guides, and success stories related to planning and implementation of Vision Zero; funding information; and news and events. In addition, there is a section with information about the ongoing FHWA Vision Zero Community Pairing Pilot. FHWA will continuously update the CoP web page to bring new resources and information to visitors.
The CoP web page is housed in the FHWA Roadway Safety Professional Capacity Building Program website and can also be accessed from the FHWA Zero Deaths – Resources web page.
For more information, please contact Chimai Ngo at chimai.ngo@dot.gov.By Martha C. Kapitanov, FHWA Office of Operations
The return of warmer weather means that more work zones will soon appear on the Nation’s roadways. For this reason, the FHWA and its partners sponsor National Work Zone Awareness Week (NWZAW) every spring to highlight motorist and worker safety and mobility issues in and around work zones. This year, NWZAW was recognized on April 11–15. The theme for this year is “Work Zones are a Sign to Slow Down.”
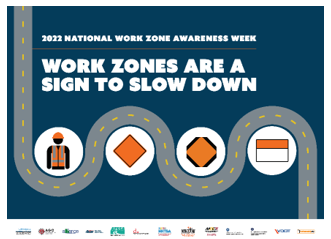
NWZAW provides an opportunity for everyone to reflect on how to address the ongoing safety challenges in work zones. This year brings new challenges with a potential for more work zones following the passage of a new transportation funding law as well as new opportunities to fund and implement new technologies and strategies to make work zones safer.
The recently passed Infrastructure Investment and Jobs Act, also known as the Bipartisan Infrastructure Law (BIL), is the basis for FHWA programs and activities through September 30, 2026. It makes a historic investment of $350 billion in highway programs, including the largest dedicated bridge investment since the construction of the Interstate Highway System and a variety of new programs.
This increased investment will increase the number of work zones on the Nation’s roadways while also compounding associated safety issues for motorists and workers. To help minimize work zone impacts, the BIL includes funding to support multiple efforts and includes an overarching emphasis on keeping workers in work zones safe.
States have successfully demonstrated and institutionalized a variety of new technologies and strategies in recent years to improve safety in work zones. For instance, more States are conducting data-driven work zone safety analyses, such as a “hard braking” data analysis conducted by Indiana.
Other States like North Carolina and New Jersey are now providing in-vehicle “dangerous slow down” information to commercial motor vehicles to improve work zone safety. The BIL offers opportunities to continue this trend with funding to support or expand existing programs and for new strategies that can improve safety in work zones, including those highlighted below.
Safety contingency funds. Some States, like Texas, have successfully demonstrated safety contingency funds as a mechanism for quickly addressing safety issues that arise during construction. The BIL now allows Federal share for “contractual provisions that provide safety contingency funds to incorporate safety enhancements to work zones prior to or during roadway construction activities” (Section 11107).
Automated speed enforcement. Although successfully demonstrated in work zones in States like Illinois and Maryland for a number of years, the BIL includes a provision for States to “carry out a program to purchase, operate, or maintain an automated traffic enforcement system in a work zone” (Section 24102).
Strategic Highway Safety Plan (SHSP). Some States like California and Arkansas include work zones as an emphasis area in their SHSP. The SHSP is a data-driven plan that can be used to help fund Highway Safety Improvement Program (HSIP) activities. The BIL significantly increased HSIP funding activities, so States may leverage their SHSP to improve work zone safety.
Collectively, the strategies and programs highlighted above can improve work zone safety by reducing fatalities and injuries in work zones in support of USDOT’s top priority: safety. On January 29, 2022, Secretary Pete Buttigieg unveiled the National Roadway Safety Strategy and unequivocally stated that “to change the trajectory of roadway safety in this country is a single, ambitious shared goal ”our goal is zero deaths.” FHWA fully supports the vision of zero deaths and serious injuries on the Nation's roadway system and recognizes the Safe System Approach as the best way to accomplish this goal. Work zones remain a key area of focus for FHWA to make this vision a reality.
Work zones continue to disproportionately impact safety for all road users. National Work Zone Awareness Week is a reminder to all of us to re-commit ourselves in the coming year to do everything possible to address work zone impacts so that we may make the Nation’s roadways safer for everyone.
For more information on work zone management training, regulations, resources, and tools visit the FHWA Work Zone Management website.
For more information, contact Martha Kapitanov at martha.kapitanov@dot.gov.
NACo 2022 Annual Conference and Exposition. The National Association of Counties annual meeting will be held in Adams County, CO, July 21–24, 2022.
ITE Annual Meeting and the National Rural ITS Conference 2022. The National Rural ITS Conference will be held jointly with the Institute of Transportation Engineers’ annual convention in New Orleans, LA, from July 31 through August 3, 2022.The theme for this year’s event is “Investing in our Future.
The 2022 Traffic Records Forum. The Association of Transportation Safety Information Professionals will hold its annual meeting from August 7–10, 2022, in Denver, CO. The call for speaker abstracts is now open.
PWX 2022. The American Public Works Association’s annual Public Works Expo will be held in Charlotte, NC, August 28–31, 2022. Note that the call for presentations for PWX 2023 will open July 8, 2022.
GHSA 2022. The Governors Highway Safety Association will be meeting in Louisville, KY from September 17–21, 2022. The theme for this year’s event is “Redefining Possible: Traffic Safety in a Changing World.”
Call for Abstracts and Proposals: Safer Roads International Conference 2023. Organizers of the triennial Safer Roads International Conference are now accepting papers as well as proposals for educational and poster sessions for this event, which will be held May 16–18, 2023, in Richmond, VA. The theme for this conference is “Connecting stakeholders. Transforming practices. Saving lives.” Proposals will fit into either a workshop format with presentations that share best practices and implemented safety solutions, or a technical session consisting of similar research. If you already submitted a proposal for the cancelled 2020/2021 Safer Roads Conference, please visit the Call for Proposals and Abstracts portal to resubmit your original proposal or to offer a new one. Early submissions are due by May 27, and the final deadline is October 21, 2022.
is a publication of the U.S. Department of Transportation, Federal Highway Administration (FHWA).
FHWA publishes the Safety Compass newsletter 3 times a year. We can be reached at:
FHWA Office of Safety
1200 New Jersey Ave. SE
Room E71-320
Washington, DC 20590
The Safety Compass is available online at the FHWA Office of Safety web site at: https://safety.fhwa.dot.gov/newsletter/safetycompass/.
We welcome your comments and highway safety-related articles. The purpose of this newsletter is to increase highway safety awareness and information and to provide resources to help save lives.
We encourage readers to submit highway safety articles that might be of value to the highway safety community. Send your comments, questions, and articles for review electronically to Tara McLoughlin at: tara.mcloughlin@dot.gov.

