U.S. Department of Transportation
Federal Highway Administration
1200 New Jersey Avenue, SE
Washington, DC 20590
202-366-4000
This section of the Desk Reference illustrates treatments designed to facilitate the safety of aging drivers on specific types of roadway segments. It contains four proven practices and six treatments that promise to support the needs of aging drivers.
Proven Practices
Promising Practices
White edge lines on horizontal curves (see Figure 51) are to be maintained at the following in-service contrast levels:
Contrast should be calculated according to the formula shown for Treatment 3: Channelization on page 10:
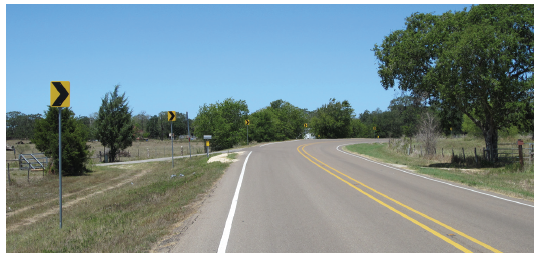
Figure 51. White edge lines, centerline RPMs, and chevrons on a horizontal curve
The use of retroreflective raised pavement markers (RPMs) is recommended to improve the visibility of surface delineation treatments on horizontal curves in the following situations where demands on motorists for path maintenance and vehicle guidance are increased:
In addition to the installation of chevron alignment signs (W1-8) as specified in the MUTCD, roadside post-mounted delineators should be installed on horizontal curves with approximate uniform spacing as shown in Table 7.
| Radius of Curve (Feet) | Approximate Spacing (Feet) |
|---|---|
| < 600 | 40 |
| 700 | 75 |
| 800 | 80 |
| 900 | 85 |
| > 1000 | 90 |
Note: Spacing for curves greater than 600 ft based on the following formula from the MUTCD (Table 3D-1):
![]()
Where:
S = approximate spacing on curve (ft)
R = radius (ft)
On two-lane rural roads, the combined (lane plus shoulder) paved width in one direction should be at least 18 ft throughout the length of the curve for a horizontal curve with a radius less than 1900 ft.
The rationale and supporting evidence for this treatment can be found beginning on page 260 of the Handbook.
Strict adherence to a perception-reaction time (PRT) of at least 2.5 s for a roadway hazard obscured by vertical curvature should be used in the design of new and reconstructed facilities.
Where a need has been determined for installation or replacement of a device to warn motorists that sight distance is restricted by a crest vertical curve, use the 30-in ×30-in HILL BLOCKS VIEW sign (MUTCD W7-6) with an Advisory Speed plaque (MUTCD W13-1P) as shown in Figure 52.
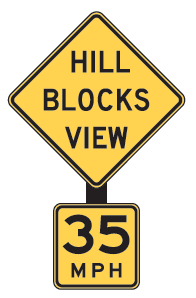
Figure 52. (MUTCD W7-6 and W13-1P)
If a signalized intersection is obscured by vertical curvature in a manner that the signal becomes visible at a preview distance of 8 s or less (at operating speed), then it is recommended that, in addition to the standard advance signal warning sign (MUTCD W3-3), a BE PREPARED TO STOP warning sign (MUTCD W3-4) and WHEN FLASHING plaque (MUTCD W16-13) be used along with a warning beacon interconnected with the traffic signal controller (see Figure 53). The yellow warning beacon should be activated at a sufficient interval prior to the onset of the yellow signal phase and sustained after the onset of the green signal phase to take into account the end of queues experienced during peak traffic conditions, as determined through engineering study. [See time-speed-distance table on page 5.]
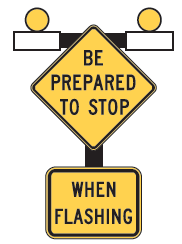
Figure 53. (MUTCD W3-4 and W16-13)
The rationale and supporting evidence for these treatments can be found beginning on page 272 of the Handbook.
To accommodate age-related difficulties in judging gaps and longer decision-making and reaction times exhibited by aging drivers, use the most conservative minimum required passing sight distance (PSD) values from the 2009 MUTCD, Table 3B-1. See Table 8.
| 85th-Percentile or Posted or Minimum Passing | Statutory Speed Limit Sight Distance |
|---|---|
| 25 mph | 450 feet |
| 30 mph | 500 feet |
| 35 mph | 550 feet |
| 40 mph | 600 feet |
| 45 mph | 700 feet |
| 50 mph | 800 feet |
| 55 mph | 900 feet |
| 60 mph | 1,000 feet |
| 65 mph | 1,100 feet |
| 70 mph | 1,200 feet |
The MUTCD oversized (48-in ×64-in ×64-in) NO PASSING ZONE pennant (W14-3), or the standard size (36 in ×48 in ×48 in) pennant using fluorescent yellow retroreflective sheeting, is recommended as a high-conspicuity supplement to conventional centerline pavement markings at the beginning of no passing zones (see Figure 54).
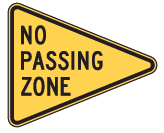
Figure 54. (MUTCD W14-3)
To the extent feasible for new or reconstructed two-lane facilities, the implementation of passing/overtaking lanes (in each direction) at intervals of no more than 3.1 mi is recommended.
The rationale and supporting evidence for these treatments can be found beginning on page 277 of the Handbook.
To increase the legibility distance of overhead lane-control signal indications for prohibited movements (red X), use a double-stroke arrangement of pixels that are small (approximating 0.15 in diameter) and closely spaced (approximating 0.70 in center-to-center), as shown in Figure 55.
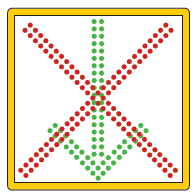
Figure 55. Lane control signal (adapted from Ullman et al. 1996)
The rationale and supporting evidence for these treatments can be found beginning on page 281 of the Handbook.
Where a through lane becomes a mandatory turn lane at an intersection or becomes a mandatory exit lane at an interchange, a "dotted" lane line should be used to separate the continuing through lane from the mandatory turn or mandatory exit lane, as described in Section 3B.04 of the 2009 MUTCD and as shown in Figure 56.
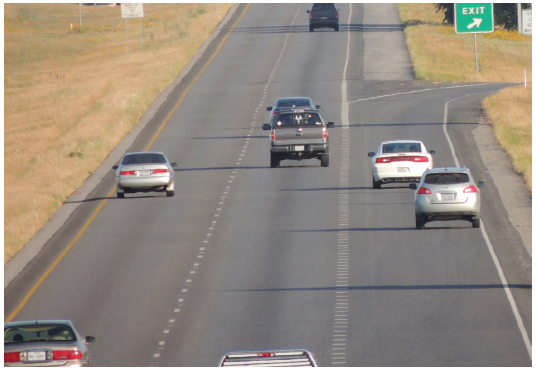
Figure 56. Dotted lane line markings at freeway lane drop
The rationale and supporting evidence for these treatments can be found beginning on page 284 of the Handbook.
Contrast markings should be used wherever the pavement color is light to increase visibility of pavement markings (see MUTCD Section 3A.05 and Figure 57).
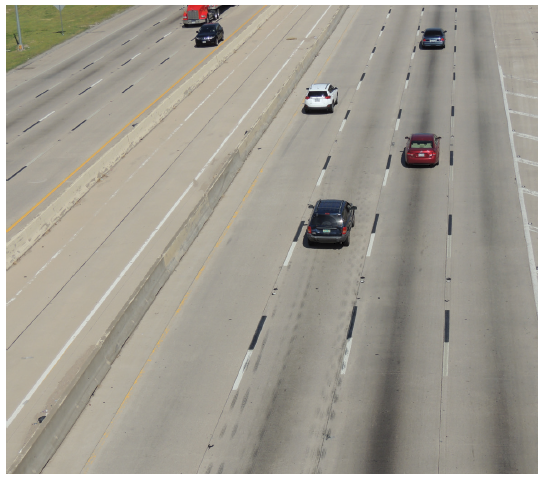
Figure 57. Contrast markings on light colored pavement
The rationale and supporting evidence for these treatments can be found beginning on page 284 of the Handbook.
To maintain visibility under adverse driving conditions, use highly retroreflective marking material.
The rationale and supporting evidence for these treatments can be found beginning on page 285 of the Handbook.
Curve warning pavement markings, such as shown in Figure 58, should be considered as a supplement to curve warning signs at horizontal curves identified as a safety problem.
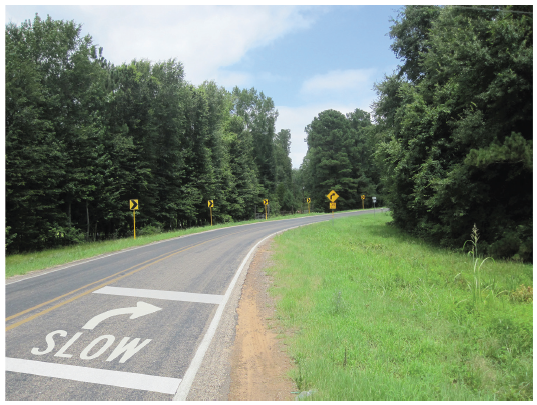
Figure 58. Curve warning markings (MUTCD:5)
The rationale and supporting evidence for these treatments can be found beginning on page 285 of the Handbook.
When performing an evaluation or road safety audit of a roadway segment that may be redesigned or reconstructed, a road diet should be included among the options to be considered. An example of a completed road diet is shown in Figure 59.
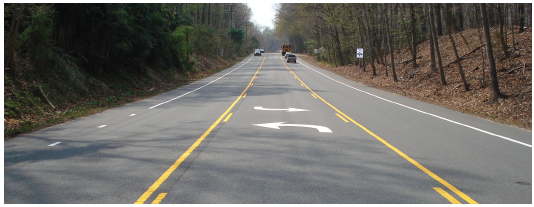
Figure 59. Example of a road diet
The rationale and supporting evidence for these treatments can be found beginning on page 286 of the Handbook.
High friction surface treatments (HFST) are recommended on horizontal and vertical curves (such as the example shown in Figure 60), at intersections, at on and off-ramps, on bridge decks, locations prone to frequent rain, snow, or ice, or where additional side friction is beneficial.
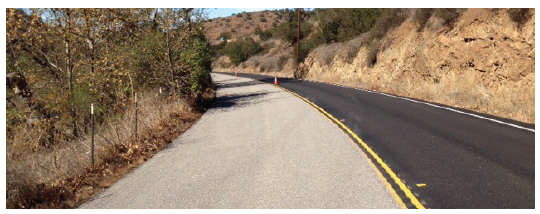
Figure 60. High friction surface treatment on a Horizontal Curve

