U.S. Department of Transportation
Federal Highway Administration
1200 New Jersey Avenue, SE
Washington, DC 20590
202-366-4000
August 2008
| < Previous | Table of Contents | Next > |
In 2005, Congress passed in law a new authorization of surface transportation programs, the Safe, Accountable, Flexible, Efficient Transportation Equity Act: A Legacy for Users (SAFETEA-LU), Public Law 109-59. Section 2003(e) of this legislation reads as follows:
SEC. 2003. HIGHWAY SAFETY RESEARCH AND OUTREACH PROGRAMS
(e) PEDESTRIAN SAFETY.-
(1) IN GENERAL.-The Secretary shall-
(A) produce a comprehensive report on pedestrian safety that builds on the current level of knowledge of pedestrian safety countermeasures by identifying the most effective advanced technology and intelligent transportation systems, such as automated pedestrian detection and warning systems (infrastructure-based and vehicle-based), road design, and vehicle structural design that could potentially mitigate the crash forces on pedestrians in the event of a crash; and (B) include in the report recommendations on how new technological developments could be incorporated into educational and enforcement efforts and how they could be integrated into national design guidelines developed by the American Association of State Highway and Transportation Officials.
(2) DUE DATE.-The Secretary shall complete the report under this subsection not less than 2 years after the date of enactment of this Act and submit a copy of the report to the Committee on Commerce, Science, and Transportation of the Senate and the Committee on Transportation and Infrastructure of the House of Representatives.1
This report is designed to satisfy the stated legislative requirement.
The contents of this document are largely derived from a more extensive Federal Highway Adminstration (FHWA) technical report whose purpose was to identify the most promising advanced technologies being developed to improve pedestrian safety. In developing that technical report, information was obtained from three sources: 1) a literature search to identify and secure information on advanced technologies that may improve pedestrian safety, 2) structured interviews with FHWA personnel who have pedestrian safety responsibilities, and 3) the FHWA's Highway Safety Information System (HSIS) and the National Highway Traffic Safety Administration's (NHTSA) Fatality Analysis Reporting System (FARS) databases. Information from the databases served to define crash characteristics and estimates associated with the potential technologies. A meeting was held with select FHWA personnel to gain their input on the initial draft plan. After updating the initial draft plan to include the input, the plan was shared with a select group of stakeholders outside of FHWA to gain their input, and the final draft plan incorporates the input received from those stakeholders. This document includes that input.
As a starting point, a basic understanding of the characteristics of the problem is important. Data from the FARS database show that of the 42,642 total highway deaths that occurred on U.S. highways in 2006, 4,784 were pedestrian deaths.
To provide a frame of reference for the issue of pedestrian safety in its entirety, some key statistics from the 2006 FARS database associated with these 4,784 pedestrian deaths are as follows2 :
While the actual speeds in each individual crash are not known from the crash data, the speed limit may be considered an indicator of the prevailing speeds on the highway. As speeds increase, the severity of pedestrian crashes generally increases: 2,770 of the 4,784 pedestrian deaths occurred at locations where the speed limit was equal to or greater than 40 mph. However, special pedestrian crash studies conducted by NHTSA and other countries in support of a United Nations global technical regulation (i.e., an international agreement on automobile safety standards) show that about 50 percent of all child and about 40 percent of all adult head and leg injuries were sustained at crash velocities at or below 40k/hr (25 mph).5
Time of day also plays a role in pedestrian fatality levels. The distribution of pedestrian deaths by known light conditions6 is as follows:
From the above information some of the major concerns are as follows:
Select demographic information from the FARS data system and NHTSA publications are as follows:
| Age Range | Number of Fatalities* | Population (thousands) | Fatality Rate** |
|---|---|---|---|
| 0-15 | 369 | 60,754 | 0.60 |
| 16-34 | 1,179 | 82,851 | 1.42 |
| 35-54 | 1,703 | 86,945 | 1.96 |
| 55-74 | 941 | 50,504 | 1.86 |
| 75+ | 530 | 18,344 | 2.89 |
| * There were 62 pedestrian fatalities in which the age of the victim was unknown or not reported. **Deaths per 100,000 people. Source: U.S. Census Bureau, "2006 Population Estimates," DP.1 General Population Characteristics, and the National Highway Traffic Safety Administration, Fatality Analysis and Reporting System, "Persons Killed, by Age - State: USA, Year: 2006." |
|||
In sum, over the past 10 years, approximately 50,000 pedestrians have died and over a half million have been injured, illustrating the significance of the pedestrian crash problem over time. This is shown in the chart on the next page.
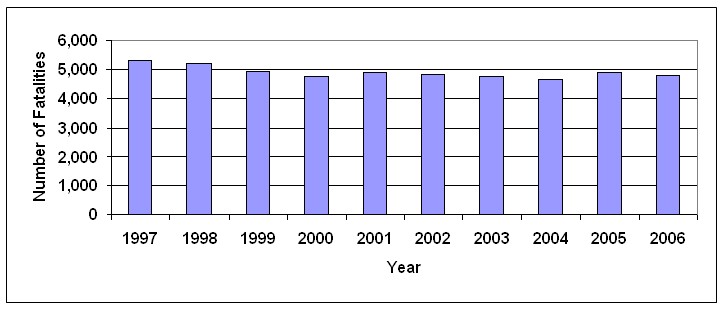
Pedestrian Fatalities by Year
The following section identifies some major concerns associated with pedestrian fatalities and serious injuries that may be influencing these numbers.
Pedestrian crashes involve a number of factors or conditions that increase the potential for a crash. Some of the primary concerns assembled from the literature and crash data are as follows:
Drivers
Pedestrians
Infrastructure
Environment and Unforeseen Events
Interactions and Data Issues
1 Public Law 109-59: Safe, Accountable, Flexible, Efficient Transportation Equity Act: A Legacy For Users, August 10, 2005.
2 Data in this section were derived from the "Fatality Analysis Reporting System Encyclopedia," maintained by the National Highway Traffic Safety Administration, and contains data from 2006, the most recent year available to the public at the writing of this report.
3 There are probably additional pedestrian fatalities that occurred at signalized and stop controlled intersections, but determining these numbers is not possible due to insufficient data.
4 Ibid.
5 PS-131, "Analysis of Pedestrian Accident Situation and Portion Addressed by this GTR - 8th GRSP Ad Hoc Meeting, Brussels, Belgium, July 11 - 14, 2005." http://www.unece.org/trans/main/wp29/wp29wgs/wp29grsp/pedestrian_8.html
6 There were 4,724 pedestrian deaths in which the light conditions were recorded, but 70 deaths occurred in light conditions that were unknown or not reported.
| < Previous | Table of Contents | Next > |

