U.S. Department of Transportation
Federal Highway Administration
1200 New Jersey Avenue, SE
Washington, DC 20590
202-366-4000
![]()
U.S. Department of Transportation
Federal Highway Administration
View the PDF Version [714 KB]
In this issue:
Spotlight on Proven Countermeasures: Medians and Pedestrian Crossing Islands
Median Case Study: Bridgeport Way, Washington
Pedestrians and Bicyclists to be Included in New Traffic Monitoring Guide
Human Factors Assessment of Pedestrian Midblock Behavior
New Tools and Resources to Improve Walkability and Livability.
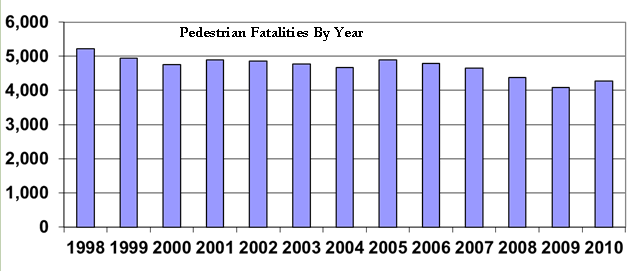
For the first time in five years, pedestrian fatalities and injuries increased while total roadway fatalities reached their lowest levels since 1949. Pedestrian fatalities increased 4.2% (going from 4109 to 4280) and pedestrian injuries increased a whopping 19% (going from 59,000 to 70,000). Despite this setback, FHWA remains committed to decreasing pedestrian fatalities and injuries by concentrating resources on the states and cities (Pedestrian Safety Focus States and Cities) with the biggest pedestrian safety problems and by focusing on promoting the countermeasures that are likely to make a difference where appropriately considered and implemented.
As discussed in the previous edition of this newsletter, FHWA has had measurable success with the focused approach, and hopes to continue that momentum by providing free technical assistance and training—this success was recently highlighted in Public Roads Magazine. Going forward, FHWA will also be more aggressive in gaining a commitment to pedestrian safety among stakeholders and in measuring progress through the establishment of a baseline assessment. Past efforts have led to the development and implementation of several pedestrian safety action plans, some of which are highlighted here.
FHWA will be working with each agency to develop a baseline assessment report using local crash data, pedestrian plans, policies, and other initiatives. A Peer Exchange will be held in Miami, Florida on August 1-2 to discuss common pedestrian safety issues and trends, and share information about best practices and model programs. These efforts will set the stage for each agency to begin developing and implementing its own pedestrian safety action plan.
As mentioned in the Winter 2012 edition of this newsletter, FHWA is promoting the use of 9 countermeasures, including three specifically for pedestrians: medians, Pedestrian Hybrid Beacons (PHB), and "Road Diets." PHB was covered in a webinar in November, medians will be covered in a webinar on May 30, and "Road Diets" will be covered in August (date TBD). To receive information on future webinars, please use the e-subscription service provided here. Scroll down to "Pedestrian and Bicycle Safety" and select "subscribe" next to "Pedestrian Webinar." See page 2 of this newsletter for more details on medians, as well as a case study showing their effectiveness. "Road diets" will be featured in the next edition.
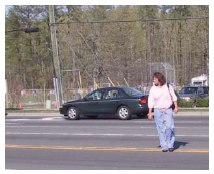 |
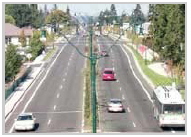
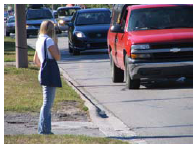
| A woman attempts to cross the street midblock without the benefit of a median. Crashes that result from this type of behavior can be preventable with the installation of medians, such as the one below. |
 |
There's a signal up the block, but looking left—there's a gap in traffic. Looking right—there should be enough time to make it all the way. Midway across, she picks up the pace as some vehicles have changed lanes and are closer than she thought—now traffic is coming towards her from both directions.
She is stuck in the middle of the road, keeping her feet on the yellow lines while waiting for traffic to pass so she can make it across the rest of the way. That's when it happens...a truck passing by clips her while she stands in the middle of the road. The resulting crash is all too common. It was also preventable by providing a median or pedestrian refuge area.
The Federal Highway Administration (FHWA) strongly encourages the use of raised medians (or refuge areas) in curbed sections of multi-lane roadways in urban and suburban areas, particularly in areas where there are mixtures of a significant number of pedestrians, high volumes of traffic (more than 12,000 vehicles per day) and intermediate or high travel speeds.
FHWA guidance further states that medians/refuge islands should be at least 4 feet wide (preferably 8 feet wide for accommodation of pedestrian comfort and safety) and of adequate length to allow the anticipated number of pedestrians to stand and wait for gaps in traffic before crossing the second half of the street Three examples of agencies that have implemented policies and plans promoting the inclusion of median islands for pedestrians are Florida Department of Transportation (FDOT). New York State Department of Transportation (NYSDOT), and the Oregon Department of Transportation (ODOT). Florida has a policy that requires the use of median islands on all divided highways with the stated purpose of improving pedestrian safety. New York and Oregon's design documents promote, but do not require, the installation of medians for pedestrians.
Click here and look under "Resources" for brochures and booklets supporting the use of medians and discussion on the state policies mentioned above.
 |
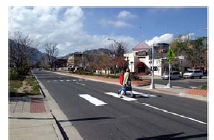
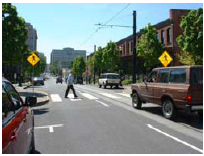
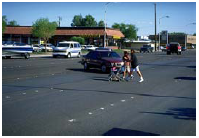
| Bridgeport Way Before Reconstruction (above) and after (below). |
 |
Background: In the summer of 1996, the City of University Place decided to design and construct safety improvements along a portion of Bridgeport Way, a major arterial roadway running through the heart of the city. Bridgeport Way provides access to City Hall, a library, senior housing, a medical facility, and multiple retail centers. Bridgeport Way carries the largest daily traffic volumes in the city, ranging from 18,800 vehicles per day at the south end of the city to 24,100 vehicles per day near the city center. This 1.6 km (1 mi) stretch of Bridgeport Way was the site of 301 accidents resulting in one fatality and 91 injuries between 1995 and 1998. Ten crashes involved pedestrians.
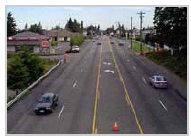
Solution: With a desire to pursue the goals outlined in the City's adopted Vision Statement, the City of University Place saw an opportunity to rebuild and transform Bridgeport Way into an inviting main street that would allow pedestrians and bicyclists to move about comfortably and safely while still accommodating vehicular movement through the corridor. Among other features, the proposed roadway design included replacement of the existing two-way-left-turn-lane with a raised, landscaped median, which would prevent left turns out of driveways.
Results: The City analyzed speed, accident, and economic development data collected before and after the construction of the Bridgeport Way improvements between 35th and 40th Streets. The project's traffic calming features reduced speeds and crashes while increasing business activity. Average speed decreased by 13 percent and traffic crashes were reduced by 60 percent (see table below). This is an excerpt of a Case Study contained in Pedsafe: Pedestrian Safety Guide and Countermeassure Selection System currently being revised by the FHWA. Read the full case study here.
This is an excerpt of a Case Study contained in Pedsafe: Pedestrian Safety Guide and Countermeasure Selection System currently being revised by the FHWA. Read the full case study here.
| Safety Measures | Before | After | Change |
|---|---|---|---|
| Posted Speed Limit | 6 km/h (35 mi/h) | 56 km/h (35 mi/h) | Same |
| Average Actual Speed | 1 km/h (37.6 mi/h) | 52 km/h (32.6 mi/h) | –13 % |
| Average Annual Crashes | 19 | 8 (first year) | –60 % |
To ensure that bicyclists and pedestrians have access to complete streets and pathways that are safe and convenient, transportation agencies need to know what type of users are utilizing their roadways and where these users would like to bicycle and walk. Traditionally, it has been hard to find a comprehensive document outlining reliable methods of counting pedestrians and bicyclists – until now.
FHWA is working at including a Pedestrian and Bicycle Chapter in the new Traffic Monitoring Guide to be released late this year. Included in this new version will be formats for station identification and volume counting for both pedestrian and bicycle point based counts. This is a major step forward and FHWA anticipates a lot of interest in this as it progresses. For more information contact the Program Manager, David Jones, at djones@dot.gov, or by calling 202-366-5053.
Additionally, there are a number of bicycle and pedestrian data sessions at the 2012 North American Travel Monitoring Exposition and Conference (NATMEC): Improving Traffic Data Collection Analysis and Use that will be held in Dallas, Texas on June 4-7th. There is also a 2 hour Transportation Research Board, Pedestrian and Bicycle Sub-Committee meeting at 11:30 am on June 6th at NATMEC.
The conference is designed to advance the state of the practice of travel monitoring by providing a mechanism for improving the interaction between system operators, data collection program managers, and the various staff that collect, process, and utilize that data.
The program is available online, with the main pedestrian and bicycle sessions on June 6. It was organized this way so if someone wants to make the most of their time and come for only the one day it would be convenient for them.
 |
 |
The Office of Safety R& Human Factors Team is currently performing an in-house study examining pedestrian crossing behavior and patterns at non-intersection locations (i.e., unmarked midblock) in comparison to proximate intersection crossings. The goal of this project is to gain a better understanding of the environmental characteristics such as streetscape, roadway features, and vehicle and pedestrian traffic patterns that afford various crossing behavior as recorded through anecdotal observations (i.e., absence of experimental manipulation).
Physical and behavioral observations include intersection or non-intersection locations, curb-to-curb width, travel/turn lanes, signal timing of "Walk" and "Don't Walk" phases, median types/width, on-street parking/standing restrictions, pedestrians that cross with or against traffic/signal, crossing between parked vehicles, yielding right-of-way by motorists and pedestrians, and evasive actions (among others).
Following initial on-site observations, 16 locations across the District of Columbia were chosen to have video recorded during peak traffic times of the day. The video was recorded via access to video feed from pole-mounted traffic cameras under the control of the District Department of Transportation (DDOT). Each video feed provides a vantage point that includes one intersection crosswalk and all non-intersection crossings occurring upstream. Video during morning, mid-day, and evening intervals from each location are currently being analyzed in reference to the above variables. It is intended that the results will provide a better understanding of pedestrian crossing behavior occurring at non-intersection locations when provided marked intersection crossings as an alternative.
Contact: Ann Do or Jim Shurbutt, at Ann.do@dot.gov or jim.shurbutt@dot.gov.
(Contributed by PBIC)
The Pedestrian and Bicycle Information Center (PBIC) has announced three new Walk Friendly Communities (WFC) across the nation and one that elevated its status. The "Walk Friendly" title means a city or town is being recognized for its success in working to improve a wide range of conditions related to walking, including safety, mobility, access, and comfort. PBIC recognizes these four communities for their commitment to improving walkability and pedestrian safety:
Gold Level
Bronze Level
"Not only did we add three new communities, we also saw a community reapply and achieve a higher level designation," said Carl Sundstrom, WFC program manager. "We are excited to add these communities to the showcase of how communities across the nation are improving pedestrian safety and walkability."
There are now 24 Walk Friendly Communities across the nation, and this is the first time any community has moved up to a higher level. To date, Seattle, Washington, is the only Platinum-level Walk Friendly Community. The program will begin accepting applications for the next round on May 1, 2012, with the deadline for submission on June 15, 2012. Interested communities are encouraged to visit www.walkfriendly.org to learn more about the program and review the community assessment tool.
FHWA posted Livability Fact Sheets on its Livability Web site. The fact sheets provide information and examples about how considering livability during the transportation decisionmaking process can benefit communities. The fact sheet topics include health, housing costs, freight, land use, safety, management and operations, rural communities, and the environment.
The Alliance for Biking & Walking ranked the 50 US. States and the 51 largest U.S. cities on bicycling and walking levels, safety, funding, and other factors in its report, Bicycling and Walking in the United States: 2012 Benchmarking Report. While 12 percent of trips in the U.S. are by bike or foot, 14 percent of traffic fatalities are bicyclists and pedestrians.
 |
|
|
Tamara Redmon, Pedestrian Safety Program Manager This Pedestrian Forum is available on the Web at http://safety.fhwa.dot.gov/ped_bike/pedforum/ To receive information on future newsletters, please use the e-subscription service provided on this site: http://safety.fhwa.dot.gov/esubscribe.cfm#ped. Scroll down to "Pedestrian and Bicycle Safety" and select "subscribe" next to "Pedestrian Forum." |
Livable communities are a high priority of the U.S. Department of Transportation and the Obama Administration. A livable community is one that provides safe and convenient transportation choices to all citizens, whether it's by walking, bicycling, transit, or driving. Each year, unfortunately, pedestrian fatalities compose about 12 percent of all traffic fatalities, and there are approximately 4,000 pedestrian deaths. Another 70,000 pedestrians are injured in roadway crashes annually. The numbers are improving, but we still have a ways to go. Pedestrian safety improvements depend on an integrated approach that involves the four E's: Engineering, Enforcement, Education, and Emergency Services. The Pedestrian Forum highlights recent pedestrian safety activities related to the four E's that will help save lives. |

