U.S. Department of Transportation
Federal Highway Administration
1200 New Jersey Avenue, SE
Washington, DC 20590
202-366-4000
| < Previous | Table of Content | Next > |
This is an intersection of a six lane minor arterial (Maryland Parkway) with a speed limit 30 mph, and a two land local street (Sierra Vista Drive) with speed limit of 25 mph. At this location, the principle comments relate to the need to connect crosswalks to sidewalk ramps. Initially, these crosswalks are not connected to the ramps at the crossings and end up at the pork chop island. This location has a mixed land use of residential and shopping. Figure 3 presents the aerial photograph of this site. Site 1 in Appendix B presents implementation plan and the conceptual design of this location. Figure 3 shows an aerial photograph of the site with pedestrian crashes super imposed on it for site 1. This figure shows that the pedestrian crashes are distributed along Maryland Parkway.
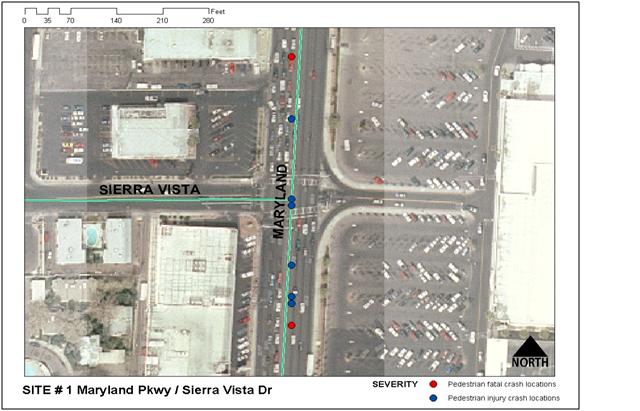
Figure 3: Aerial Photograph of Maryland Parkway and Sierra Vista Drive
A field observation is conducted to identify problems associated with pedestrian safety at this site. Field observation and crash analysis recognize several contributing factors associated with pedestrian safety at this site. The major problems identified for this site are: pedestrians not using the crosswalks, inconspicuous crosswalks, pedestrians trapped in the middle of street, high percent of elderly pedestrian involved in crashes, and inconspicuous pedestrian signals due to wide streets.
A “High visibility crosswalk” treatment was proposed at this location in Stage 1 countermeasure deployment, to help reduce the problem of inconspicuous crosswalks at the location. Stage 1 countermeasure deployment also included relocating the existing pedestrian sign; and install Reflective Pavement Marking (RPM) standard line 100 feet long at the upstream crosswalk. Enlarged Pedestrian Signal Heads are also proposed as Stage 2 countermeasure deployment. The implementation plan for the proposed countermeasures at this location is shown in Table 6.
| Treatments | Stage 1 | Stage 2 | Stage 3 |
|---|---|---|---|
| Relocate existing pedestrian sign | O | O | O |
| Install RPM standard line 100 feet long at the upstream crosswalk | O | O | O |
| Redesign of East approach to permit only right turns | O | O | O |
| High visibility crosswalk | O | O | O |
| High visibility crosswalk from island to sidewalk | O | O | O |
| Enlarged Pedestrian Signal Heads | X | O |
O – Installed
X – Cannot be installed due to non-availability
As indicated before, various countermeasures at each of the sites are deployed in different stages. The descriptions of these deployments are explained as follows:
Stage 1 Countermeasure Deployment
Countermeasures deployed during this stage are “high visibility crosswalk treatment, relocating existing pedestrian sign; and install RPM standard line 100 feet long at the upstream crosswalk.” These countermeasures were installed on October 4-7, 2006. The after condition data for Stage 1 countermeasure deployment was collected on October 31, 2006. Figure 4 and Figure 5 shows the countermeasures deployed at this location.
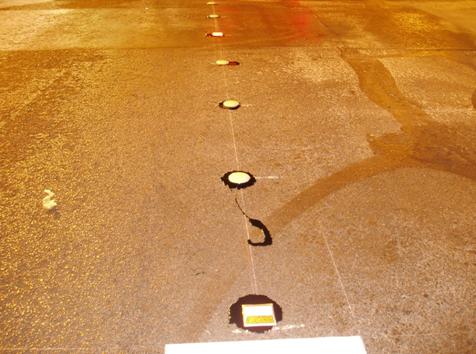
Figure 4. Reflective Pavement Marking (RPM) standard line at Site 1
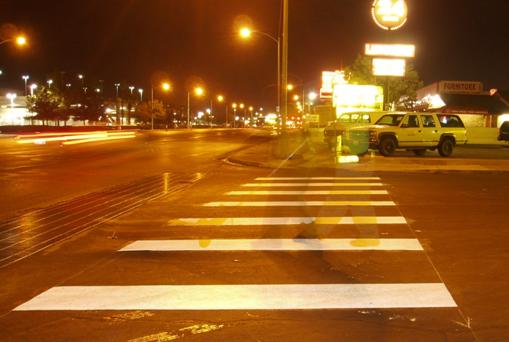
Figure 5: High Visibility Crosswalk Treatment at Site 1
Stage 2 Countermeasure Deployment
Stage 2 countermeasure was stopped due to the non-availability of the vendor to fabricate and manufacture “Enlarged Pedestrians Signal Head” countermeasure.
The results of the safety MOEs are summarized in Tables 7 and 8. Table 7 shows the pedestrian MOEs that are percent of the pedestrians who look for vehicles before beginning to cross, percent signal cycles in which call button has been pushed, frequency of pedestrian signal violation, percent of pedestrians in crosswalk at DON’T WALK, and percent of pedestrians trapped in the roadway. The motorist MOES are summarized in Table 8. These motorist MOEs are percent of drivers yielding to pedestrians, yielding distance, drivers blocking the crosswalk, and drivers making a complete stop.
1.5.1 Pedestrian MOEs
Table 7 summarizes the data collected for pedestrian MOEs at Maryland Parkway and Sierra Vista Drive. It is seen that the “percent of the pedestrians who look for vehicles before beginning to cross” and “percent of pedestrians trapped in the roadway” remained the same (62% and 92% respectively) even after the installation of the high visibility crosswalk treatment countermeasure. There is a decrease (from 85% in Baseline to 65% in Stage 1) in the percent of signal cycles in which call button has been pushed after the installation of the high visibility crosswalk treatment. However, frequency of pedestrian signal violation was decreased to almost half (from 13% in Baseline to 7.3% in Stage 1) after the installation of the countermeasure. The “percent of pedestrians in crosswalk at DON’T WALK was decreased to zero after the installation when compared to 40% during the baseline conditions.
| Measures of Effectiveness (Safety) | Baseline | Stage 1 | ||||
|---|---|---|---|---|---|---|
| Sample | NB | Percent | Sample | N1 | Percent | |
| Percent pedestrians who look for vehicles before beginning to cross | 198 | 122 | 62 | 461 | 285 | 62 |
| Percent signal cycles in which call button has been pushed | 169 | 144 | 85 | 461 | 302 | 65 |
| Frequency of pedestrian signal violation | 303 | 40 | 13 | 461 | 34 | 7.3 |
| Percent of pedestrians in crosswalk at DON’T WALK | 8 | 3 | 38 | 461 | 0 | 0 |
| Percent of pedestrians trapped in the roadway | 217 | 2 | 0.92 | 461 | 4 | 0.93 |
1.5.2 Motorist MOEs
Table 8 summarizes the data collected for motorist MOEs. The collected data for site 1 include percent of drivers yielding to pedestrians, yielding distance, percent of drivers blocking crosswalk, and percent of drivers making a complete stop. It is evident from Table 8, that the motorists are not influenced by the installation of the high visibility crosswalk treatment. All the MOEs collected before and after installation of the high visibility crosswalk treatment show negative impact.
| Measures of Effectiveness (Safety) |
Baseline | Stage 1 | |||||
|---|---|---|---|---|---|---|---|
| Sample | NB | Percent | Sample | N1 | Percent | ||
| Percent of drivers yielding to pedestrians | 30 | 19 | 63 | 158 | 60 | 38 | |
| Distance driver stops/yields before crosswalk | < 5 ft | 16 | 14 | 88 | 60 | 37 | 62 |
| 5-10 ft | 16 | 2 | 12 | 60 | 22 | 37 | |
| >10 ft | 16 | 0 | 0 | 60 | 1 | 1 | |
| Percent of drivers blocking crosswalk | 89 | 1 | 1 | 158 | 96 | 61 | |
| Percent of drivers making a complete stop | 89 | 84 | 94 | 158 | 98 | 62 | |
Table 9 summarizes mobility MOEs for site 1. The major MOEs collected are pedestrian delay and vehicle delays. From Table 9, it is seen that average pedestrian delay decreases from 60 seconds to 45 seconds per pedestrian after the installation of the high visibility crosswalk treatment. However, on the contrary, average vehicle delay increases from 7.5 seconds to 21.8 seconds after the stage 1 countermeasure installation.
| Measures of Effectiveness (Mobility) | Baseline | Stage 1 | ||
|---|---|---|---|---|
| Sample | Delay | Sample | Delay | |
| Average pedestrian delay (sec/ped) | 303 | 60.09 | 461 | 45.26 |
| Average vehicle delay (sec/veh) | 1954 | 7.48 | 1868 | 21.81 |
Results from previous tables show that there are notable changes in MOEs associated with installation of countermeasures. Although these results could be used to interpret the effectiveness of these countermeasures, it is important to perform statistical tests to validate the results. The results from the statistical test are explained as follows.
1.7.1 Safety MOEs
The statistical results of the safety MOEs for Maryland Parkway and Sierra Vista Drive are shown in Table 10. As discussed earlier in the analysis, even though there was a decrease in the “percent signal cycles in which call button was pushed,” statistically it is not considered significant. Similar is the case with “percent of pedestrians who look for vehicles before beginning to cross” before and after the installation of the high visibility crosswalk treatment. Even though there is a decrease in the “percent of the drivers yielding to pedestrians,” the decrease is not statistically significant. However on the flipside, it can be stated that the change in the “percent of the pedestrian signal violations” and “percent of pedestrians in crosswalk at DON’T WALK” in the before and after scenario, is statistically significant in after conditions when compared to the before conditions.
| Measures of Effectiveness (Safety) |
Baseline vs. Stage | |||
|---|---|---|---|---|
| PB – P1 | P-value | H0 | ||
| MOEs below are tested for H0: Pbefore = Pafter vs. Ha: Pafter > Pbefore | ||||
| Percent pedestrians who look for vehicles before beginning to cross | -0.002 | >0.05 | Do not Reject | |
| Percent signal cycles in which call button has been pushed | 0.19 | >0.05 | Do not Reject | |
| Percent of drivers yielding to pedestrians | 0.25 | >0.05 | Do not Reject | |
| Distance driver stops/yields before crosswalk | <5 ft | 0.25 | <0.05 | Reject |
| 5-10 ft | -0.24 | <0.05 | Reject | |
| >10 ft | -0.016 | >0.05 | Do not Reject | |
| Percent of drivers making a complete stop | 0.32 | >0.05 | Do not Reject | |
| MOEs below are tested for H0: Pbefore = Pafter vs. Ha: Pafter < Pbefore | ||||
| Percent of pedestrians trapped in the roadway | 0.0005 | >0.05 | Do not Reject | |
| Frequency of pedestrian signal violation | 0.058 | <0.05 | Reject | |
| Percent of pedestrians in crosswalk at DON’T WALK | 0.375 | <0.05 | Reject | |
| Percent of drivers blocking crosswalk | -0.59 | >0.05 | Do not Reject | |
The data collected before and after the installation of the High Visibility Crosswalk Treatment at this location indicates that there is a statistically significant improvement observed in the “percent of the pedestrian signal violations” and “percent of pedestrians in crosswalk at DON’T WALK” MOEs. However, the countermeasure deployment didn’t impact the motorist behavior to a notable extent. As per the initial problems identified, it can be stated that the countermeasure addressed the problems of pedestrians not using the crosswalks and inconspicuous crosswalks. The other problems identified at this location such as “high percent of elderly pedestrian involved in crashes,” and “inconspicuous pedestrian signals due to wide streets” would have been addressed by installation of Enlarge Pedestrians Signal Heads. Vendor non-availability hampered the process of installation of this countermeasure.
| < Previous | Table of Content | Next > |

