U.S. Department of Transportation
Federal Highway Administration
1200 New Jersey Avenue, SE
Washington, DC 20590
202-366-4000
| < Previous | Table of Content | Next > |
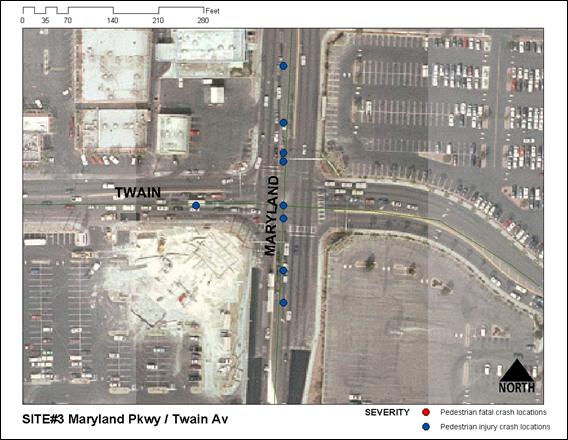
Figure 10: Aerial Photograph of Maryland Parkway / Twain Avenue (Control Site)
A mixed land use pattern is observed around the intersection of Harmon Avenue/Paradise Road. This site is within the jurisdiction of Clark County. The land use includes residential, commercial, and recreational (hotels and casinos). Harmon Avenue spans east-west and is classified as a minor arterial with a posted speed limit of 35 mph. The intersection of Harmon Avenue and Paradise Road has had a total of 12 crashes during the period January 1996 to December 2000. Fifty eight percent of the crashes occurred during daytime. The ADT along this segment of Harmon Avenue for the year 2006 is 17,100. Figure 11 presents the aerial photograph of the site. Implementation plans and conceptual designs of this site are illustrated in Site 4 in Appendix B.
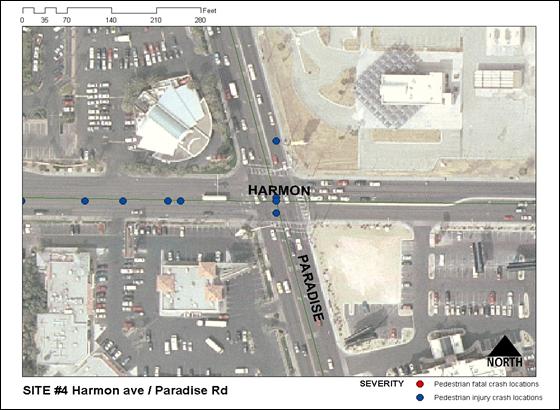
Figure 11: Aerial Photograph of Harmon Avenue and Paradise Road
Analyzing crash data and by performing a field evaluation, the problems identified at this location are pedestrians do NOT wait for signals/acceptable gaps and high pedestrian/right turning
The countermeasures suggested for this location are “turning vehicles yield to pedestrian sign.” Installing this sign would alert the right turning traffic to yield for the pedestrian. As the right turn vehicle volumes are high at this location, Clark County Public Works- Traffic Division requested the study team not to install “No-Turn on Red” since this would hamper the volume of right turn vehicles. Also in addition to the “turning vehicles yield to pedestrian sign” countermeasure, “warning sign for motorists” are also installed at the location to caution the drivers about/or the presence of pedestrians. The implementation plan for the proposed countermeasures at this location is shown in Table 19.
Table 19: Implementation Plan for Harmon Road and Paradise Road
| Treatments | Stage 1 |
|---|---|
| Warning Sign for Motorist | O |
| Turning Vehicles Yield to Pedestrians | O |
O - Installed
Stage 1 Countermeasure Deployment
Countermeasures deployed during this stage are “Warning Signs for Motorists” and “Turning Vehicles Yield to Pedestrians.” These countermeasures are installed between June 13 and 17, 2005. The after condition data for stage 1 countermeasure deployment are collected on July 14, 2005. Figure 7 shows the countermeasure deployed in stage 1 at this location.
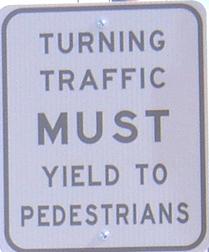
Figure12: Turning Vehicles Yield to Pedestrians Sign
Analysis of collected data shows that the average vehicle delay increases from 66.8 seconds/vehicle before the installation to 75.6 seconds/vehicle after the installation of the sign. The proportion of motorists yielding also increased so that more vehicles in the queue yield for pedestrians. Consequently, the vehicle delay also increases. Pedestrian delay increases from 44 seconds/pedestrian before the installation to 61 seconds/pedestrian after the installation of the sign. The motorists’ yielding is increased after the sign is installed. This could be because of more turning motorists yielded to pedestrians either on red or green phase of the signal. Even though the pedestrians’ arrival is considered as random, some pedestrians might have to wait longer and others might have to wait less. Some pedestrians arrive at the beginning of the WALK signal, (i.e., no waiting time), others arrive during the flashing DON’T WALK phase, and they have to wait for a cycle length typically 120 to 140 seconds. The weighted average of all pedestrians in that range might be a very rough estimate of delay. The field observations show that a vehicle interacts with pedestrians while turning either on red or on green. Motorists’ yielding percentage increased indicating that pedestrians do not have to wait longer for turning traffic. Therefore, pedestrian delay should have been reduced. It is unclear why pedestrian delay has increased after the installation of the sign, “Turning traffic must yield to pedestrians.”
The before-and-after study results show that the installation of the “Turning traffic must yield to pedestrians” sign has increased the proportion of motorists yielding at RTOR from 0.61 to 0.73 percent (P=0.156). Similarly, the proportion of motorists yielding at right turn on green increases from 0.74 to 0.77 (P=0.615) during the after-study period. The installation of the sign, “Turning traffic must yield to pedestrians,” shows an increase in motorists yielding while turning either on red or green even though these differences are not statistically significant at 95 percent confidence level.
Before the installation of the sign, “Turning traffic must yield to pedestrians,” a notable proportion of (0.11) of vehicles blocks the crosswalk before turning; after the sign is installed, the proportion of motorists blocking the crosswalk is reduced to zero (P<0.001). The observed stopping behavior of motorists before RTOR was installed; this proportional value increases to about 0.97 (P<0.001) after the sign is installed. The values of MOEs during before and after study periods, their difference, and statistical significance are shown in Table 20.
The sign, “Turning traffic must yield to pedestrians,” is intended for motorists. However, the before-and-after study result indicates some positive influence on pedestrians’ crossing behavior. The proportion of pedestrians looking for turning vehicles at the beginning of the WALK signal increased from 0.54 to 0.93 (P<0.001) before and after the installation of the sign respectively. As the motorists’ yielding increases, motorists might stop upstream of the crosswalk. Therefore, more pedestrians watch for turning vehicles before crossing. Marginal differences are observed in the proportion of pedestrians who are in the crosswalk during the flashing DON’T WALK phase and during the all red phase before and after the installation of the sign. The proportion values of pedestrians who are in the crosswalk during the flashing DON’T WALK phase and at the all-red time are decreased by small proportion after the installation of the sign.
| S. No. | Measures of Effectiveness | Before | After | (Before- After) |
P-value | Null hypothesis |
||
|---|---|---|---|---|---|---|---|---|
| Sample size |
Value | Sample size |
Value | |||||
| 1 | Motorists' yielding at right turn on red (in the presence of pedestrian at turn or approach), % | 31 | 61.29 | 30 | 73.33 | -12.04 | 0.156 | Do not Reject |
| 2 | Motorists' yielding at right turn on green (in the presence of pedestrians), % | 102 | 73.53 | 90 | 76.67 | -3.14 | 0.615 | Do not reject |
| 3 | Percentage vehicles blocked the crosswalk, % | 129 | 10.85 | 235 | 0.00 | 10.85 | 0.000 | Reject |
| 4 | Percentage of drivers executing right turn on red coming to complete stop, % | 129 | 74.42 | 235 | 97.45 | -23.03 | 0.000 | Reject |
| 5 | Pedestrian delay (sec/ped) | 556 | 44.37 | 355 | 61.09 | -16.73 | 0.000 | Reject |
| 6 | Vehicle delay at intersection (sec/veh) | 1,356 | 66.83 | 1,275 | 75.64 | -8.81 | N/A | N/A |
| 7 | Percentage of pedestrians who looked at start of the WALK phase for turning vehicles, % | 542 | 53.69 | 370 | 93.24 | -39.55 | 0.000 | Reject |
| 8 | Percentage of pedestrians who were in the crosswalk during the flashing DON'T WALK phase | 639 | 45.07 | 390 | 43.33 | 1.74 | 0.586 | Do not reject |
| 9 | Percentageof predstrians who were in the crosswalk at the end of all-red, % | 639 | 2.66 | 390 | 2.05 | 0.61 | 0.525 | Do not Reject |
| 10 | Percentage of pedestrians who were in trapped in the middle of crossing, % | 618 | 5.50 | 373 | 3.75 | 1.75 | 0.194 | Do not Reject |
| 11 | Percentage of pedestrian/vehicle evasive actions, change course/slow to avoid motorists, % | 609 | 0.82 | 349 | 7.74 | -6.92 | 1.000 | Do not Reject |
Note: α = 0.05
The proportion of pedestrians who were trapped in the middle of the road while crossing decreases during the after-study from 0.06 to 0.04 (P=0.194). Pedestrians do not have to wait in the middle of the road if they have an acceptable gap for crossing. The motorists’ yielding behavior while turning improved. Therefore, motorists turning on permitted left-turn also yielded to pedestrians. As a result, the proportion of pedestrians trapped in the middle is reduced after installation of the sign.
The proportions of evasive actions are 0.008 and 0.077 before and after condition data collection period, respectively. The difference of the proportion of evasive action between before and after period is significantly different (P<0.001) at 95 percent confidence level, which is unexpected.
Statistical analysis of the data collected at this location before and after the installation of the “Yield to Pedestrian in Crosswalk” shows benefits that improved overall pedestrian safety at this location. The parameters that are improved after the installation of the countermeasure are reduction in the percent of the vehicles blocking the crosswalk, improvement in percent of drivers coming to complete stop those are turning right turn on red, and decrease of pedestrian delay.
| < Previous | Table of Content | Next > |

