U.S. Department of Transportation
Federal Highway Administration
1200 New Jersey Avenue, SE
Washington, DC 20590
202-366-4000
| < Previous | Table of Content | Next > |
The land use at this location is mainly residential. This site is an intersection of a six lane minor arterial (Lake Mead Boulevard) with two left turning lanes and with a speed limit 45 mph, and a six lane minor arterial (Pecos Road) with speed limit of 45 mph. This site is within the jurisdiction of City of North Las Vegas. There are a total of 9 crashes recorded at this intersection from 1996-2000. All the crashes that occurred at this location were injury crashes. The percentage of the motorist’s failure to yield (67 percent) is double the percentage of the pedestrian’s failure to yield (33 percent). Day time crashes account for 78 percent of the crashes. Figure 39 presents the aerial photograph of the site. Implementation plans and conceptual designs of this site are illustrated in Site 16 in Appendix B.
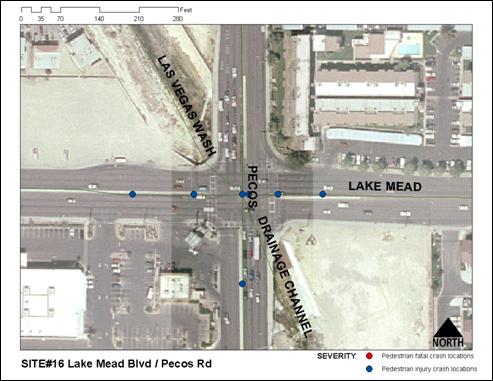
Figure 39: Aerial Photograph of Lake Mead Boulevard and Pecos Road
After analyzing crash data and field observation data, some of the problems identified at this location include: motorist failure to yield, pedestrian failure to yield, pedestrians do NOT wait for signals/acceptable gaps, and high pedestrian/right turning vehicle conflicts.
Countermeasures proposed at this location are “turning vehicles yield for pedestrian sign” and “warning sign for motorists.” The implementation plan for the proposed countermeasures at this location is shown in Table 65.
| Treatment | Stage 1 |
|---|---|
| Warning sign for motorists | O |
Turning Vehicles Yield to Pedestrians |
O |
O Installed
Stage 1 Countermeasure Deployment:
Countermeasures deployed during this stage are “Warning Signs for Motorists” and “Turning Vehicles Yield to Pedestrians.” These countermeasures were installed between May 16 and 20, 2005. The after condition data for Stage 1 countermeasure deployment was collected from June 6 to 10, 2005. Figure 40 shows the countermeasure deployed in Stage 1 at this location.
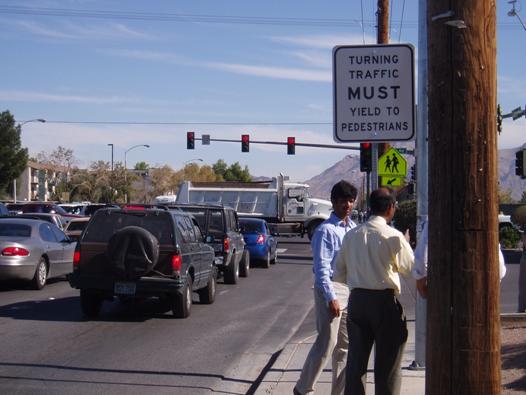
Figure 40: “Turning Traffic Must Yield to Pedestrian” signs installed at Lake Mead Boulevard and Pecos Road
The average vehicle delay increased marginally from 25.4 seconds/vehicle to 26.1 seconds/vehicle, before and after the installation of the sign, respectively. Similar trends were observed both morning and evening peak hours during both of the study periods. The percentage of motorists yielding also increases so that more vehicles yielded to pedestrians. Consequently, the vehicle delay also increases. Pedestrian delay increased from 42 seconds/pedestrian to 45 seconds/pedestrian before and after the installation of the sign respectively.
The before-and-after study results show that the installation of the “Turning traffic must yield to pedestrians” sign has increased the proportion of motorists yielding at RTOR from 0.51 to 0.92 (P<0.001). On the contrary, the proportion of motorists yielding at right turn on green decreased marginally from 0.82 to 0.80 (P=0.566) during the after-study period. However, this difference is not statistically different at the 95 percent confidence level. The installation of the sign “Turning traffic must yield to pedestrians” shows an increase in motorists yielding while turning on red. The values of MOEs during before and after study periods, their difference and statistical significance are shown in Table 66.
Before the installation of the sign, “Turning traffic must yield to pedestrians,” proportion of vehicles which block the crosswalk while turning increases from 0.39 before installation to 0.82 after installation (P<0.001). The observed stopping behavior of motorists before RTOR indicates that the proportion of motorists completely stopped before the sign is installed decreases from 0.75 before to 0.58 (P<0.001) after the sign is installed.
The proportion of pedestrians looking for turning vehicles at the beginning of the WALK signal decreases from 0.88 to 0.58 (P<0.001) before and after the installation of the sign respectively. The proportion of pedestrians who are stuck in the crosswalk during the flashing DON’T WALK phase and at the end of all red time decreased from 0.62 to 0.21 (P<0.001) and 0.031 to 0.027 (P=0.393) respectively during after study period.
| S. No. | Measures of Effectiveness | Before | After | (Before- After) |
P-value | Null hypothesis |
||
|---|---|---|---|---|---|---|---|---|
| Sample size |
Value | Sample size |
Value | |||||
| 1 | Motorists' yielding at right turn on red (in the presence of pedestrian at turn or approach), % | 76 | 51.32 | 55 | 90.91 | -39.59 | <0.001 | Reject |
| 2 | Motorists' yielding at right turn on green (in the presence of pedestrians), % | 73 | 81.94 | 64 | 79.69 | 2.26 | 0.566 | Do not reject |
| 3 | Percentage vehicles blocked the crosswalk, % | 267 | 39.33 | 198 | 82.32 | -43.00 | 1.000 | Do not reject |
| 4 | Percentage of drivers executing right turn on red coming to complete stop, % | 268 | 75.37 | 200 | 58.00 | 17.37 | 1.000 | Do not reject |
| 5 | Pedestrian delay (sec/ped) | 362 | 42.08 | 388 | 45.31 | -3.23 | 0.914 | Do not reject |
| 6 | Vehicle delay at intersection (sec/veh) AM PM Total |
812 1,642 2,454 |
18.60 28.77 25.40 |
1,243 1,384 2,627 |
19.82 31.78 26.12 |
N/A N/A N/A |
N/A N/A N/A |
|
| 7 | Percentage of pedestrians who looked at start of the WALK phase for turning vehicles, % | 331 | 87.61 | 412 | 58.25 | 29.36 | 1.000 | Do not reject |
| 8 | Percentage of pedestrians who were in the crosswalk during the flashing DON'T WALK phase | 354 | 61.86 | 432 | 20.60 | 41.26 | <0.001 | Reject |
| 9 | Percentageof predstrians who were in the crosswalk at the end of all-red, % | 354 | 3.11 | 432 | 2.78 | 0.33 | 0.393 | Do not reject |
| 10 | Percentage of pedestrians who were in trapped in the middle of crossing, % | 338 | 5.33 | 432 | 2.78 | 2.55 | 0.040 | Reject |
| 11 | Percentage of pedestrian/vehicle evasive actions, change course/slow to avoid motorists, % | 345 | 1.74 | 432 | 0.23 | 1.51 | 0.021 | Reject |
| 12 | Vehicle speed (mph) Eastbound Westbound Northbound Southbound |
75 50 50 50 |
33.68 40.53 37.72 35.94 |
99 75 60 60 |
36.14 29.66 26.96 31.16 |
-2.46 10.87 10.75 4.78 |
0.963 <0.001 <0.001 <0.001 |
Do not reject Reject Reject Reject |
Note: α = 0.05
The proportion of pedestrians trapped in the middle of the road while crossing decreases significantly during the after-condition from 0.05 to 0.03 (P=0.040). The motorists’ yielding behavior while turning also shows an improvement. As a result, the percentage of pedestrians trapped in the middle decreases after installation of the sign.
The proportion of evasive actions decreases from 0.017 to 0.002 for the before and after study periods respectively. The difference of the proportion of evasive action between before and after period is significantly different (P=0.021) at the 95 percent confidence level. The average vehicle speeds decreases (P<0.001) significantly during the after study period in the northbound, southbound, and westbound directions. On the other hand, the average vehicle speeds shows an increase in the eastbound direction.
Statistical analysis of the data collected at this location before and after the installation of the “Yield to Pedestrian in Crosswalk” shows significant benefits that improved overall pedestrian safety at this location. The parameters that were improved after the installation of the countermeasure include, increase in the number of vehicles yielding to pedestrians in crosswalk, reduction in the percent of the vehicles blocking the crosswalk, and decrease of pedestrian delay.
| < Previous | Table of Content | Next > |

