U.S. Department of Transportation
Federal Highway Administration
1200 New Jersey Avenue, SE
Washington, DC 20590
202-366-4000
| < Previous | Table of Content | Next > |
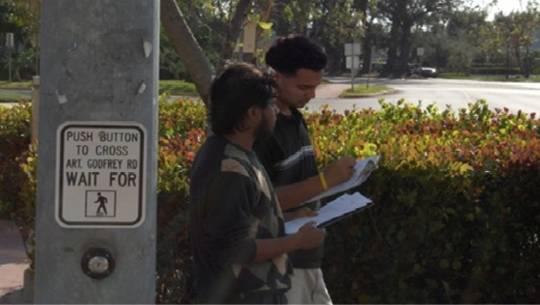
Figure 4.1 Picture of Data Collectors
This chapter summarizes data collected for each countermeasure. Data were only collected at sample locations if a large number of a particular countermeasure was installed. When data were collected at multiple sites, care was taken to ensure that multiple treatments were not introduced at the same time. When new information was learned about a specific countermeasure, the study was submitted for publication. References are provided if the results of the study were published in a peer-reviewed journal.
Although treatments were introduced along corridors, we decided to categorize treatments results by treatment rather than corridor because treatments were frequently implemented across corridors to better control for generalization across sites. For example, one installation of push buttons that confirmed the press would be installed in one corridor while another installation of push buttons that confirmed the press would be installed in a second corridor. This would require presenting the study twice or presenting half the data in the report for one zone’s report and presenting the other half of the data in the report on the second zone’s report. Instead we thought it best to keep the sites together for each experiment sorted by the type of application.We also felt that crash data should parallel the zone headings because the focus of the collective treatments in each corridor was to reduce crashes in that corridor and because all countermeasures in each corridor work together to reduce crashes in that corridor. Therefore, we have treated crash data by corridor in the next section of this chapter.
Many pedestrian crashes involve pedestrians crossing during the "DON'T WALK" pedestrian signal. The purpose of this study was to evaluate the effects of push buttons that provide visual and audible feedback when pressed on: 1.) The proportion of cycles that a pedestrian pressed the call button; and 2.) the proportion of pedestrians pressing the call button that waited for the "WALK" sign. Data were collected at two busy intersections in Miami Beach with relatively high daily traffic flows. The installation of push buttons that provided visual and audible feedback when pressed was associated with a statistically significant increase in the percentage of cycles that pedestrians pressed the button, as well as a significant increase in the percentage of pedestrians pressing the button that waited for the "WALK" sign before crossing. Because behavior only changed when the new push buttons were installed and the push buttons were installed at a different point in time at each site, it was possible to rule out potential confounding variables such as weather, traffic flow and changes in the demographic characteristics of the pedestrian. The percentage of pedestrians crossing against the signal also decreased at both locations after the new push buttons were installed as did the percentage of pedestrians trapped in the middle of the road when crossing. Because push buttons that emit a visible and audible cue when they are pressed are relatively inexpensive, this treatment is a relatively cost effective way to increase the percentage of pedestrians who press the button and wait for the ‘Walk” sign before crossing. Accessible push buttons also acknowledge when they have been pressed. These data show that accessible buttons may benefit all pedestrians. The results of this intervention are summarized in Table 4.1. (These results were published in Transportation Research Record No. 1982 (Van Houten, Ellis, Sanda and Kim, 2006).
| 41st & Pine Tree Dr. | Baseline | Treatment | Z score | p-value |
|---|---|---|---|---|
| Number of Cycles When a Pedestrian was present who could press the button | 420 | 570 | ||
| % of cycles button pressed | 33.8 | 58.1 | 7.673 | 0.01 |
| % pedestrian that pressed button waited for WALK | 51.2 | 72.5 | 4.91 | 0.01 |
| % cycles pedestrian trapped | 3.8 | 3.1 | 0.56 | NS |
| % cycles ped vehicle conflicts | Very rare event | |||
| Total of Pedestrians Crossing (includes those not pressing button | 879 | 1044 | ||
| % of all pedestrian violating signal | 70.4 | 52.6 | 8.17 | 0.01 |
| Alton & 16th St. | Baseline | Treatment | Z score | p-value |
|---|---|---|---|---|
| Number of Cycles When a Pedestrian was present who could press the button | 600 | 810 | ||
| % of cycles button pressed | 41.83 | 54.2 | 4.633 | 0.01 |
| % pedestrian that pressed button waited for WALK | 82.9 | 85.93 | 1.937 | 0.05 |
| % cycles pedestrian trapped | 4.7 | 2.4 | 2.293 | 0.025 |
| % cycles ped vehicle conflicts | Very rare event | |||
| Total of Pedestrians Crossing (includes those not pressing button | 1577 | 2490 | ||
| % of all pedestrian violating signal | 59.7 | 51.7 | 5.086 | 0.01 |
Pedestrians often do not wait for the "WALK" sign at signal-controlled mid-block crossings. Many factors may contribute to this phenomenon, but one variable could be wait time. It is likely that the major reason people try to cross against the signal at mid-block signal-controlled crosswalks, when there are gaps in traffic in the first half of the roadway, is the length of the average wait time for the WALK sign. It is common to have minimum green times of a minute or more on a main line at a signal-controlled mid-block crosswalk. If a pedestrian arrives early in the cycle they may become frustrated and attempt to cross a street in the presence of fast heavy traffic. The purpose of this study was to determine the effect of wait time on pedestrian signal compliance at two mid-block crosswalks in Miami-Dade County. One crosswalk traversed an arterial multilane road with two-way traffic and the second crosswalk traversed a multilane road with one-way traffic. At both crosswalks minimum green time was varied between 30 seconds and 120 seconds. The results indicated that pedestrian compliance decreased as minimum green time was increased and that compliance dropped more rapidly as minimum green time was increased at the location with the lower Average Daily Traffic counts (ADT) and one-way traffic. Data also showed that the percent of pedestrians trapped at the centerline increased with increased minimum green time. The results of this intervention are summarized in Table 4.2. These results were published in Transportation Research Record No. 2002 (Van Houten, Ellis and Kim, 2007).
Pedestrians often consistently push the call button for the "WALK" sign at signal-controlled mid-block crossings. Many factors may contribute to this phenomenon, but one variable could be previous experience with long wait times. Another factor could be detection of a gap for the first half of the crosswalk after arrival at the crosswalk. This practice could lead to the pedestrians being trapped in the center of the roadw% pedestrian that pressed button waited for WALKay, and in the absence of a median a trapped pedestrian may select an inadequate gap for the second half of the crossing in their haste to get out of the roadway. If these pedestrians had pressed the call button, the signal may have changed while they were still trapped in the middle of the crossing, thereby affording some protection crossing the final half of the roadway. The purpose of this study was to determine whether video detection increases the percentage of pedestrian protected by the signal while crossing the second half of the crosswalk. The results indicated the treatment had a small but significant positive effect. The results of the Video Pedestrian Detection treatment are provided in Table 4.3.
| Mid Block Alton Rd. | 30 sec | 1 min | 2 min |
|---|---|---|---|
| Number of Cycles When a Pedestrian was present who could press the button | 150 | 600 | 840 |
| 98 | 85 | 64 | |
| Z Score (p) Waited for WALK | 7.78 (.01) | 18.38 (.01) | |
| % cycles ped vehicle conflicts | Very rare event | ||
| % cycles pedestrian trapped | 0 | 19 | 23 |
| Z Score (p) Pedestrians Trapped | 11.86 (.01) | 15.84 (.01) | |
| Pedestrian Delay in Z Score (p) for s | 15 | 37 | 47 |
| Z Score (p) for Pedestrian Delay | Z=6.25 (0.01) | Z=12.287 (.01) | |
| N (Vehicle Delay in seconds) | 641 (15) | 2094 (7.525) | 5960 (5.062) |
| Z Score (p) value for Vehicle Delay | 4.91 (0.01) | 6.91 (0.01) | |
| Mid Block 1300 SW 18th St. | 30 sec | 1 min | 2 min |
| Number of Cycles When a Pedestrian was present who could press the button | 270 | 90 | 840 |
| % pedestrian that pressed button waited for WALK | 82% | 65% | 61% |
| Z Score (p) Waited for WALK | 4.49 (.01) | 5.92 (.01) | |
| % cycles ped vehicle conflicts | Very rare event | ||
| % cycles pedestrian trapped | Not relevant (one-way traffic) | ||
| Pedestrian Delay | 13.7 | 18 | 30 |
| Z Score (p) for Pedestrian Delay | Z-0.9333 (.05) | Z-6.2148 (.01) | |
| N (Vehicle Delay in seconds) | Data was not obtained | ||
| Z Score (p) value for Vehicle Delay | Data was not obtained | ||
| MOEs | Before | After | Statistic |
|---|---|---|---|
| Total Number of pedestrians crossing | 752 | 485 | |
| % pedestrians pressing call button | 42.89 | 36.36 | two sample t test p = 0.3554 |
| % pedestrian crossing during WALK | 49.48 | 47.58 | two sample t test p = 0.957 |
| % of times video detector places a false call | 0 | ||
| % of times Video detector fails to a call when ped present | 0 | ||
| % of pedestrians completing crossing entire crosswalk during WALK | 43.8 | 50.5 | z test for proportions 1.625 not sig |
| % of peds crossing 2nd half of crosswalk during WALK | 51.3 | 61.6 | two sample t test. p =0.625 |
| % of peds crossing none of the crosswalk during WALK | 48.7 | 38.4 | two sample t test p = 0.1106 |
| % of cycles with conflicts | 0.94 | 0.25 | ptest P = 0.456 |
| % of cycles where a pedestrian is trapped | 17 | 8 | two sample t test p = .0453 |
| Latency between button press and WALK | not collected | not collected | not collected |
These findings are not significant because of the small sample size
Motorists often fail to yield to pedestrians crossing in marked crosswalks at controlled locations. Several studies, have documented the benefits of providing a short exclusive pedestrian phase at the start of the "WALK" at four-legged intersections. The purpose of this study was to examine the effect of a leading pedestrian signal phase (otherwise known as a lead pedestrian interval) at one four-legged intersection and one three-legged intersection in Miami Beach. The introduction of a brief leading pedestrian phase increased the percentage of drivers of left turning vehicles when a pedestrian was present yielding to the pedestrian starting to cross within four seconds of the start of the "WALK" which replicated previous work; however the study did not detect a change in the percentage drivers turning right yielding when a pedestrian was present. One reason for the absence of an effect for right turning vehicles was the high frequency of motorists making free flow right turns on red in Miami-Dade County. Data also showed that button presses increased following the introduction of the Leading Pedestrian Interval (LPI) condition. It is possible that the increase in button pressing was related to the improvement in the percentage of left turning drivers yielding to pedestrians crossing within four seconds of the start of the "WALK" signal. The results of the Leading Pedestrian Phase Intervention are presented in Table 4.4.
| Alton and Lincoln Rd. | Baseline | Treatment | Z score | p-value |
|---|---|---|---|---|
| Number of left turning vehicles | 46 | 194 | ||
| Number of right turning vehicles | 15 | 45 | ||
| % of left turning drivers yielding during WALK | 40 | 58 | 3.933 | 0.01 |
| % of right turning drivers yielding during WALK | 15 | 15 | NA | NA |
| Number of cycles ped present who could have pressed button | 169 | 431 | ||
| % of cycles someone pushed call button | 69 | 76 | 1.91 | 0.05 |
| % cycles ped vehicle conflicts | Very rare event | |||
| Total number of pedestrians that crossed | 858 | 1121 | ||
| % of pedestrians crossing during first 4 s of WALK | 45.3 | 76.5 | 14.72 | 0.01 |
| % of pedestrians in crosswalk at end of all red | 2.1 | 2.4 | 0.45 | >0.05 |
| Collins & 16th St. | Baseline | Treatment | Z score | p-value |
| Number of left turning vehicles | 59 | 18 | ||
| Number of right turning vehicles | ||||
| % of left turning drivers yielding during WALK | 22 | 31 | 1.952 | 0.05 |
| Number of cycles ped present who could have pressed button | 781 | 185 | ||
| % of cycles someone pushed call button | 36 | 51 | 2.866 | 0.01 |
| % cycles ped vehicle conflicts | Very rare event | |||
| Total number of pedestrians that crossed | 300 | 109 | ||
| % of pedestrians crossing during first 4 s of WALK | 38 | 59 | 3.916 | 0.01 |
Motorists often fail to yield to pedestrians in marked crosswalks at controlled locations. Several studies have documented the benefits of text signs instructing drivers of turning vehicles to yield right-of-way to pedestrians. The purpose of the present study was to compare a symbol sign with the standard text sign currently in the Manual of Uniform Traffic Control Devices (MUTCD. After collecting baseline data on the percentage of drivers yielding right-of-way to pedestrians crossing legally in the crosswalk at two sites with the text sign present, the symbol sign was installed and additional data were collected. In order to control for possible confounding variables the signs were changed at a different point in time at each site. Data revealed a general decreasing trend in the percentage of drivers yielding to pedestrians over the course of the study. The introduction of the symbol sign produced an increase in the percentage of drivers turning right and left that yielded to pedestrians at the second site but did not alter the downward trend in the data. At the first site changing the sign at two of the four legs of the intersection produced no level change and the downward trend continued. One reason why the sign may have been less effective at the first site may be related to the fact that the sign only changed to the symbol sign on two rather than all four legs. These results, presented in Table 4.5, show the importance of monitoring data collection over time and using a staggered introduction of the treatment in order to control for possible confounding variables when studies only compare treatments at a small number of sites.
| Collins Ave & 17th St. | Baseline | Treatment | Z score | p-value |
|---|---|---|---|---|
| Number of crossing with turning veh present | 330 | 570 | ||
| Number of Left Turning Vehicles | 188 | 370 | ||
| % left turning vehicles yielding | 59 | 51 | neg 5.503 | NS |
| Number of Right Turning Vehicles | 217 | 432 | ||
| % right turning vehicles yielding | 71 | 50 | neg 6.573 | NS |
| % crossings with ped vehicle conflicts | 3 | 2 | 0.409 | NS |
| % crossings withpedestrians trapped | 2 | 3 | 0.979 | NS |
| Collins Ave & 17th St. | Baseline | Treatment | Z score | p-value |
|---|---|---|---|---|
| Number of crossing with turning veh present | 690 | 330 | ||
| Number of Left Turning Vehicles | 487 | 207 | ||
| % left turning vehicles yielding | 50 | 77 | 9.018 | 0.01 |
| Number of Right Turning Vehicles | 371 | 132 | ||
| % right turning vehicles yielding | 63 | 79 | 5.451 | 0.01 |
| % crossings with ped vehicle conflicts | No conflicts recorded | |||
| % crossings withpedestrians trapped | 1 | 2 | 1.567 | NS |
Many drivers make right turns on red without stopping and some do so without even slowing more than they would if facing a green signal indication. This study compared the efficacy of a conditional "No Turn on Red When Pedestrians in Crosswalk" sign, the standard metal sign "No Turn on Red" (NTOR) sign and an electronic NTOR that is illuminated when a right turn on red is prohibited. The results of the experiment indicated 34 percent of drivers violated the NTOR prohibition with the conditional sign, and 41 percent violated it with the standard sign. The electronic sign reduced violations to 32 percent and they recovered to previous levels during a short return to the standard sign. Data also indicated that the percentage of violators making a full stop before violating NTOR increased from 29 percent and 31 percent for the conditional and standard NTOR sign during the baseline condition, to 78 percent with the electronic sign and to 65 percent during the short return to the standard NTOR sign condition. The results for violators making rolling stops or no stop at all show that the improvement in compliance was the result of equivalent large reductions in both types of violations. Data also indicated that the standard NTOR sign was associated with a decline in the percentage of violations when pedestrians were in the crosswalk, and that the electronic sign produced further declines in violations of pedestrian right-of-way. The results further documented a reduction of motor vehicle-pedestrian conflicts with the electronic sign but not with the standard NTOR sign. Increasing compliance with the NTOR prohibition associated with the electronic NTOR sign was also associated with an increase in the percentage of drivers blocking the crosswalk and a smaller increase in the percentage of pedestrians that needed to walk around vehicles when the crosswalk was blocked. The results of the Electronic No Right Turn on Red Sign intervention are presented in Table 4.6.
| MOEs | Baseline (conditional static) |
Measure 1 (Static NRTOR) |
Measure 2 (Active NRTOR) |
Measure 3 (Static NRTOR) |
Statistic |
|---|---|---|---|---|---|
| % Violation of NRTOR | 34 | 41 | 32 | 48 | ANOVA p=0.0008 |
| % violations when ped present in the crosswalk | 34 | 11 | 6 | 8 | ANOVA p=0.0001 |
| % violations when ped present at curb | 90 | 94 | 25 | 92 | ANOVA p=0.0001 |
| % driver violators who made full stop | 29 | 31 | 78 | 65 | ANOVA p=0.0001 |
| % driver violators who made rolling stops | 30 | 29 | 9 | 20 | ANOVA p=0.0001 |
| % driver violators who did not stop | 41 | 40 | 13 | 15 | ANOVA p=0.0001 |
| % Conflicts | 1 | 2 | 0.1 | 0 | ANOVA p=0.0001 |
| % drivers who blocked crosswalk | 20.2 | 21.1 | No data collected | No data collected | No data collected |
| % pedestrians that walked veh blocking Xwalk | 6.73 | 4.44 | No data collected | No data collected | No data collected |
| There is no push button on this leg (this is also the leg with the serious right turn on red crashes. | |||||
This study examined whether the installation of pedestrian countdown signals could increase the percentage of pedestrians pressing the pedestrian call button. At one site there was a long delay after the baseline data were collected and before the countdown signals were installed. At the other site push buttons that provided feedback when the button was pressed were installed following the baseline study and then a countdown signal was installed. The installation of the countdown signal was associated with an increase in the percentage of pedestrians that pressed the call button at both sites. The results of the Countdown Pedestrian Signal Study are presented in Table 4.7.
| MOEs | Alton and Lincoln | Alton and 16th | |||||
|---|---|---|---|---|---|---|---|
| Baseline | Countdown | Statistic | Baseline | Button | After | Statistic | |
| Number of crossings | 450 | 450 | 600 | 810 | 300 | ||
| % Cycles the call button was pressed | 35 | 95 | 31.13 (p=0.01) |
40.3 | 62.7 | 79.7 | 19.5, p=0.01) |
| % peds in crosswalk at end of Flashing DON'T WALK | 28 | 9 | 9.21 (p=0.01) |
46.7 | 55 | 20.33 | 6.32 (p=0.01) |
| % Pedestrian violations | 47.62 | 5.77 | 21.94 (p=0.01) |
53.93 | 38.1 | 29.38 | 7.38 (p=0.01) |
| % conflicts | 0.37 | 0.33 | 0.1 | 0.33 | 0 | 0.2 | 8.47 (p=0.01) |
Motorists often fail to yield to pedestrians in marked crosswalks at uncontrolled locations. Several studies, including a recent NCHRP/TCRP study have demonstrated that the use of in-roadway signs can significantly increase the percentage of motorists yielding to pedestrians at uncontrolled marked crosswalks. The 2003 Edition of the MUTCD includes two in-street pedestrian signs that may be installed at uncontrolled locations but does not give precise directions as to where to place the sign in relation to the crosswalk. The purpose of the present FHWA study was to compare the effect of placing these signs at the crosswalk, 20 feet in advance of the crosswalk, 40 feet in advance of the crosswalk, and placing a sign at all three locations on driver yielding behavior. A counterbalanced multi element design was employed in this experiment. This design involves installing the sign at several different locations in advance of the crosswalk to determine if there is an optimum location to place the sign. After collecting baseline data at all three crosswalks on Collins Avenue in Miami Beach, Florida, the research team placed the sign at each of the three distances in advance of the crosswalk at each crosswalk location as well as at all three locations together in randomized blocks of trials to control for order effects. The data showed that the sign produced a marked increase in yielding behavior at all three crosswalks and that installing the signs at the crosswalk line was as effective as or more effective than installing it 20 or 40 feet in advance of the crosswalk. Data also indicated that placing the sign at all three locations at once was no more effective than placing the sign at the crosswalk line. These data suggest that the in-roadway sign are likely effective because the in-roadway placement is particularly salient to drivers. Because vehicles frequently struck the signs on Collins Avenue it is recommended that these signs be placed on median islands wherever possible to extend their useful life. The results of the In-Roadway Yield to Pedestrians Signs are presented in Table 4.8. This study was published in Transportation Research Record No. 2002 (Ellis, Van Houten and Kim, 2007).
| Collins & 6th | ||||||
|---|---|---|---|---|---|---|
| Number of peds | 400 | 440 | 240 | 240 | 240 | |
| % Yielding | 32 | 78 | 75 | 70 | 79 | Significant increase; 0 and 3 signs higher than 40 |
| Z score | 12.93 | 10.18 | 8.65 | 11.52 | ||
| P value | 0.01 | 0.01 | 0.01 | ,01 | ||
| Collins & 9th | ||||||
| Number of peds | 400 | 240 | 240 | 240 | 240 | |
| % Yielding | 21 | 65 | 63 | 54 | 56 | Significant increase |
| Z score | 10.39 | 9.93 | 7.87 | 8.23 | ||
| P value | 0.01 | 0.01 | 0.01 | 0.01 | ||
| Collins & 13th | ||||||
| Number of peds | 1300 | 200 | 400 | 400 | 160 | |
| % Yielding | 34 | 69 | 43 | 43 | 52 | Significant increase; 0 and 3 signs higher than 20 & 40 |
| Z score | 11.2 | 6.26 | 6.26 | 6.03 | ||
| P value | 0.01 | 0.01 | 0.01 | 0.01 | ||
| Driver Pedestrian Conflicts | ||||||
| Collins & 16th | Rare at all three locations and only occurred during baseline conditions | |||||
| Collins & 9th | ||||||
| Collins & 13th | ||||||
| % Pedestrians trapped in roadway | ||||||
| Collins & 6th | 0.05 | 0 | 0 | 0 | 0 | these numbers are too low to test. |
| Collins & 9th | 0 | 0 | 0 | 0.006 | 0 | |
| Collins & 13th | 0.0059 | 0 | 0.01 | 0.003 | 0 | |
Many urban areas associated with nighttime entertainment have a high proportion of pedestrian crashes. In these areas drivers may not attend to pedestrians using crosswalks. One way to address this problem is to erect a W 11-2 sign in conjunction with a supplemental "Next 2 Miles" plaque. This study evaluated the effect of this sign and plaque combination on motorist speed and braking for pedestrians in a high pedestrian area of Collins Avenue in Miami Beach. Vehicle speeds were measured using microwave radar and observers recorded driver braking for pedestrians in the roadway. Speed data showed that drivers slowed to 12 mph when pedestrians were present, before and after the signs were installed. Braking data showed similar results. These data were recorded during daytime hours and it is possible that better results would be obtained at night or if speeds were higher. The results of the Pedestrian Zone Signs are presented in Table 4.9.
| MOEs | Before | After | Statistic |
|---|---|---|---|
| Number of pedestrians | 240 | 270 | |
| Vehicle speed (kph) | 19.5 | 19.7 | p=1.79 |
| % Driver braking | 57 | 63 | p=1.36 |
| % Conflicts | 0 | 0 | N/A |
| % Pedestrians trapped | 0.0042 | 0.0111 | Z = 0.912 (P > 0.05) |
Speed trailers have been documented to be effective at decreasing speeds in work zones by as much as 10 mph (Fontaine, Carlson and Hawkins, 2000) and by four to five mph in a second study (McCoy, Bonneson and Kollbaum, 1995). Studies have also documented that speed trailers are effective in reducing speeds on low-speed urban roadways (Perillo, 1997), but the effects do not persist after the trailer is removed (Perillo, 1997) if there is no enforcement, but may persist if the trailer is associated with speed enforcement (Bloch, 1998). The purpose of this study was to examine whether speed trailers reduced speeds and increased braking when pedestrians were present. Participants were motorists driving on or pedestrians crossing Collins Avenue between 38th and 39th Streets. Although the speed trailer increased braking it failed to reduce speed. Because mean speed was 25 mph, which is below the posted limit, motorists may not have perceived a need to reduce their speed further. These data were recorded during daytime hours because at this time the number of pedestrians was highest although it is possible that better results would be obtained at night or at sites where speeds are higher. The results of the Speed Trailer study are presented in Table 4.10.
| MOEs | Before | After | Statistic |
|---|---|---|---|
| Number of Peds | 344 | 300 | |
| Number of Vehicles | 644 | 549 | |
| Vehicle speed (mph) | 26 | 26 | Z=1.43 |
| % Driver braking | 44 | 53 | Z=2.288 (p=0.05) |
| % Conflicts | 0 | 0 | N/A |
| % Pedestrians trapped | 0 | 0 | N/A |
Motorists often fail to yield to pedestrians in marked multilane crosswalks at uncontrolled locations. Several studies have demonstrated that the use of advance yield markings along with a yield here to pedestrian sign can reduce the threat of multiple threat crashes but only have a small effect on overall driver yielding behavior. Several studies, including a recent NCHRP/TCRP study have demonstrated that the use of the HAWK signal can significantly increase the percentage of motorists yielding to pedestrians at uncontrolled marked crosswalks. This device has high compliance because it includes a red phase and a flashing red phase similar to the signals used at fire stations. Although this signal is highly effective its high cost limits its use to particularly risky crosswalks. A lower cost alternative to the HAWK signal is the use of rectangular LED rapid flash amber beacons with an irregular wig wag flash pattern installed on the pedestrian warning sign. We evaluated the rectangular LED rapid flash beacon at two multilane crosswalks in Miami Beach, Florida under FHWA permission to experiment as part of an FHWA Cooperative Agreement to evaluate ITS treatments to increase yielding behavior. A reversal design was employed in this experiment to demonstrate experimental control at each site. This design involves alternating sessions when the signals were activated with sessions when the device was not activated. The results showed that the rectangular LED rapid flash beacons produced a marked increase in yielding behavior at both crosswalks and that similar data were collected from staged pedestrians and local residents using the crosswalks. Data also indicated that the use of the device produced a reduction in evasive conflicts between drivers and pedestrians at both sites and a reduction in the percentage of pedestrians trapped in the center of the road at the crosswalk without a median island. This paper will appear in a future Transportation Research Record.1
| Analysis of Variance comparing flasher and no flasher conditions on vehicle yielding to staged crossings at N.W. 67th & Main St. | ||||
| Source | SS | df | F | p |
|---|---|---|---|---|
| Between Groups | 30047.58 | 1 | 256.12 | 3.4057E-20* |
| Within Groups | 5279.39 | 45 | ||
| Total | 35326.97 | 46 | ||
| Analysis of Variance comparing flasher and no flasher on vehicle yielding to local resident crossings at N.W. 67th & Main St. | ||||
| Source | SS | df | F | p |
| Between Groups | 29666.11 | 1 | 53.18 | 2.7388E-08* |
| Within Groups | 17849.71 | 32 | ||
| Total | 47515.82 | 33 | ||
| Analysis of Variancecomparing flasher and no flasher conditions on vehicles yielding to staged crossings at S. Bayshore Dr. & Darwin. | ||||
| Source | SS | df | F | p |
| Between Groups | 31518.61 | 1 | 467.9 | 2.51E-23* |
| Within Groups | 2627.11 | 39 | ||
| Total | 34145.72 | 40 | ||
| Analysis of Variancecomparing flasher and no flasher conditions on vehicle yieldingto local residents on S. Bayshore Dr. & Darwin. | ||||
| Source | SS | df | F | p |
| Between Groups | 46885.34 | 1 | 148.85 | 3.6849E-13 |
| Within Groups | 9449.52 | 30 | ||
| Total | 56334.87 | 31 | ||
| Analysis of Variance comparing flasher and no flasher conditions on the percent of evasive conflicts at N.W. 67th & Main St. | ||||
| Source | SS | df | F | p |
| Between Groups | 159.02 | 1 | 6.63 | 0.01329 |
| Within Groups | 1102.96 | 46 | ||
| Total | 1261.98 | 47 | ||
| Analysis of Variance comparing flasher and no flasher conditions on the percent of evasive conflicts t S. Bayshore Dr. & Darwin. | ||||
| Source | SS | df | F | p |
| Between Groups | 105.14 | 1 | 13.85 | 0.0006 |
| Within Groups | 280.75 | 37 | ||
| Total | 385.89 | 38 | ||
| Analysis of Variance comparing flasher and no flasher conditions on pedestrians trapped between in the center of the road. | ||||
| Source | SS | df | F | p |
| Between Groups | 13222.24 | 1 | 82.47 | 1.8382E-11 |
| Within Groups | 6734.10 | 42 | ||
| Total | 19956.34 | 43 | ||
A second experiment evaluated the effects of illuminating the departure area with LED lighting when the rectangular LED rapid flasher beacon was activated at night. This treatment did not produce a further increase in yielding. It is likely that the salience of the LED stutter flash beacons overshadowed the effect of departure pad lighting. The results of the Dynamic Lighting study are presented in Table 4.12.
| Analysis of Variance compariing total vehicle yielding and non-yielding during auxiliary pedestrian light on and off conditions at S. Bayshore Dr. at Darwin | ||||
|---|---|---|---|---|
| Source | SS | df | F | p |
| Between Groups | 113.79 | 3 | 0.43 | 0.7335 |
| Within Groups | 1762.83 | 20 | ||
| Total | 1876.62 | 23 | ||
Studies have consistently found higher crash rates for left turning movements at intersections over right turning movements. The use of a leading protected left turn phase reduces driver workload by eliminating the need to search for a gap in opposing traffic. Pedestrians are held during this condition to further improve safety. However, many pedestrians violate the pedestrian signal crossing during the protected left turn phase and drivers may not search for pedestrians assuming none will be crossing. If a permissive left turn phase follows the protected left turn phase pedestrians may fail to benefit from the introduction of a leading protected left turn phase. However, if permissive left turns are not permitted pedestrians should not encounter conflicts with turning vehicles unless drivers violate the signal. The purpose of this study is to compare pedestrian and vehicle violations and motor-vehicle/pedestrian conflicts during a leading protected/permissive left turn condition vs. a leading protected without permissive left turn condition. Participants were pedestrians crossing the South leg of Pine Tree Drive at the intersection of 41st Street and West bound drivers on 41st. Street turning left onto Pine Tree Drive. Data were collected during daylight hours Monday through Saturday. The results of this study indicated changing from leading protected/permissive left turn phasing; to a leading protective/prohibited left turn phasing decreased motor vehicle/pedestrian conflicts. However, many pedestrians continued to cross when the cross traffic stopped at the start of the protected left turn phase in violation of the DON’T WALK signal even though there was a slight improvement in compliance. The improvement in compliance by pedestrians was more than offset by the high violation rate of drivers early during the prohibited left turn phase. These drivers were waiting in queue and attempted to squeeze through the beginning of the prohibited turn phase. A better way to increase the safety of pedestrians at busy intersections may be to use a lagging protected left turn phase rather than a leading protected phase. A lagging protected left turn phase would give pedestrians priority increasing pedestrian compliance. Furthermore, most pedestrians would clear the intersection before left turning vehicles are released. The results of the Remove Permissive Left Turn Phase study are presented in Table 4.13.
| MOEs | Protected Permitted | Protected Prohibited | Statistic | ||
|---|---|---|---|---|---|
| Veh Protect | Veh Perm | Veh Protect | Veh Proh | ||
| Number of Left Turning Vehicles | 3084 | 1560 | 1373 | 252 | |
| Number of Pedestrians Crossing | 359 | 1807 | 105 | 684 | |
| Number of Conflicts | 32 | 22 | 12 | 4 | |
| % of Conflicts | 7.219 | 2 | t=2.50 p=0.014 |
||
| % pedestrians crossing during WALK | 84 | 86.69 | t=-6.31 p=0.00 |
||
| % Pedestrians crossing during the protected LT phase | 16 | 13.3 | |||
| % vehicles turning left during permissive LT phase | 34 | NA | |||
| % vehicles turning during protected LT phase | 66 | 85 | t=-20.22 p=0.00 |
||
| % turning during prohibited LT phase | 15 | NA | |||
This countermeasure was not evaluated.
This countermeasure was not evaluated.
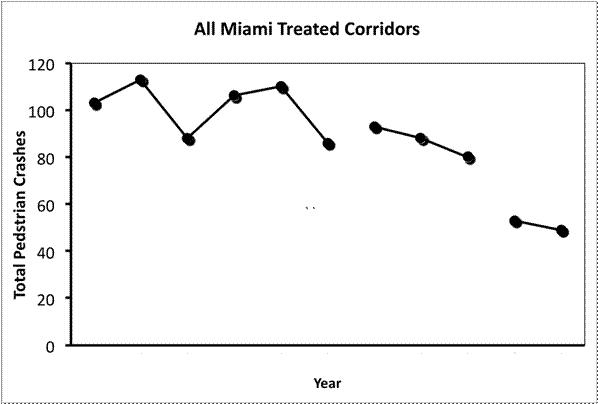
Figure 4.2 Crashes per Year for All Eight Crash Corridors from 1996-2006
Data were collected for each corridor for 6 years prior to the introduction of the NHTSA project, for the 3 years that the NHTSA project was implemented, and for an additional 2 years that the FHWA project was implemented. This provides a total of 11 years of crash data along these high crash corridors. Figure 4.2.1 shows the crash rate for all eight treated corridors remained reasonably stable with a slight downward trend during the 6 years prior to the introduction of the NHTSA project. The introduction of the NHTSA project appeared to lead to a small decrease in pedestrian crashes form a mean of 101 during the baseline period to a mean of 87 (a decrease of 11.5%) during the three years that the NHTSA project was in effect. The installation of the engineering countermeasures on top of the NHTSA education and enforcement efforts lead to a further reduction to an average of 51 crashes per year. This represents a 50% reduction over the baseline level and a 41% reduction from the NHTSA project levels. It is interesting to note that during the 9 years prior to the FHWA project there were 15,472 pedestrian crashes in Miami-Dade County. Of these 46% occurred on State and County Roads for a total of 7,117 crashes or 791 crashes per year. Around 100 per year or nearly 13% of these crashes occurred along the treated corridors.
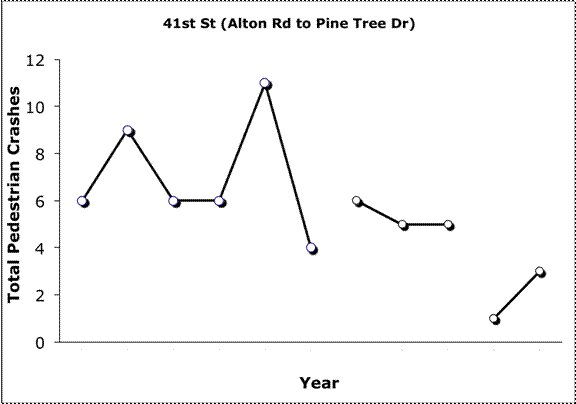
Figure 4.3 Crashes per Year for 41st St. Alton Rd. to Pine Tree Dr. 1996-2006
It is interesting to note that crashes declined in each of the eight crash corridors. Data from each corridor is presented below. One corridor that was not particularly responsive to the NHTSA treatment but very responsive to the FHWA engineering treatments was 41st Street; Alton Road to Pine Tree Drive. This corridor had the highest percentage of daytime pedestrian crashes of all eight corridors (81%). The results for this location are presented in Figure 4.2.2. Crashes averaged 7 per year during baseline, 5.3 per year during the NHTSA program, and 2 per year during the FHWA program. This corridor received a large number of countdown timers, push buttons that confirmed the press, the no right turn on red electronic sign, and the prohibited permissive left turn treatment. Data for this corridor are presented in Figure 4.3.
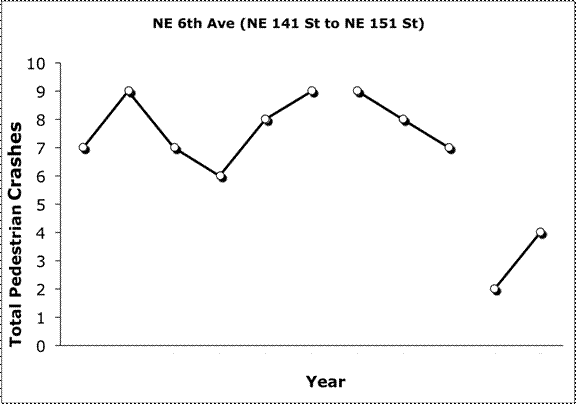
Figure 4.4 Crashes per Year Along NE 6th St. (NE 141st St. to NE 151st St.) from 1996 to 2006
Another corridor that responded well to the engineering treatments was NE 6th St. (NE 141st St. to NE 151st St.). Many of the pedestrians struck in this corridor were children who were hit in crosswalks near the school. This corridor had the highest percentage of crashes involving children and youth (34%) and the highest percentage of crashes involving African American pedestrians (73%). During baseline crashes averaged 7.7 per year at this site and maintained at 8.0 during the three years of the NHTSA project. The FHWA project was associated with at reduction in crashes to 3 per year. This site also received countdown timers and push buttons that confirmed the press at high crash intersections and a large number of pedestrian zone signs. Data from this site are presented in Figure 4.4.
The corridor that showed the largest improvement also had the highest number of crashes per year during baseline, the second highest percentage of African American pedestrians struck during baseline (41%), and the second highest percentage of senior pedestrians struck during baseline (28%). Baseline data show a downward trend during the baseline period. This corridor had the second highest percentage of pedestrian crashes involving turning vehicles (60%). This large corridor along NE 163rd St. had 25.8 crashes per year during baseline, crashes declined to 20.7 crashes per year during the NHTSA project and declined further to 8 per year during the FHWA project. This corridor also received the largest number of countermeasures. This corridor had a large number of countdown pedestrian signals and push buttons that confirmed the press installed. This site also received "Turning Vehicles Yield To Pedestrians" symbol signs, and a large number of offset stop lines. Data for this corridor are presented in Figure 4.5.
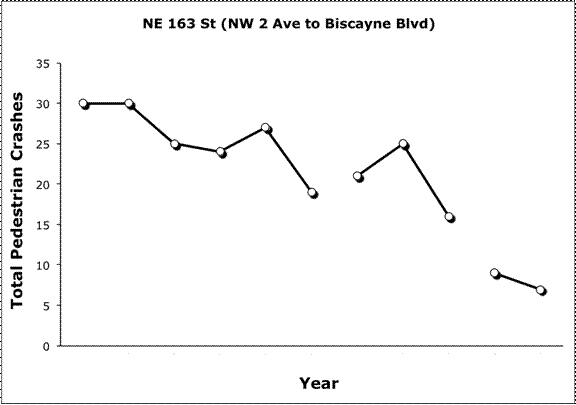
Figure 4.5 Crashes per Year NE 163rd St.(NE 2nd Ave to Biscayne Blvd.) from 1996 to 2006
This corridor on Collins Ave. between 5th St. and 24th St. was in the middle of the South Beach recreational area. Therefore it is not surprising that this corridor had the highest percentage of nighttime crashes of all eight corridors (55%) During baseline there were 18.8 pedestrian crashes per year along this corridor. During the NHTSA project there were 20 crashes per year. The introduction of the FHWA project was associated with a decline in crashes to 13 per year. One of the treatments that was effective along this corridor was the in street pedestrian signs. Unfortunately these signs did not stand the test of time and were only in effect for a relatively short period of time. This corridor also received a couple of lead pedestrian intervals, a large number of "Turning vehicles yield to pedestrians" symbol signs, some pedestrian zone signs, and one advance yield marking. Crash data are presented in Figure 4.6.
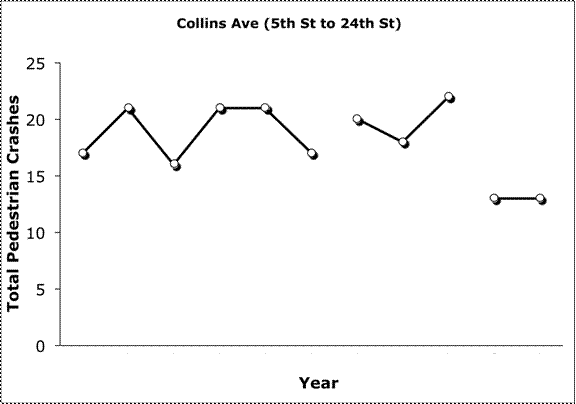
Figure 4.6 Crashes per Year Collins Ave. (5th Street to 24th St.) from 1996 to 2006
This corridor is immediately adjacent to the Collins Ave (5th to 24th St.) corridor. Treatments installed along this corridor included “TURNING VEHICLES YIELD TO PEDESTRIANS” symbol signs, and the use of the speed trailer, Crashes averaged 7 per year during the baseline period along this corridor, 5.3 per year during the NHTSA project and 3 per year during the FHWA project. The graph of the yearly crash data is shown in Figure 4.6. Although the average number of crashes is lower during the FHWA study there are too few crashes and too much overlap to conclude much about the efficacy of the treatment at this location.
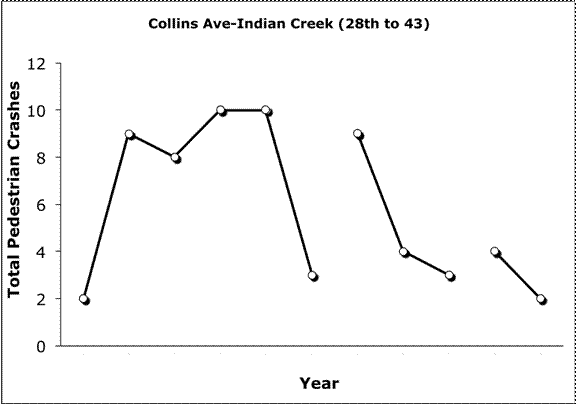
Figure 4.7 Crashes per Year Collins Ave. (Indian Creek 28th St. to 43rd St.) from 1996 to 2006
This crash corridor had the highest percentage of crashes involving turning vehicles during baseline of all of the selected corridors averaging 80% and the highest percentage of pedestrians struck over the age of 65 years (49%). Treatments installed along this corridor included “Turning vehicles yield to pedestrians” symbol signs, pedestrian zone signs, and the speed trailer. During the baseline condition the number of crashes per year averaged 14.3, during the NHTSA project crashes averaged 13 per year and during the FHWA project they averaged 9.5 per year. Overall it appeared the treatments were only moderately effective at this site. A graph of the yearly crash data is shown in Figure 4.8.
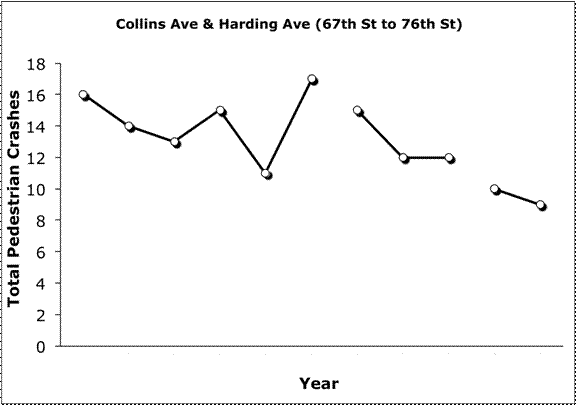
Figure 4.8 Crashes per Year Collins Ave. and Harding Ave. (67th St. to 76th St.) from 1996 to 2006
The corridor along Alton Road between 5th St. and 17th St. averaged 13.8 crashes per week during baseline. This corridor had the second highest percentage of daytime crashes (74%) and 42% of crashes occurred at intersections. Alton Rd. received a number of treatments. A large number of push buttons that confirmed the press and countdown pedestrian signals were installed along this corridor. The video detection system was installed at a midblock signalized crosswalk. Three intersections received a leading pedestrian interval, and one intersection received the “Turning vehicles yield to pedestrians” symbol sign treatment. The introduction of the NHTSA project was associated with a decline in crashes to 10 per year and the FHWA project was associated with a further small decline to 8.5% crashes per year. A graph of these data is shown in Figure 4.9.
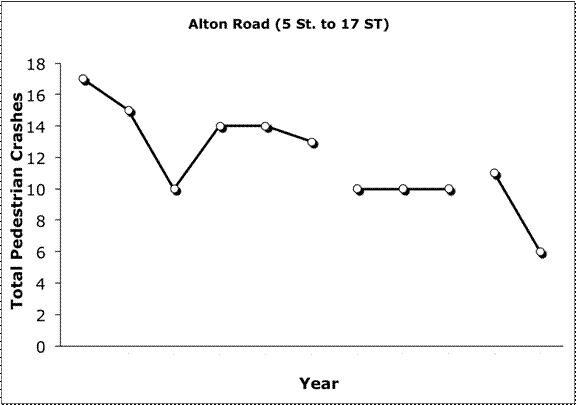
Figure 4.9 Crashes per Year on Alton Rd. 5th St. to 17th St.) from 1996 to 2006
The final graph shows the number of crashes occurring on 5th St. between Alton Rd. and Ocean Drive. More than half the crashes along this corridor occurred at night and only 23% involved turning vehicles. Treatments installed along this corridor included push buttons that confirmed the button press, and "Turning vehicles yield to pedestrians" symbol signs. During the baseline condition pedestrian crashes averaged 6.5 per year. After the NHTSA program was introduced these crashes declined to 4.7 per year and following the introduction of the FHWA project crashes declined to 4 per year.; Figure 4.10 shows crashes at this site. Overall there were not a large number of crashes along this corridor and it is difficult to determine whether the treatments had an effect.
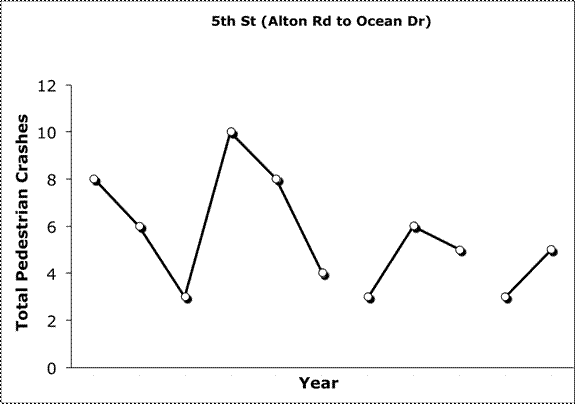
Figure 4.10 Crashes per Year on 5th St. Between Alton Rd. and Ocean Dr.) from 1996 to 2006
| < Previous | Table of Content | Next > |
