U.S. Department of Transportation
Federal Highway Administration
1200 New Jersey Avenue, SE
Washington, DC 20590
202-366-4000
| < Previous | Table of Content | Next > |
This report presents the methods and key findings from San Francisco PedSafe, a comprehensive pedestrian safety planning and engineering project. It is one of three such projects in the nation funded by the Federal Highway Administration (FHWA) to evaluate:
In Phase I: The effectiveness of a pedestrian safety plan targeted to higher-injury areas;
In Phase II: The implementation of a range of mostly low-to-moderate-cost, innovative safety improvements.
This report concentrates on the Phase II countermeasure implementation efforts, minimizing duplication with earlier reports, and focusing primarily on the implementation experience and overall lessons learned.
The San Francisco Municipal Transportation Agency (SFMTA) and the University of California, Berkeley Traffic Safety Center (TSC) proposed and conducted the project from planning through implementation. A separate Phase I (Planning) Final Report, finalized October 29, 2003, covered:
The February 28, 2005 Phase II Implementation Plan and Preliminary Engineering Report clarified the countermeasure plan, including cost estimates and, where appropriate, conceptual layout plans. It also presented refined outreach and data collection/evaluation plans. Due to engineering and institutional challenges, some of the proposed countermeasures could not be implemented. These challenges are described in this report.
The January 2008 Phase II Data Analysis Report presented detailed findings from observations of video recordings of pedestrian and driver behavior, and from intercept surveys of pedestrians at countermeasure sites. This Data Analysis Report is briefly summarized here, but readers interested in the safety effectiveness of the countermeasures should refer to the full Data Analysis Report. In addition, data findings are presented for several countermeasures (e.g., accessible/audible pedestrian signals) that were installed outside of the formal PedSafe project. These treatments were neither funded by the FHWA grant nor covered by the Evaluation Plan, and were therefore not evaluated in the same standardized manner.
San Francisco’s unique physical and sociopolitical characteristics influenced the conduct and impacts of the PedSafe project. This setting and its pedestrian injury patterns were described in detail in the Phase I (Planning) Final Report. Among the most significant characteristics of the city are the following:
San Francisco is a relatively compact, high-density city of 47 square miles with extensive public transit. Although the famous hills can be challenging, most residents and businesses are within a quarter-mile of a bus or rail line—and the weather is fairly mild most days. The street system and traffic signal hardware are older than those of most other major western U.S. cities. Along the “diagonal” arterial streets of Market Street and Columbus Avenue, there are five- and six-leg intersections.
In 2000 in the San Francisco metro area, 9.5% of the workforce commuted by public transit and 3.6% walked, while 68.3% drove alone. By comparison, in Miami, 4.2% commuted by public transit, only 2.3% walked, and 75.3% drove alone. In Las Vegas, 1.8% commuted by public transit, 3.7% walked, and 74.3% drove alone.1
The City Charter declares San Francisco to be a “transit first city,” which includes walking and bicycling as higher-priority modes. The SFMTA is unusual nationally, although not unique, in holding responsibility for both public transit and traffic engineering functions. Substantial funding has been allocated to pedestrian safety improvements. For example, a local transportation sales tax devotes over $800,000 annually to “pedestrian circulation and safety” improvements, and more than twice that level to “traffic calming.”
As a combined city and county, the local government has a streamlined governing structure. However, numerous agencies are involved in pedestrian safety. In recent years, pedestrian safety plans and outreach efforts have been carried out by two different sections of the Public Health Department, the Department of the Environment, the Police Department, the Public Works Department, the County Transportation Authority, and the SFMTA. Walk San Francisco, a citywide non-profit advocacy group, is joined by several other community organizations heavily involved in this area, as well as an official Pedestrian Safety Advisory Committee.
Major pedestrian safety efforts completed outside of this PedSafe project included:
San Francisco has one of the higher per-capita pedestrian fatality rates in the nation. However, when the estimated amount of walking (the level of exposure) is taken into account, the actual risk to the pedestrian stepping off the curb is lower than in many other cities.2 The level of pedestrian injuries has been steadily dropping over the last decade. Total pedestrian injury collisions fell 31.3% between 1996 and 2005.3
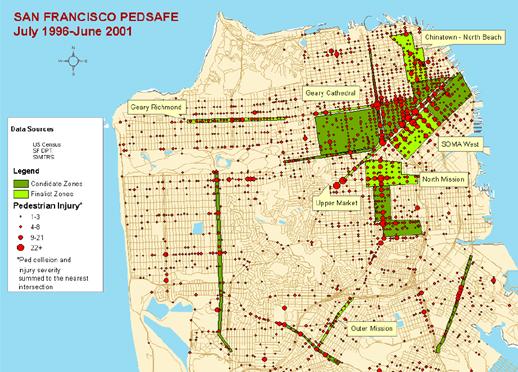
Figure 1.2-1 shows the general declining trend in pedestrian injuries since 1996. The annual number of pedestrian injuries at higher-injury locations has also decreased substantially. Figure 1.2-2 shows the PedSafe zones and the geographic distribution of pedestrian injuries. Higher-injury intersections and blocks are clustered in several areas and along major arterial corridors.
Figure 1.2‑1
San Francisco Pedestrian Injury Collisions: 1996-2005
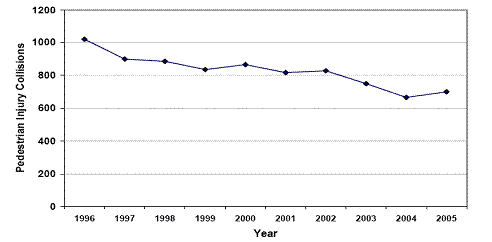
Figure 1.2‑2
San Francisco Pedestrian Injury Locations and PedSafe Zones
The Phase I planning analysis and recommendations were developed in 2002. In addition to extensive technical analysis, 10 meetings were held with internal and external stakeholders between March and December 2002.
In 2003, the Phase I Concept Plan was developed and revised, and arrangements made for implementation. The San Francisco Phase I concept plan and preliminary final report which is the basis for this implementation plan was approved by the San Francisco Municipal Transportation Agency (SFMTA) Board of Directors in April 2003. The SFMTA board is the policymaking entity for traffic engineering functions previously managed by the Department of Parking and Traffic (DPT), now the Division of Parking and Traffic.
The Phase I problem analysis was conducted on three different levels: (1) citywide, (2) within selected corridors and zones with higher levels of pedestrian injuries, and (3) at specific intersections within the study zones. Extensive collision analysis was conducted using the Pedestrian Bicycle Collision Analysis Tool (PBCAT) and statistical software. This analysis was useful both in defining study zones and in assessing potential countermeasures for implementation at specific locations.
Some 68 potential countermeasures were assessed based on criteria including: relative cost, presumed safety effectiveness, and ease of implementation. Nine general engineering countermeasures and 10 intelligent transportation systems (ITS) countermeasures were selected for consideration for specific locations. No conceptual engineering was possible in Phase I.
The accompanying data collection/evaluation plan proposed assessment of the individual impacts of each countermeasure and a broader evaluation of its cumulative impact within study areas. Measures of effectiveness (MOEs) included both collisions and surrogate measures of pedestrian and driver behavior. However, it was not possible to conduct meaningful collision analysis within the Phase II timeframe, considering the additional time needed to design and implement the countermeasures and the delay in receiving collision tabulations.
The outreach plan proposed integrating PedSafe countermeasure outreach and awareness into ongoing efforts, as well as working with agencies responsible for pedestrian safety (e.g., Police and Public Health departments) and working with grassroots community groups committed to pedestrian safety projects. For the most part, pedestrians did not need education about countermeasures because their meaning was intuitively clear (e.g., countdown signals and “LOOK” pavement stencils). The plan outlined a media campaign, which was later supplemented by educational presentations about pedestrian safety, including distribution of retro-reflective items (e.g., armbands) at elementary/middle schools and senior centers.
In a Summer 2003 funding application, the San Francisco team proposed to move into Phase II implementation. The funding application schedule did not allow for thorough feasibility analysis prior to the deadline for submission of a detailed budget and implementation schedule for specific countermeasures. A two-day site visit in November 2003 included a detailed review of the initial countermeasure plan by FHWA staff and consultants.
Extensive engineering efforts began in 2004, including additional feasibility research and design layouts for a broad range of innovative devices and interventions. An Implementation Plan and Preliminary Engineering Report (February 28, 2005) provided a detailed blueprint for conducting Phase II.
Implementation of the countermeasures took place from Spring 2005 through Fall 2006, with final refinement of several devices in early 2007. The actual implementation was largely consistent with the Phase I report and the Phase II implementation plan, although some modifications were made in response to practical difficulties or changing circumstances. Some countermeasures were not feasible for implementation, as described in more detail in Chapter 4.
A total of thirteen countermeasures (nine general engineering countermeasures and four intelligent transportation systems [ITS] countermeasures) were implemented and evaluated by the Traffic Safety Center during this Phase II investigation:
General Engineering Countermeasures
Impactable “Yield To Pedestrians” Signs
Roadside “Yield To Pedestrians” Signs
“LOOK” Pavement Stencils
Modified Signal Timing
“Pedestrian Head Start”
Advanced Stop Lines and Red Visibility Curb Zone Lines
ADA Curb Ramps
Median Refuge Islands
Distribution of Retro-Reflective Materials
Intelligent Transportation Systems (ITS) Countermeasures
Flashing Beacons (both automated detection and push button-actuated)
Portable Radar Speed Trailer
Automated (Video) Detection of Pedestrians to Extend Crossing Time
Radar Speed Display Sign (fixed)
In addition, the costs and requirements for the outreach program are described. This outreach effort included distribution of a video public service announcement (PSA) to cable and small/ethnic local TV stations, and presentations at schools and senior centers (including distribution of retro-reflective items). It was not possible to evaluate each of the outreach efforts separately.
The following steps were required for the implementation of each countermeasure:
Conceptual Engineering
Feasibility Study
Preliminary and Final Engineering
Approvals (when necessary)
Procurement
Coordination with Data Collection Schedule
Installation
Monitoring
Maintenance and Refinement
Both the radar speed trailer and the outreach program carried substantial operating personnel costs. The other countermeasures, once installed, did not require personnel for operation, although modification and specific maintenance were required by many of the devices. In general, the labor costs far exceeded the equipment and materials costs. Overall, the engineering/administrative costs were quite substantial, largely due to the need for specialized training, mobilization, and approvals for new devices. These engineering/administrative costs often exceeded the material/equipment costs and the installation labor.
The least expensive countermeasures in total per-unit costs were the “LOOK” pavement stencils and the roadside “Yield to Pedestrians” signs. The most expensive countermeasures were the video detection system and the flashing beacon with automated detection. However, the video detection costs are significantly understated as the PedSafe project was not charged for the video detection camera equipment or its initial installation, and substantial technical assistance was provided free of charge by Econolite, the manufacturer of the equipment.
All countermeasures were explicitly or implicitly compliant with the Manual of Uniform Traffic Control Devices (MUTCD) and the California MUTCD State Supplement. It was not necessary to obtain special approval to experiment with any of the countermeasures from FHWA or the California Department of Transportation (Caltrans). Several countermeasures that were considered experimental when initially proposed by the San Francisco team were added to the MUTCD in the 2003 revision. Formal local approvals were needed for red visibility curb zones (from the Municipal Transportation Agency Board of Directors and the County Board of Supervisors).
The following countermeasures are considered approved or standard devices or treatments and are now widely used in California, however they were regarded as innovative at the time proposed:
Impactable “Yield To Pedestrians” Signs
Roadside “Yield To Pedestrians” Signs
Modified Signal Timing
“Pedestrian Head Start”
Advanced Stop Lines and Visibility Red Curb Zones
ADA Curb Ramps
Median Refuge Islands
The following countermeasures are in very limited use as “off the shelf” products, but are not considered experimental:
“LOOK” Pavement Stencils4
Flashing Beacons (push button-actuated)
Portable Radar Speed Trailers
Radar Speed Display Signs
Distribution of Retro-Reflective Materials
Video Public Service Announcements
The following countermeasures were “custom-made” and involved innovative technologies, although they did not require approval as formal experiments:
Automated (Video) Detection of Pedestrians to Extend Crossing Time
Flashing Beacons (Automated Detection with Infrared Bollards)
The countermeasures requiring the most effort to install or use were:
Portable Radar Speed Trailers
Radar Speed Display Signs
Automated (Video) Detection of Pedestrians to Extend Crossing Time
Flashing Beacons (Automated Detection with Infrared Bollards)
Several countermeasures originally proposed in the Phase I Concept Plan were not implemented. The reasons are explained below.
“Smart lighting” is a promising concept of supplemental street corner and crosswalk lighting triggered by detection of pedestrians. The Phase I Concept Plan proposed this countermeasure for several intersections that had higher numbers of nighttime pedestrian injuries. More detailed research early in Phase II could not find a major U.S. city that had experimented with this technology, although it was proposed for use by in Miami and Las Vegas. SFMTA management was concerned about the possible liability exposure from the use of such a device. Street lighting is not managed by that agency’s Division of of Parking and Traffic in San Francisco, and the other two departments that operate street lights (Public Utilities Commission) and design lighting improvements (Public Works) were not interested in cooperating on street lighting improvements considering the funding available.
In the Phase I Concept Plan, DPT proposed repairing and upgrading the crosswalk pavement lights which then existed at the intersection of Mission and Santa Rosa, with a more visible configuration of lights. The Mission & Santa Rosa installation had proven unreliable and had been turned off indefinitely, primarily due to water collecting in the cans below the lights (despite waterproofing efforts by electricians), and secondarily due to detection problems with the microwave pedestrian detection units. Pressure from policy makers and the news media convinced DPT that it was unacceptable to allow the lights to remain. DPT removed the lights and committed to replacing them with flashing beacons. Data were already collected at all four in-pavement crosswalk light locations.
While exclusive pedestrian phases were installed prior to Phase II (and at local expense) at four intersections on Stockton Street, installation at a fifth adjacent intersection was deferred indefinitely due to concerns about impacts on Muni public transit schedule adherence. This improvement is still planned for the future after transit signal priority can be provided and other signal timing adjustments made to satisfy Muni management.
The animated eyes countdown signals were not installed as originally planned, because the vendor, Relume, lost interest in supporting experimentation with the device, apparently after assessing the market potential for the devices.
Because insufficient time had elapsed since installation of the countermeasures to analyze their long-term impacts on pedestrian injuries, surrogate evaluation measures were used. Two primary methods were employed to assess the impacts of the countermeasures:
Video recorded observations of pedestrian and driver behavior.
Intercept (interview) surveys of pedestrians at countermeasure intersections.
The pedestrian/driver observations were generally completed before and after installation. In some cases, multiple baseline and follow-up observations were conducted to ascertain the effects of the passage of time and novelty fading. Statistical tests (generally chi-square for contingency tables and t-test for difference of means/proportions) were performed.
Following is a summary of results. Results for individual countermeasures and intersections are described in detail in the separate January 2008 Data Analysis Report. Generally, video recorded observation results are only reported in this table if they are statistically significant (p<0.05).
| Counter-measure | Purpose | Data Collection/ Analysis Methods |
Observation Highlights | Relative Cost | Comments |
|---|---|---|---|---|---|
| 1. Impactable Yield to Pedestrian Signs | Used in median of uncontrolled crosswalks to encourage drivers to yield to pedestrians and to help delineate the crosswalk. Designed to be safe and visible next to moving traffic. | Video recorded pedestrian/driver behavior at 4 crosswalks (including marked and unmarked crosswalks at same intersection). Interviewed pedestrians at 1 intersection. | Very substantial increases in drivers yielding at all 4 crosswalks. About 27% of respondents felt signs made them feel safer, but only 18% of respondents correctly identified the recent safety change. | Low | High rate of damage to signs unless they are placed on a raised island or are completely out of turn path. |
| 2. Roadside Yield to Pedestrian Signs | Mounted at street corners of intersections to encourage turning drivers to yield to peds. Usually used at signalized intersections | Video recorded pedestrian/driver behavior at 4 crosswalks, 3 of them 4-leg, and 1 a 3-leg. 3 of 4 were signalized. Focused on turning drivers who would see signs. | Negligible impact on drivers yielding at all 4 corners. About 28% of respondents felt signs made them feel safer, but almost none correctly identified the recent safety change initially. | Low | Standard MUTCD sign used, although more striking versions have been used by other cities. |
| 3. “LOOK” Pavement Stencils | Thermoplastic “LOOK” stencils applied on pavement in crosswalks (within 4 feet of curb) to encourage pedestrians to look for conflicting vehicles. Tested at signalized intersections only, but could be used at unsignalized. | Video recorded pedestrian/driver behavior at 4 intersections. Interviewed pedestrians at 1 intersection. | Mixed impacts on pedestrians looking:, increased at 2 and decreased at 2. Significant decrease in vehicle/pedestrian conflicts at only 1 intersection. About 29% of respondents felt safer, but only about 6% correctly identified the recent safety change. | Low | Stencils are highly susceptible to fading and blemishes. Used Chinese/English at 1 location. MUTCD compliant, but not explicitly included. |
| 4. Modified Signal Timing | All-red phase extensions at 3 intersections intended to reduce conflicts for pedestrians who are late crossing. (At 1 intersection, accompanied by installation of pedestrian signals for crossing minor street, and at other pedestrian clearance increased, but Walk shortened (due to area wide cycle change).) Also, longer cycle and longer pedestrian crossing time at 4th intersection. | Video recorded 2 all-red intersections. Manual observations for 2 other intersections Survey at 1 all-red intersection. | Slight decrease (1-2%) of pedestrians who finished crossing after cross traffic got green indication. Average crossing time slightly reduced. About 60% of respondents felt the signal timing change made them “extremely safe” or “more safe.” However, virtually none realized initially that there had been a timing change. | Low | Not possible to isolate simple timing changes. |
| 5. Pedestrian Head Start | 4-second leading pedestrian interval added at 3 intersections with heavy left turns from one-way streets, and also at 1 2-way intersection with more balanced turning movements. Intended to allow pedestrians to start crossing and establish right-of-way before heavy turn movements block them. | Video recorded 4 intersections. Survey at 1 intersection. | Substantial reduction in vehicles turning in front of pedestrians and in pedestrians finishing on Red Hand at 2 intersections. About 56% of respondents felt the signal timing change made them feel “extremely safe” or “more safe.” However, only 8% correctly identified the recent safety change. | Low | Impact of pedestrian head start could be enhanced with red turn arrow. |
| 6. Advanced Stop Lines and Red Visibility Curb Zones | Line typically 4-10 feet before crosswalk (controlled or uncontrolled) to discourage intrusion into crosswalk and to provide better visibility, reduce multiple threat problem. In some cases accompanied by red visibility curb zones | Video recorded 2 intersections. Both had relatively small samples for some variables. Interviewed pedestrians at 1 intersection. | Generally inconclusive results for pedestrian/driver behavior. About 37% said change made them feel safer, however none correctly identified the change initially. | Low | |
| 7A. Flashing Beacons – Push Button Actuated | Used at uncontrolled crosswalk to warn drivers to yield to pedestrians | Video recorded 1 intersection. Interviewed pedestrians at 1 intersection. | Substantial reduction in vehicle/pedestrian conflicts and pedestrians trapped, substantial increase in vehicle yielding. | Medium | |
| 7B. Flashing Beacons – Automated Detection | Used at uncontrolled crosswalk to warn drivers to yield to pedestrians. Automated detection useful because substantial share of pedestrians typically do not push button. | Video recorded 1 intersection. No pedestrian interview survey. | Substantial reduction in vehicle/pedestrian conflicts and pedestrians trapped, substantial increase in vehicle yielding. | High (higher than push button type) | |
| 8. Portable Speed Trailer | Used mid-block to notify drivers they are speeding. Trailer typically moved daily, so duration of impacts may be limited, but drivers are less likely “tune it out.” | Video recorded pedestrian/driver behavior at 4 intersections. Collected pre/post vehicle speed data. No interview survey because trailer only deployed for a day per location. | Inconclusive impacts on driver behavior at crosswalks. Should have no impacts on pedestrians. Significant speed reductions. | Medium capital cost, but can have major operating costs for towing, storage, setup. | More a general speed control measure than pedestrian-specific measure. |
| 9. Median Refuge Island | Used at controlled and uncontrolled crossings to provide a safer median refuge to encourage pedestrians to stop and defer crossing until safer. Also, may slow turns. | Video recorded pedestrian/driver behavior at 2 intersections. Interviewed pedestrians at 1 intersection. | Inconclusive impacts on driver and pedestrian behavior. | Medium | |
| 10. Automated Video Detection of Pedestrians to Adjust Signal Timing | Used to extend crossing time when pedestrians are detected as likely to finish on the red. Extension in SF is for maximum 3 seconds and shows solid Red Hand and green ball to pedestrian. | Video recorded pedestrian/driver behavior at 1 intersection. Also collected data on extension frequency and duration. No interview survey since countermeasure is virtually invisible to pedestrians. | Substantial reduction in pedestrians finishing crossing on red. | High, both capital and labor to set up. | Vendor believes this is the only such video application in the US. Ideally, detection logic should be changed so vehicles encroaching on crosswalk don’t trigger extension. |
| 11. Fixed Radar Speed Display Sign | Used mid-block to notify drivers they are speeding. As a permanent sign, effects at one location more likely to endure, but drivers may “tune out.” | Video recorded pedestrian/driver behavior at 3 intersections. Also measured pre/post vehicle speeds. Interviewed pedestrians at 1 intersection. | Inconclusive pedestrian/driver behavior impacts. No significant speed reduction on arterial streets. About 49% of pedestrians felt countermeasure made them feel safer, but none identified the change correctly initially (hardly visible from intersection). | Medium | Signs were installed on arterial streets where it may be difficult to know if sign speed applies to them or others in platoon, although in some cities they are used only on neighborhood collector streets, often near schools. |
| 12. ADA Curb Ramps | Used for safer, easier crosswalk entry by those in wheelchairs, with strollers, etc. The SF installation separated curb ramp from gas station driveway at 1 corner to reduce potential for conflicts between gas station traffic and pedestrians. | No driver/pedestrian behavior analysis because curb ramps not expected to have observable change on measures of effectiveness. Interviewed pedestrians at 1 intersection. | Only 1% of pedestrians felt countermeasure made them safer and only 2% identified the change correctly. | Medium |
NOTE: All countermeasures are considered standard devices (in federal traffic engineering manual, Manual of Uniform Traffic Control Devices, MUTCD), unless otherwise noted. “Low cost” typically is under $5,000 per installation, “medium" is $5,000 to $20,000.
The raw number of pedestrian injury crashes before and after installation at the four existing Stockton Street scramble intersections increased (comparing equal 2.5-year periods) from 2 to 4. However, several factors suggested that this result should not imply a continuing negative impact:
Relatively low pre-installation numbers.
Injuries sustained by elderly only.
Two of 4 collisions could not be related to the pedestrian scramble, even indirectly.
The impact of pedestrian scramble phasing on collision rates at other intersections has been positive. Three other intersections outside of Chinatown experienced substantial reductions in pedestrian-involved collisions after the scramble phasing was introduced.
The total number of vehicle/pedestrian conflicts observed at the Stockton Street pedestrian scramble intersections decreased from 7.0% to 1.1%. However, the proportion of pedestrians running or aborting their crossing increased at each intersection, in total from 5.3% to 11.2%. One possible reason is that late in the exclusive pedestrian phase, with no conflicting auto movements and the countdown showing few seconds remaining, many pedestrians are emboldened to cross although they need to run in order to reach the other side of the intersection before traffic is released.
A post-installation intercept survey was conducted by University of California, Berkeley Traffic Safety Center (TSC) researchers of pedestrians on Stockton Street. Among over 150 respondents, 69.5% said they felt safer with the pedestrian scramble phase. A strong majority favored the phasing change, with 72% saying they liked it “very much.”
San Francisco has been a national leader in the use of pedestrian countdown signals, converting virtually all of the pedestrian signals citywide (over 800 intersections) to the countdown version This was completed outside of the FHWA PedSafe project, and the results of the conversion were reported separately and in greater detail.5
During the 14-intersection pilot installation, there were statistically significant improvements in pedestrian behavior and attitudes. The number of pedestrians who finished crossing during the red phase decreased from 14% to 9%. The proportion of pedestrians who ran or aborted their crossing decreased from 13% to 8%. The proportion of pedestrians who reported the pedestrian signals to be “very helpful” increased from 34% to 76%.
At 579 intersections converted from conventional to countdown pedestrian signals, the number of pedestrian injury collisions decreased by 22%. During the same period, at 204 other intersections without countdown signals, the decline was only 2%. The proportion of all traffic collisions attributed to running a red light decreased from 45% to 34%. While there were numerous factors affecting the decline in the number of drivers running red lights, it is likely that the countdown devices played a major role by providing warning to drivers approaching a “stale green” (a green light about to change).
In-pavement crosswalk lights were installed at four locations in San Francisco: three by the city and county (DPT) in 2001, and the first by a private school (in Spring 2000). At the two infrared bollard locations, 91-94% of pedestrians were detected correctly, and only 2-9% of activations were false. By contrast, at one microwave pedestrian detection location, only 71-86% of pedestrians were detected correctly, and 24% of activations were false.
For the combined microwave pedestrian detection data (at the two installations), the proportion of drivers stopping for pedestrians increased from 53% before installation to 72% after installation. The percentage of pedestrians running to complete or aborting crossings actually increased from 2% to 5%.
At the City Hall infrared bollard installation, the number of drivers stopping, increased from 67% to 82%. The percentage of pedestrians running to complete or aborting crossings was reduced from 6% to 3%. At the same location, pedestrian intercept interviews were conducted. Of those aware of the lights, 50% believed they were “very helpful” in crossing safely. Also, 73% believed drivers were yielding more frequently.
Modern accessible pedestrian signals (APS) provide an audible and vibrotactile indication of the Walk signal to the blind and visually impaired. They also can provide audible and Braille information about the intersection name and crosswalk orientation. San Francisco has installed APS devices at 52 intersections.
While primarily intended to serve visually impaired pedestrians, the devices also appear to benefit sighted pedestrians. The proportion of sighted pedestrians finishing on the solid Red Hand phase decreased from 27% to 17%, while the proportion starting on the Walk phase increased from 59% to 70%.
The education and outreach program consisted of three tracks: (1) development/distribution of video public service announcements (PSAs) to cable and small/ethnic local TV stations, (2) presentations to schools and senior citizen facilities, and (3) distribution of retro-reflective materials at the presentations and through organizations such as the YMCA.
The video PSAs were included initially in the FHWA Pedestrian Safety Campaign Planner. SFMTA staff arranged for Spanish, Russian, Chinese/Cantonese, and Chinese/Mandarin voice-over versions.
The direct outreach program was presented at five senior centers and six public elementary and middle schools in or near study zones (see Appendix A). The presentations included general safety tips and information about the PedSafe project and other related projects. Retro-reflective items, such as armbands, were distributed at the presentations.
The retro-reflective accessories were also provided to schools and senior centers unable to accommodate a presentation. The purchase included: 3,000 zipper pulls, 1,250 clipsters/badge holders, 750 armbands, and 250 belt wraps. The accessories were emblazoned with safety slogans.
The primary lessons learned from the project about the countermeasures include the following:
A wide range of pedestrian safety countermeasures is available and can be tailored to specific location characteristics. A package of such measures can reduce vehicle/pedestrian conflicts, increase driver yielding, and make other changes in driver and pedestrian behavior that should over the long term decrease pedestrian injuries.
Particularly cost-effective countermeasures appeared to be in-pavement “Yield To Pedestrians” (YTP) signs and pedestrian countdown signals. The pedestrian countdown signals, installed citywide in San Francisco, not only appear effective in aiding pedestrians in safer crossing, but also have some value in warning drivers of approach on a “stale green.” The impactable YTP signs were effective and relatively inexpensive, but susceptible to damage when not installed on a raised island.
By contrast, the “LOOK” pavement stencils appeared to have negligible value.
Low-cost but effective measures have the advantages of quick implementation and the potential to draw support and funding for further improvements.
Flashing beacons and in-pavement crosswalk lights both appeared effective at inducing drivers to yield to pedestrians at uncontrolled crosswalks.
The radar speed trailer was more effective than the fixed speed display sign at reducing driver speeds.
Pedestrian Scramble phasing is potentially quite effective for certain situations (e.g., smaller intersections with heavy volumes of turning vehicles and pedestrians), but can be difficult to use in some situations (e.g., wide intersections with heavy through traffic volumes, including transit service).
Pedestrian Head Starts had mixed results. There were substantial reductions in the number of vehicles turning in front of pedestrians and in the number of pedestrians finishing crossing in the Red Hand phase at two of four intersections. However, these changes did not lead to a significant reduction in vehicle/pedestrian conflicts.
Video detection of pedestrians to extend crossing time appeared to be a promising technology, but needs further testing and refinement.
Infrared detection of pedestrians to trigger beacons or in-pavement lights has been more effective in San Francisco than overhead microwave detection.
Accessible (Audible) Pedestrian Signals (APS) were helpful to sighted pedestrians as well as visually impaired pedestrians.
Pedestrians appeared to appreciate most countermeasures, but showed minimal awareness of which devices had been installed. Among pedestrians surveyed about improving intersection safety, comments varied widely and there were essentially no common suggestions.
Device-specific safety instruction was typically not necessary, as most devices were intuitive or even invisible to pedestrians.
To reach the maximum audience, translate outreach messages into multiple languages.
Coordinating improvements with other agencies, especially those involved in street construction, is critical.
Developing and implementing a comprehensive pedestrian safety plan requires a time frame of several years or more.
It is advantageous to have full-time, dedicated pedestrian safety planning and engineering staff.
Institutional issues proved challenging, especially dealing with other departments regarding public transit and street lighting issues.
Video data collection had the advantage of allowing repeated viewings and precise time stamping of events (such as pedestrian wait time duration). However, the labor requirements for tabulating video recorded events were several times greater than for manual data collection. In addition, the video field of vision was often restricted.
Clear, consistent definitions of measures of effectiveness (MOEs) are helpful, but difficult to achieve. In particular, there is no universal, accepted definition of “vehicle/pedestrian conflict.”
The earlier version of PBCAT used for Phase I analysis proved difficult to use. Statistical software and Crossroads™ software proved more flexible and helpful. Often, the actual police collision reports had to be reviewed to understand the problems specific to an intersection (such as precise vehicle movements involved prior to collisions).
While analysis of crash patterns is quite helpful in selecting the proper treatment, several years of crash data are needed, and even then, patterns at the same intersection may vary significantly year-to-year. Site visits are therefore essential.
Crash analysis should consider the pedestrian and/or vehicle volumes as a measure of exposure, rather than only the absolute number of injuries or crashes.
Similar projects were carried out in the Las Vegas and Miami metropolitan areas. A preliminary final report was available for Miami, but not for Las Vegas as of publication time. These findings were consistent with San Francisco’s for the impactable “Yield To Pedestrians” signs and Pedestrian Head Starts (leading pedestrian interval.)
The primary opportunity for additional research would be an evaluation of actual pedestrian injury impacts of the countermeasures. This would require follow up observations 3-6 years after device installation. SFMTA participated in a proposal by the San Francisco Injury Center (affiliated with the University of California, San Francisco) to the federal Centers for Disease Control for funding to perform this analysis, but the application was turned down due to limited funding.
1FHWA website on 2000 Census, https://www.fhwa.dot.gov/ctpp/jtw/jtw4.htm.
2Surface Transportation Policy Project, Pedestrian Safety in California: Five Years of Progress & Pitfalls, August 2002. http://www.transact.org/ca/ped_safety_report_2002.htm
3More details on San Francisco traffic-related injuries and fatalities are available from the San Francisco Department of Parking and Traffic, 2005 Traffic Collision Report. http://www.sfmta.com/cms/rtraffic/documents/Collision_report_2005.pdf
4The LOOK pavement stencils included a Chinese-English stencil that was custom designed by SFMTA staff, working with the vendor.
5Markowitz, F., Sciortino, S, Fleck, J. and B. Yee. "Pedestrian Countdown Signals: Experience with an Extensive Pilot Installation." ITE Journal, vol. 76, no. 1 (January 2006): 43-48. Fielding, S. Pedestrian Countdown Signals: Evaluation of Citywide Installation in San Francisco. Pro Walk Pro Bike Presentation, Madison, WI, September 5, 2006.
| < Previous | Table of Content | Next > |

