U.S. Department of Transportation
Federal Highway Administration
1200 New Jersey Avenue, SE
Washington, DC 20590
202-366-4000
Improving safety is a top priority for the U.S. Department of Transportation, and the Federal Highway Administration (FHWA) remains committed to reducing highway fatalities and serious injuries on our Nation's roadways through the use of proven safety countermeasures, including Road Diets.
Four-lane, undivided highways experience a number of crash types as traffic volumes increase, including:
As traffic volumes and turning movements (at intersections and driveways) increase, more and more four-lane, undivided roadways experience the above safety concerns. Additionally, as active transportation increases, communities desire more livable spaces, pedestrian and bicycle facilities, and transit options. One solution that benefits all modes is a Road Diet.
Will a Road Diet Increase Costs?
"We planned our Road Diet installation as part of the overlay, so there was no additional cost to the construction budget."
- Robert Rocchio, Managing Engineer, Traffic Management & Highway Safety, Rhode Island DOT
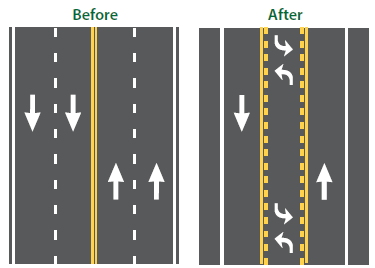
A Road Diet is generally described as "removing travel lanes from a roadway and utilizing the space for other uses and travel modes."4 This informational guide will focus on the most common Road Diet reconfiguration, which is the conversion of an undivided four lane roadway to a three-lane undivided roadway made up of two through lanes and a center two-way left-turn lane (TWLTL). The reduction of lanes allows the roadway cross section to be reallocated for other uses such as bike lanes, pedestrian refuge islands, transit uses, and/or parking (see Figure 2).5
Figure 2. Typical Road Diet Basic Design
In addition to four- to three-lane configurations, other roadway reconfigurations, such as those depicted below, can also provide safety benefits:
| 4-lane to 5-lane: In some cases it is necessary to keep two lanes in each direction for capacity purposes. Narrowing lane width to provide a TWLTL introduces the benefits of separating turning vehicles and reducing operating speeds. | 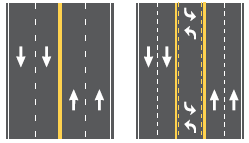 |
| 2-lane to 3-lane: If a capacity expansion of an existing two-lane road is desired, in some cases a three-lane cross section can provide similar operational benefits to a four-lane cross section while maintaining the safety benefits of the three-lane configuration. | 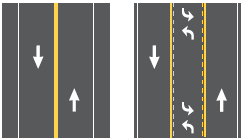 |
| 3-lane to 3-lane: In some cases practitioners could reduce the width of each lane instead of reducing the number of lanes. Converting an existing three-lane roadway to a three-lane cross section with narrowed lanes can accommodate bicycle lanes or parking, and provide some traffic calming benefit. | 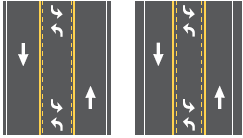 |
| 5-lane to 3-lane: In some cases jurisdictions have reconfigured five-lane sections to three lanes, adding features such as diagonal parking and protected bicycle lanes with the extra cross section width. | 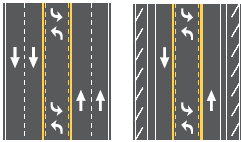 |
Other Combinations: Some cases may require allocating the cross section differently by providing unbalanced lane splits (e.g., two in one direction, one in the other), separated left turn lanes for opposite directions, or providing shoulders for other uses (e.g., parking, bicycle lanes, sidewalks). The basic concepts of Road Diets still apply, although in some cases there may be different safety and operational effects than with a classic 4-to-3 Road Diet.
The focus of roadway projects during the 1950s and 1960s was on system and capacity expansion, not contraction. Whenever and wherever traffic volumes on a section of road outgrew what a 2-lane road could accommodate efficiently, the next step in roadway design in most cases was to increase the cross-section to 4 lanes. No engineering guidance during that period encouraged consideration of a three-lane alternative.
Consequently, four-lane roadways became the norm throughout the country. Some of these roadways accommodated high traffic volumes requiring four-lane cross-sections; but many accommodated much less traffic for which a smaller cross-section simply had not been considered.
Lane reduction projects have occurred for many years; they simply have not been recorded or studied. One of the first known installations of a Road Diet occurred in 1979 in Billings, Montana. Here, 17th Street West was converted from a four-lane undivided highway to three lanes (including a two-way left-turn lane, or TWLTL). The roadway width was 40 feet, and the average daily traffic (ADT) was approximately 10,000 vehicles. An unpublished report referenced in a number of previous studies indicated a reduction in crashes with no appreciable change to vehicle delay.6
Road Diets increased in popularity in the 1990s, with installations occurring in Iowa, Minnesota, and Montana, among many other states.7 In some instances the appreciation for Road Diets was shown first in urban areas, such as Seattle, Washington, and Portland, Oregon. More recently, FHWA deemed Road Diets and other roadway reconfigurations a "Proven Safety Countermeasure" and promoted it as a safety-focused alternative cross section to a four-lane undivided roadway.
Numerous studies have examined the estimated safety effects of converting four-lane undivided roads to three-lane cross sections with TWLTLs. The majority of treatment sites and crash data in these studies come from California, Iowa, and Washington, with additional analysis of Road Diets in Florida, Georgia, Michigan, Minnesota, and New York. Several studies used the same, or virtually the same, treatment sites in Iowa. Average Daily Traffic (ADT) for treatment sites in these studies ranged from 2,000 to 26,000, with most sites having an ADT below 20,000.
In the late 1970s, Nemeth conducted a research study focused on TWLTLs that included one field study location that was a four-lane undivided highway converted to three lanes in a commercial district. Results included a reduction in operating speed and increased delay.8
The safety analysis methods and the reliability of the findings vary widely. Some studies considered multiple treatment sites and used advanced statistical techniques such as the empirical Bayes methodology to estimate the change in total crashes and crash rates. Other studies were conducted using simple before-and-after analysis without controls, did not account for potential regression-to-the-mean effects, and examined crash data at a single treatment site for only several months following Road Diet implementation.
Pawlovich, et al., (2005) conducted a Bayesian data analysis of 15 Iowa Road Diet treatment sites and 15 control sites over a 23-year period. Traffic volumes ranged from approximately 2,000 to 15,000 vehicles per day. The study concluded that a Road Diet produced a 25.2 percent reduction in crashes per mile of roadway and an 18.8 percent reduction in the crash rate.9
A study by Noyce et al. (2006) first analyzed data using traditional approaches, which involved a comparison of before-and-after crashes. Crash data were analyzed by yoked-pair comparison analysis and the empirical Bayes approach. The traditional before-and-after approach estimated a reduction in total crashes of approximately 42 percent. A yoked-pair comparison analysis found a 37 percent reduction in total crashes and a 46 percent reduction in property damage only (PDO) crashes (both statistically significant). The estimated reductions in crash rates (per vehicle mile traveled) were 47 percent for total crashes and 45 percent for PDO crashes (both statistically significant), and the empirical Bayes approach estimated a 44 percent reduction in total crashes.
In 2010, FHWA conducted an empirical Bayes evaluation of total crash frequency before-and-after Road Diet implementation. Results indicated a statistically significant reduction in crashes due to the Road Diet treatment in two separate data sets (one data set for 15 sites in Iowa and one set for 30 sites in California and Washington), as well as for the results of all 45 sites combined. The Iowa data indicate a 47 percent reduction in total crashes while the California and Washington data indicate a 19 percent decrease. Combining both data sets results in an estimated 29 percent reduction in total crashes.10
The FHWA report indicated that differences between the Iowa sites and those in California and Washington may be a function of traffic volumes and characteristics of the urban environments where the Road Diets were implemented. Annual average daily traffic (AADT) for the Iowa sites ranged from 3,718 to 13,908 and locations were predominately on U.S. or State routes passing through small towns; AADT for the sites in California and Washington ranged from 6,194 to 26,376 and were predominately on corridors in suburban environments that surrounded larger cities. Sites with lower crash modification factors (CMF) generally had higher traffic volumes, suggesting the possibility of diminishing safety benefits as traffic volumes increase. The authors recommended that the choice of which CMF to use should be based on characteristics of the site being considered. If the proposed treatment site is more like the small-town Iowa sites, then the 47 percent reduction found in Iowa should be used. If the treatment site is part of a corridor in a suburban area of a larger city, then the 19 percent reduction should be used. If the proposed site matches neither of these site types, then the combined 29 percent reduction is most appropriate.
Based on the history of safety studies presented in this section, installing a Road Diet can lead to an expected crash reduction of 19 to 47 percent. Variables affecting safety effectiveness include pre-installation crash history, installation details, traffic volumes, and the urban or rural nature of the corridor.
Appendix A provides summaries of the key findings from Road Diet safety assessments and additional detail about the individual studies.
The Road Diet Informational Guide provides safety, operational, and quality-of-life considerations from research and practice that may impact all users along a corridor – motorists, commercial vehicles, and non-motorized traffic. This document will guide readers through the decision-making process to determine if Road Diets are a good fit for a certain corridor. The guide will also discuss Road Diet feasibility, design, and post-implementation evaluation.
Figure 3. Focus of Each Informational Guide Chapter
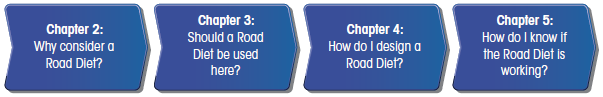
The Road Diet Informational Guide is organized in the following manner, as illustrated in Figure 3 and described below:
Chapter 2 presents a high-level overview of how a Road Diet can improve safety and maintain operations for motorized and non-motorized road users along a corridor, enhance the quality of life and livability, and be implemented at a low cost.
Chapter 3 takes an in-depth look at impacts that a Road Diet may have on safety and operations for motorists, pedestrians, bicyclists, and transit along a corridor. This chapter includes feasibility determination factors that assist practitioners with selecting corridors that may be candidates for Road Diets and presents guidance for discussing Road Diets with a community.
Chapter 4 leads practitioners through the Road Diet design process. This chapter provides geometric design, operational design, and both Complete Street and system-wide considerations. The intent of this chapter is to walk a practitioner through the design process for the corridor that will be converted to a Road Diet design.
Chapter 5 details post-implementation evaluation processes to measure Road Diet performance. Several evaluations exist for determining the effect a Road Diet has on safety, operations, non-motorized transportation modes, and transit.

