U.S. Department of Transportation
Federal Highway Administration
1200 New Jersey Avenue, SE
Washington, DC 20590
202-366-4000


Skip to content
Facebook iconYouTube iconTwitter iconFlickr iconLinkedInInstagram

Safety

FHWA Home / Safety / Roadway Departure / Roadway Visibility Research Needs Assessment

Roadway Visibility Research Needs Assessment

 < Previous Table of Content Next >

3. Review of Fatal Crash Data

The Fatality Analysis Reporting System (FARS) is a query-driven database where all vehicle crashes in the United States as recent as 2014 are provided for public access. Vehicle crash fatalities are able to be filtered by a number of different options depending on the thoroughness of crash reporting. The filtered options can then be univariate or cross-tabulated for comparing data. It is important to note that the traffic volume and roadway length are not provided in the FARS database and that full crash rates cannot be calculated or analyzed because the exposure factor cannot be assessed. It is also noteworthy that the FARS data only give information regarding light condition and do not consider visibility treatments associated with retroreflectivity.

These data were considered in the three areas of roadway departure, intersection, and pedestrian and bicycle safety. The data, however, are not consistent across the areas. These differences are summarized below. Additionally, other variables were considered in this analysis and are also listed below.

Safety Data Considered

Roadway Departure

A crash is considered a roadway departure crash when a vehicle leaves the travel lane or lanes by either crossing the shoulder line or the center line of a roadway. It is important to note that the FARS database is not confident in the detailed reports of pedestrian and bicyclist data, including whether the pedestrian/bicyclist was on or adjacent to the roadway when struck, which would also inform roadway departure crashes.

Intersections

Intersections are areas of high conflict, and crashes at intersections can be attributed to a number of different causes. When considering pedestrians and bicyclists at intersections, similar to roadway departure crashes, the details for conflicts involving pedestrian and bicyclist crashes are not included in the FARS database.

Pedestrians/Bicyclists

There is a lack of data regarding conflicts with vehicles and pedestrian/bicyclist fatalities. The FARS database does have a disclaimer that inconsistencies were identified in the pedestrian and bicyclist data. Thus, while some of the data are used for this analysis and the absolute numbers of fatalities provided in the database are said to be accurate, further qualifiers such as motorist, pedestrian, and bicyclist position and maneuvers are not included.

Other Data Variables Considered

Light Condition

In an attempt to find gaps in the research surrounding lighting, the three light conditions made available in the FARS database were used for this research: daylight; dark, not lighted; and dark, lighted. The dark, not lighted and dark, lighted conditions both encompass nighttime driving scenarios; however, one includes artificial infrastructure lighting. Daylight is simply defined by when natural light is present and is not otherwise considered dawn or dusk. Dawn and dusk were not included in this research because it is believed that the reporting of these times of day are objective and apt to be misattributed.

Weather

Weather can impact several factors in a typical driving scenario, not limited to traction or visibility. The conditions predominantly considered were clear (as a baseline), rain, and fog/smog/smoke. Rain is an extremely common weather type and is encountered regularly by most drivers. Snow, sleet, and hail were not as focused in this effort due to the available crash statistics and the variance not accounted for. Snow can be on the roadway or be recently cleared and on the shoulder and still be considered a snowy condition. While snow, sleet, and hail do have an impact on lighting, it is believed to not be far from the effects of rain in general. Fog/smoke/smog are represented well in the FARS database, and these conditions have a very direct and noticeable impact on lighting.

Driver Age

Driver age is an important factor due to the levels of experience, cognitive factors, and visual ability. Younger drivers are perceived to be more risk taking and more inclined to speed, whereas older drivers are believed to have trouble navigating complex segments and intersections and react more slowly to weather or other traffic.

Speed

One of the variables believed to strongly impact all three focus areas is speeding. One-third of all fatalities are reported to be a result of speeding, so speed is seen as a significant threat to safety. Aside from lighting technology that can serve as delineators or overhead roadway smart lighting that can adapt to driver speed and perhaps encourage drivers to slow down, there are few applications in infrastructure design where lighting can serve to curb speeding behaviors. On the other hand, the use of retroreflective infrastructure such as markings, signing, and delineation has some potential to control speed. For instance, peripheral transverse markings have been shown to be a successful countermeasure to speed, particularly in advance of a horizontal curve.(31)

Rural and Urban

Not only do rural and urban roadways naturally distinguish themselves by the purposes they serve, the driver behavior on each may also be considered different. In general, rural roads are higher speed, are less populated, and consume longer stretches. Typically, urban roadways are lower speed, are more traveled, contain more pedestrians and bicyclists, abut varying types of intersections, and are more commonly lit by overhead roadway lighting.

Roadway Departure Breakdowns

Roadway Departures by Rural and Urban by Weather

Clear conditions for 2014 account for nearly 7,000 fatalities on rural roadways and just over 4,500 for urban roadways. Shown in Figure 1, more crashes occur at night for both roadway types, with lighted areas consuming about half of all night crashes. Lighted areas are typically more complex areas or areas in which crashes are common or most likely. Due to this, results are somewhat skewed in their favor; however, data do not show that dark, unlighted areas may warrant lighting to curb the amount of crashes that take place. It is noteworthy that while there are some differences, most likely due to exposure (i.e., fewer rural roads have lighting) in general, the percentages of each of these lighting conditions are generally stable across all of the road types, and the percentages are also fairly evenly divided between the lighting conditions, even though there are typically much lower traffic volumes and exposure during the nighttime.

Figure 1. Chart. Crash Percentages by Road Type and Lighting Conditions for Clear Weather. This chart provides the percentages of crashes by road type and lighting conditions for clear weather. For urban roads, more crashes occur at night; for most rural roads, crashes are about evenly split between day and night. For urban roads, about half of all night crashes are in lighted areas; for rural roads, few night crashes are in lighted areas. Urban local road or street is 39.9 percent for daylight, 23.8 percent for dark and not lighted, and 36.3 percent for dark and lighted. Urban collector is 35.8 percent for daylight, 31.0 percent for dark and not lighted, and 33.2 percent for dark and lighted. Urban minor arterial is 41.7 percent for daylight, 23.0 percent for dark and not lighted, and 31.3 percent for dark and lighted. Urban other principal arterial is 40.2 percent for daylight, 18.3 percent for dark and not lighted, and 41.5 percent for dark and lighted. Urban principal arterial other freeways or expressways… is 40.1 percent for daylight, 22.7 percent for dark and not lighted, and 37.2 percent for dark and lighted. Urban principal arterial interstate is 45.2 percent for daylight, 23.5 percent for dark and not lighted, and 32.3 percent for dark and lighted. Rural local road or street is 49.0 percent for daylight, 47.1 percent for dark and not lighted, and 3.9 percent for dark and lighted. Rural minor collector is 53.3 percent for daylight, 45.5 percent for dark and not lighted, and 1.2 percent for dark and lighted. Rural major collector is 50.2 percent for daylight, 47.0 percent for dark and not lighted, and 2.8 percent for dark and lighted. Rural minor arterial is 51.2 percent for daylight, 46.1 percent for dark and not lighted, and 2.7 percent for dark and lighted. Rural principal arterial other is 55.1 percent for daylight, 39.7 percent for dark and not lighted, and 5.2 percent for dark and lighted. Rural principal arterial interstate is 59.1 percent for daylight, 37.2 percent for dark and not lighted, and 3.7 percent for dark and lighted.

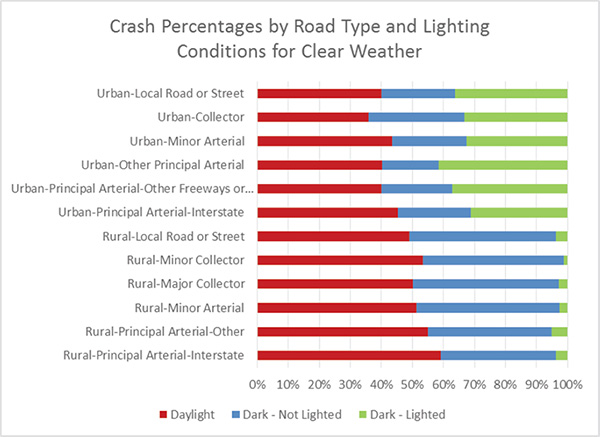
Figure 1. Crash percentages by road type and lighting conditions for clear weather. (FARS Database, 2014)

The rate of crashes in rain conditions is far less, with only 393 occurring on rural roadways and 270 on urban roadways (Figure 2). Despite the greater traffic on urban roadways, rural roadways account for more roadway departure fatalities for both clear and rainy conditions. This is likely due to the fact that less traffic allows drivers to increase their speed and higher speeds allow less opportunities for drivers to safely recover from a roadway departure, which tends to result in more severe crashes. Also, rural areas have much less access to timely emergency services, which increases the fatality rate. The other critical aspect is the change in the percentages for the dark, not lighted condition. While in clear conditions, the percentages were similar on many roadway types, the dark, not lighted condition has a higher percent contribution. This might indicate the importance of retroreflective performance and/or lighting in wet conditions in terms of roadway departure crashes.

Figure 2. Chart. Crash Percentages by Road Type and Lighting Conditions for Rain. This chart provides the percentages of crashes by road type and lighting conditions for rain. More crashes occur at night for most road types. For urban roads, more than half of crashes are in lighted areas for most road types; for rural roads, few night crashes are in lighted areas. Urban local road or street is 32.3 percent for daylight, 19.4 percent for dark and not lighted, and 48.3 percent for dark and lighted. Urban collector is 42.3 percent for daylight, 34.6 percent for dark and not lighted, and 23.1 percent for dark and lighted. Urban minor arterial is 36.2 percent for daylight, 31.9 percent for dark and not lighted, and 31.9 percent for dark and lighted. Urban other principal arterial is 26.2 percent for daylight, 24.6 percent for dark and not lighted, and 49.2 percent for dark and lighted. Urban principal arterial other freeways or expressways… is 43.5 percent for daylight, 26.1 percent for dark and not lighted, and 30.4 percent for dark and lighted. Urban principal arterial interstate is 33.3 percent for daylight, 23.8 percent for dark and not lighted, and 42.9 percent for dark and lighted. Rural local road or street is 28.6 percent for daylight, 61.9 percent for dark and not lighted, and 9.5 percent for dark and lighted. Rural minor collector is 50 percent for daylight, 50 percent for dark and not lighted, and 0 percent for dark and lighted. Rural major collector is 53.9 percent for daylight, 42.2 percent for dark and not lighted, and 3.9 percent for dark and lighted. Rural minor arterial is 50 percent for daylight, 45.1 percent for dark and not lighted, and 4.9 percent for dark and lighted. Rural principal arterial other is 44.9 percent for daylight, 52.6 percent for dark and not lighted, and 2.5 percent for dark and lighted. Rural principal arterial interstate is 57.1 percent for daylight, 36.5 percent for dark and not lighted, and 6.4 percent for dark and lighted.

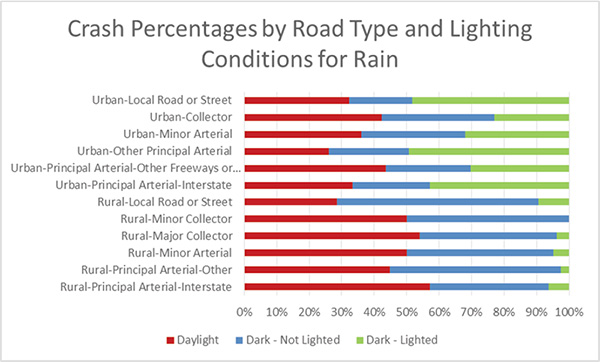
Figure 2. Crash percentages by road type and lighting conditions for rain. (FARS Database, 2014)

Weather Conditions and Roadway Departure

When conditions are clear or rainy, the rates of fatalities across lighting conditions are nearly identical. Figure 3 shows that larger differences exist during times of sleet, hail, snow, fog, and smoke. In general, sleet- or hail-related fatalities are very few, and only 13 total were reported in 2014 for rural and urban roadways combined. Snow-related fatalities occur more commonly in daylight or lit areas of urban roadways, again likely due to exposure. For rural areas, the link is more difficult to assess because snow presence/condition data are less available than they are for urban areas. Ideally, the snow presence/condition data would be more robust and include details on the difference between the presence of snow on a roadway and a scraped and salted roadway, which may not occur as often in some rural areas, and icy roadways as a result of all the above.

Figure 3. Chart. Crash Percentages by Road Type, Lighting Condition, and Weather Conditions. This chart provides the percentages of crashes by weather conditions, and lighting condition for urban versus rural roadways. In urban areas, fog-, smog-, and smoke-related crashes occur most commonly at night. Snow-related crashes occur most commonly in daylight or lit areas of urban areas. Rural crashes, other than those related to fog, smog, or smoke, are almost evenly split between daytime and nighttime. Few crashes in rural areas were in dark and lighted areas. In urban areas, fog, smog, and smoke is 3.1 percent for daylight, 40.6 percent for dark and not lighted, and 56.3 percent for dark and lighted. In urban areas, snow is 53.1 percent for daylight, 16.3 percent for dark and not lighted, and 30.6 percent for dark and lighted. In urban areas, sleet or hail is 22.2 percent for daylight, 55.6 percent for dark and not lighted, and 22.2 percent for dark and lighted. In urban areas, rain is 33.6 percent for daylight, 25.5 percent for dark and not lighted, and 40.9 percent for dark and lighted. In urban areas, clear weather is 41.2 percent for daylight, 23.3 percent for dark and not lighted, and 35.4 percent for dark and lighted. In rural areas, fog, smog, and smoke is 21.5 percent for daylight, 72.0 percent for dark and not lighted, and 6.5 percent for dark and lighted. In rural areas, snow is 50.0 percent for daylight, 45.9 percent for dark and not lighted, and 4.1 percent for dark and lighted. In rural areas, sleet or hail is 45.5 percent for daylight, 54.5 percent for dark and not lighted, and 0 percent for dark and lighted. In rural areas, rain is 46.9 percent for daylight, 48.0 percent for dark and not lighted, and 5.1 percent for dark and lighted. In rural areas, clear weather is 66.4 percent for daylight, 29.3 percent for dark and not lighted, and 4.3 percent for dark and lighted.

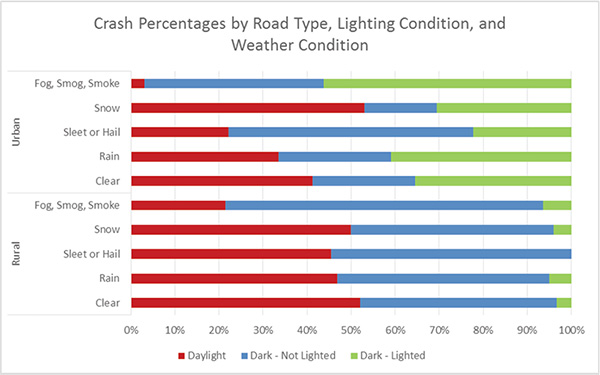
Figure 3. Crash percentages by road type, lighting condition, and weather condition. (FARS Database, 2014)

Age and Roadway Departure

Younger and middle-aged drivers perform similarly in clear and rainy conditions. Older drivers seem to have a higher daytime crash exposure than nighttime exposure. Again, older drivers tend to self-restrict their driving at night, so their exposure, particularly in the rain, is likely lower (Figure 4).

Figure 4. Chart. Crash Percentages by Lighting Condition and Age Group for Clear versus Rain Weather Conditions. This chart provides the percentages of crashes by age group and lighting condition for clear versus rainy weather conditions. Younger and middle-aged drivers perform similarly between clear and rainy conditions. Older drivers have a higher percentage of daytime crashes than nighttime crashes. In rainy conditions, the 56 and older age group is 59.7 percent for daylight, 30.8 percent for dark and not lighted, and 9.5 percent for dark and lighted. In rainy conditions, the 31 to 55 age group is 39.4 percent for daylight, 43.6 percent for dark and not lighted, and 17.0 percent for dark and lighted. In rainy conditions, the 16 to 30 age group is 32.7 percent for daylight, 40.3 percent for dark and not lighted, and 27.0 percent for dark and lighted. In clear conditions, the 56 and older age group is 73.9 percent for daylight, 19.6 percent for dark and not lighted, and 6.5 percent for dark and lighted. In clear conditions, the 31 to 55 age group is 46.2 percent for daylight, 37.9 percent for dark and not lighted, and 15.9 percent for dark and lighted. In clear conditions, the 16 to 30 age group is 34.1 percent for daylight, 43.7 percent for dark and not lighted, and 22.2 percent for dark and lighted.

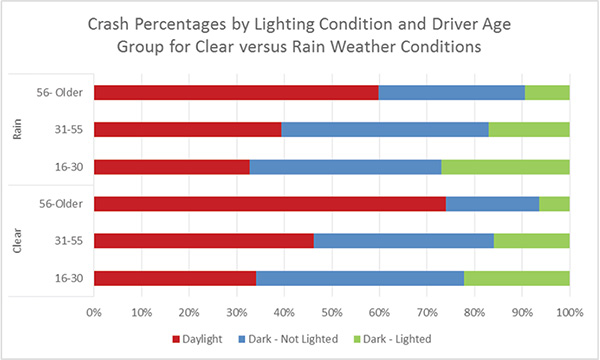
Figure 4. Crash percentages by lighting condition and age group for clear versus rain weather conditions.
(FARS Database, 2014)

Roadway Departure as a Result of Speeding

Because roadway departures are often linked to speeding, it is no surprise that more speeding-related roadway departure fatalities occur at night due to the fact that drivers often out-drive their headlamps. In other words, headlamps span between 250 to 300 ft ahead of the car, and at higher speeds, the reaction time this span creates becomes smaller. The increased number of speed-related fatalities shown in Figure 5 for lighted areas is interesting because it is believed that there are many more unlighted roads and thus more opportunity for roadway departure crashes. However, as already mentioned, lighted roadways are often lighted because the proclivity for crashes is predicted to be higher in those locations.

Figure 5. Chart. Crash Percentages of Speed versus Non-Speeding by Light Condition. This chart provides the percentages of crashes by light condition for speeding versus non-speeding. Daylight conditions have more non-speeding crashes; dark conditions have both crash types almost evenly distributed. In daylight, non-speeding is 64.9 percent, and speeding is 35.1 percent. In dark and not lighted conditions, non-speeding is 55.3 percent, and speeding is 44.7 percent. In dark and lighted conditions, non-speeding is 48.2 percent, and speeding is 51.8 percent.

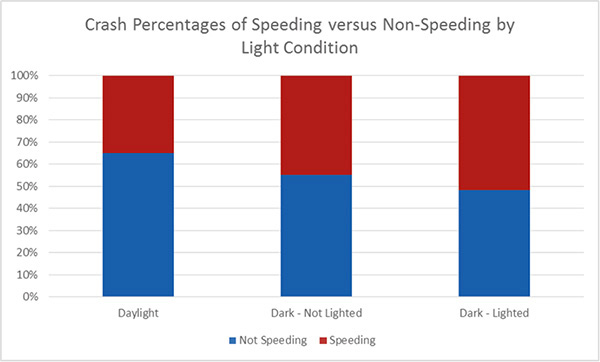
Figure 5. Crash percentages of speeding versus non-speeding by light condition. (FARS Database, 2014)

Intersection Breakdown

Intersection Fatalities by Light Conditions and Intersection Type

Figure 6 shows fatality crash totals for intersections. The percentages for intersections that are not four-way or T-intersections are perhaps too low for making statistical inferences, especially considering that roundabouts and five-point intersections are almost always lighted, so very few dark, not lighted fatalities will occur. The extent to which any of the intersections reflected in these data are lit is unknown. Despite some intersections being lighted already, there may be an opportunity to improve the lighting design. In many regards, the lighting of unique intersections, such as those with five or more points, may need to be considered case by case.

Figure 6. Chart. Crash Percentages by Intersection Type and Lighting Condition. This chart provides the percentages of crashes by intersection type and lighting condition. Roundabouts have the most dark and lighted crashes. Four-way intersection is 61.6 percent for daylight, 10.5 percent for dark and not lighted, and 27.9 percent for dark and lighted. T-intersection is 56.0 percent for daylight, 19.9 percent for dark and not lighted, and 24.1 percent for dark and lighted. Y-intersection is 49.4 percent for daylight, 28.1 percent for dark and not lighted, and 22.5 percent for dark and lighted. Traffic circle is 42.9 percent for daylight, 14.3 percent for dark and not lighted, and 42.9 percent for dark and lighted. Roundabout is 21.4 percent for daylight, 7.1 percent for dark and not lighted, and 71.4 percent for dark and lighted. Five-point or more intersection is 52.5 percent for daylight, 5.0 percent for dark and not lighted, and 42.5 percent for dark and lighted.

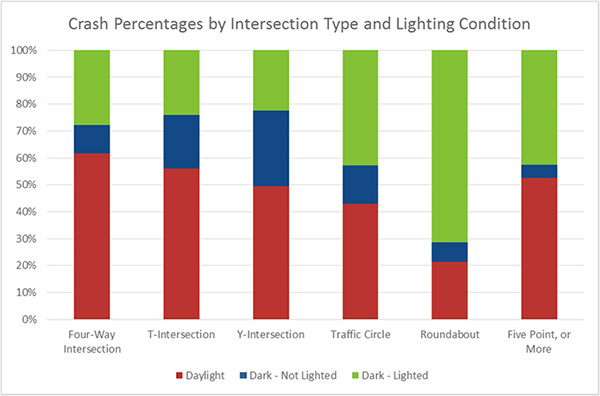
Figure 6. Crash percentages by intersection type and lighting condition. (FARS Database, 2014)

Fatalities at Four-Way Intersections by Age Group

Fatalities at four-way intersections are common among all age groups, with more older drivers being involved in fatal crashes during the daylight when they are likely more inclined to drive. Percentages in dark, unlit sections of road are consistent across all age groups, suggesting that unlit four-way intersections are less common and that age plays a small factor (Figure 7).

Figure 7. Chart. Crash Percentages by Intersection Type and Lighting Condition. This chart provides the percentages of crashes at four-way intersections by age and lighting condition. The 56 and older age group has the most daylight crashes. The 16 to 30 age group is 56.6 percent for daylight, 11.4 percent for dark and not lighted, and 32.0 percent for dark and lighted. The 31 to 55 age group is 65.1 percent for daylight, 10.0 percent for dark and not lighted, and 24.9 percent for dark and lighted. The 56 and older age group is 78.2 percent for daylight, 7.5 percent for dark and not lighted, and 14.3 percent for dark and lighted.

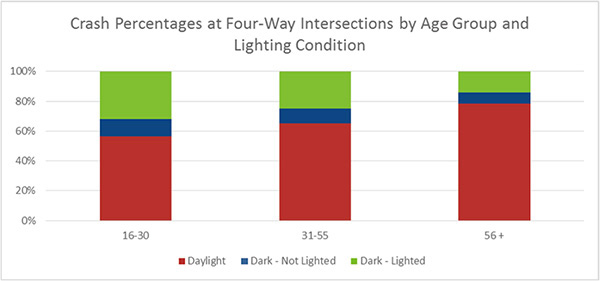
Figure 7. Crash percentages at four-way intersections by age group and lighting condition.
(FARS Database, 2014)

Figure 8 and Table 1 demonstrate the differences in traffic control type by lighting condition. The influence of these data is largely dependent on design and exposure. If the number of pedestrians in an area warrants a pedestrian signal, then it is also likely going to be a lighted area. Areas without a pedestrian signal encounter fewer fatal crashes in general and also fewer at night. Intersections that are controlled only by stop signs or yield signs are not as typically lighted, resulting in a higher rate of dark and unlighted crashes. In general, the data indicate that dark but lighted intersections, which typically encounter more traffic and more pedestrians, may require a research effort to determine opportunities for improved safety.

It is important to note, in Table 1, several traffic control devices (flashing, warning, railroad, school, and unknown) and lighting conditions such as dusk and dawn are not included in these tallies.

Figure 8. Chart. Crash Percentages at Four Way Intersections by Age Group and Lighting Condition. This chart provides the percentages of crashes by intersection type and lighting condition. Daylight conditions have the highest percentage of crashes for all intersection types. Traffic control signal is 71.8 percent for daylight, 10.2 percent for dark and not lighted, and 18.0 percent for dark and lighted. Traffic control signal with pedestrian signal is 55.5 percent for daylight, 2.4 percent for dark and not lighted, and 42.1 percent for dark and lighted. Traffic control signal with pedestrian signal unknown is 58.7 percent for daylight, 5.9 percent for dark and not lighted, and 35.4 percent for dark and lighted. Stop sign is 72.6 percent for daylight, 15.8 percent for dark and not lighted, and 11.6 percent for dark and lighted. Yield sign is 67.0 percent for daylight, 18.4 percent for dark and not lighted, and 14.6 percent for dark and lighted.

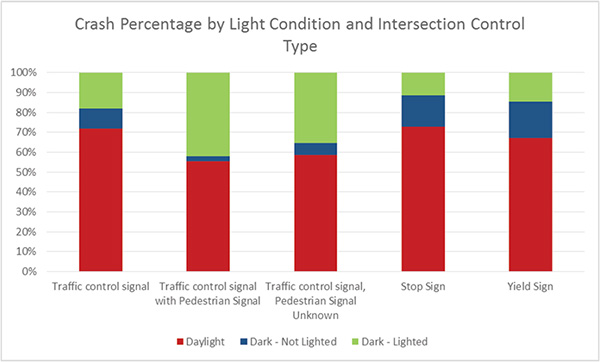
Figure 8. Crash percentage by lighting condition and intersection control type. (FARS Database, 2014)

Table 1. Total Fatal Crashes for Lighting Condition by Traffic Control Type.
Traffic Control Device Daylight Dark—Not Lighted Dark—Lighted
Traffic control signal 275 39 70
Traffic control signal with pedestrian signal 446 20 344
Traffic control signal, pedestrian signal unknown 1,901 194 1,148
Stop sign 1,608 350 258
Yield sign 70 19 17
TOTAL 4,300 622 1,837

Fatalities by Intersection Type and Light Condition for Clear Conditions versus Rain

Figure 9 compares intersection type for weather conditions and shows an increase in the percentage of crashes at unlighted four-way intersections when rain is present. However, it is important to note that there are far fewer reported fatalities in rain conditions compared to clear conditions—5,002 fatalities compared to 372. The change in the percentage when lighting is added is interesting in that there appears to be a potential to reduce fatalities at intersections by adding lighting, in particular for T-intersections.

Figure 9. Chart. Crash Percentages by Lighting Condition and Intersection Type by Weather. This chart provides the percentages of crashes by intersection type, lighting condition, and weather. Crashes at intersections may be reduced by adding lighting, in particular for T-intersections. Roundabouts in clear weather have the greatest percentage of dark and lighted crashes. For clear weather, four-way intersection is 62.8 percent for daylight, 9.6 percent for dark and not lighted, and 27.6 percent for dark and lighted. For clear weather, T-intersection is 56.8 percent for daylight, 20.3 percent for dark and not lighted, and 22.9 percent for dark and lighted. For clear weather, roundabout is 9.1 percent for daylight, 9.1 percent for dark and not lighted, and 81.8 percent for dark and lighted. For rainy conditions, four-way intersection is 40.7 percent for daylight, 17.4 percent for dark and not lighted, and 41.9 percent for dark and lighted. For rainy conditions, T-intersection is 51.9 percent for daylight, 21.4 percent for dark and not lighted, and 26.7 percent for dark and lighted.

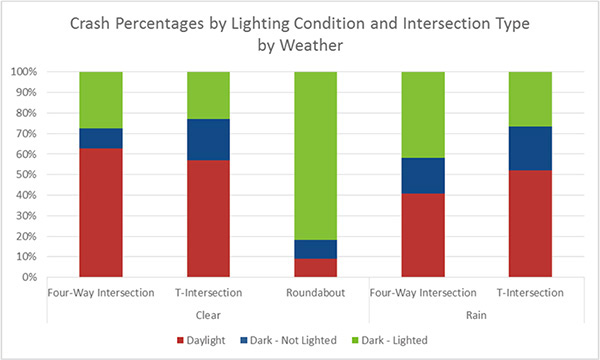
Figure 9. Crash percentages by lighting condition and intersection type by weather. (FARS Database, 2014)

Pedestrian and Bicyclist Safety Data

Pedestrian and Bicyclist Fatalities at Rural Intersection Types

Crash percentages (Figure 10) and total crashes (Figure 11) illustrate the major differences between main intersection types in rural zones. There are far fewer pedestrian- and bicyclist-related fatalities at intersections that are not either T-intersections or four-way intersections based solely on exposure since there is an overwhelmingly greater number of T- and four-way intersections. Interestingly, unlighted T-intersections are associated with more fatalities than other types for other lighting conditions, perhaps indicating a need for better understanding failure points at T-intersections and determining a need for lighting.

Figure 10. Chart. Crash Percentages by Lighting Condition and Intersection Type for Rural Roadways Involving Pedestrians and Bicyclists. This chart provides the percentages of crashes involving pedestrians and bicyclists by lighting condition and intersection type for rural roadways. The majority of crashes are at four-way intersections and T-intersections; few are at Y-intersections and five-point or more intersections. Daylight is 57.6 percent for four-way intersection, 39.4 percent for T-intersection, 1.5 percent for Y-intersection, and 1.5 percent for five-point or more intersection. Dark and not lighted is 43.1 percent for four-way intersection, 52.9 percent for T-intersection, 4.0 percent for Y-intersection, and 0 percent for five-point or more intersection. Dark and lighted is 51.7 percent for four-way intersection, 48.3 percent for T-intersection, 0 percent for Y-intersection, and 0 percent for five-point or more intersection.

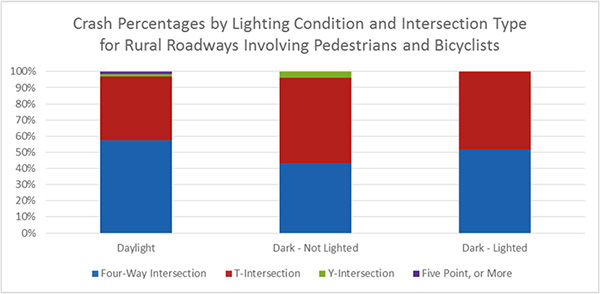
Figure 10. Crash percentages by lighting condition and intersection type for rural roadways involving pedestrians and bicyclists. (FARS Database, 2014)

Figure 11. Chart. Total Fatal Crashes for Lighting Condition by Intersection Type for Rural Roadways Involving Pedestrians and Bicyclists. This chart provides the percentages of fatal crashes involving pedestrians and bicyclists by intersection type and lighting condition for rural roadways. The majority of crashes are at four-way intersections and T-intersections; few are at Y-intersections and five-point or more intersections. Four-way intersection is 50.7 percent for daylight, 29.3 percent for dark and not lighted, and 20.0 percent for dark and lighted. T-intersection is 38.8 percent for daylight, 40.3 percent for dark and not lighted, and 20.9 percent for dark and lighted. Y-intersection is 33.3 percent for daylight, 66.7 percent for dark and not lighted, and 0 percent for dark and lighted. Five-point or more intersection is 100 percent for daylight, 0 percent for dark and not lighted, and 0 percent for dark and lighted.

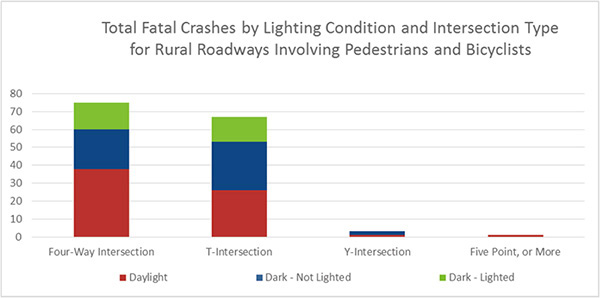
Figure 11. Total fatal crashes by lighting condition and intersection type for rural roadways involving
pedestrians and bicyclists. (FARS Database, 2014)

Pedestrian and Bicyclist Fatalities at Urban Intersection Types

Crash percentages (Figure 12) and total crashes (Figure 13) illustrate the major differences between main intersection types in urban zones. The trends are similar to those of rural roadways; however, the sheer volume of incidents is much greater for urban areas, as is expected. Dark, lighted roadways encounter more fatal crashes involving pedestrians and bicyclists due to the common roadway design of having lighting placed in areas where pedestrian and bicycle traffic is typical.

Figure 12. Chart. Crash Percentages by Lighting Condition and Intersection Type for Urban Roadways Involving Pedestrians and Bicyclists. This chart provides the percentages of crashes involving pedestrians and bicyclists by lighting condition and intersection type for urban roadways. The majority of crashes are at four-way intersections and T-intersections; few are at Y-intersections and five-point or more intersections. Daylight is 70.6 percent for four-way intersection, 27.2 percent for T-intersection, 1.2 percent for Y-intersection, and 1 percent for five-point or more intersection. Dark and not lighted is 55.8 percent for four-way intersection, 41.6 percent for T-intersection, 2.6 percent for Y-intersection, and 0 percent for five-point or more intersection. Dark and lighted is 69.4 percent for four-way intersection, 28.3 percent for T-intersection, 1.5 percent for Y-intersection, and 0.8 percent for five-point or more intersection.

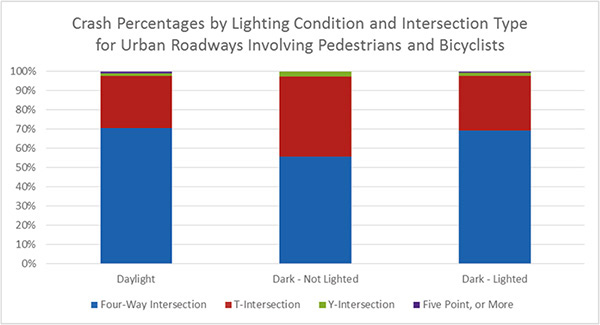
Figure 12. Crash percentages by lighting condition and intersection type for urban roadways involving pedestrians and bicyclists. (FARS Database, 2014)

Figure 13. Chart. Total Fatal Crashes for Lighting Condition by Intersection Type for Urban Roadways Involving Pedestrians and Bicyclists. This chart provides the percentages of fatal crashes involving pedestrians and bicyclists by intersection type and lighting condition for urban roadways. The majority of crashes are at four-way intersections and T-intersections; few are at Y-intersections and five-point or more intersections. Four-way intersection is 39.9 percent for daylight, 12.1 percent for dark and not lighted, and 48.0 percent for dark and lighted. T-intersection is 35.0 percent for daylight, 20.5 percent for dark and not lighted, and 44.5 percent for dark and lighted. Y-intersection is 45.0 percent for daylight, 25.0 percent for dark and not lighted, and 30.0 percent for dark and lighted. Five-point or more intersection is 50.0 percent for daylight, 0 percent for dark and not lighted, and 50.0 percent for dark and lighted.

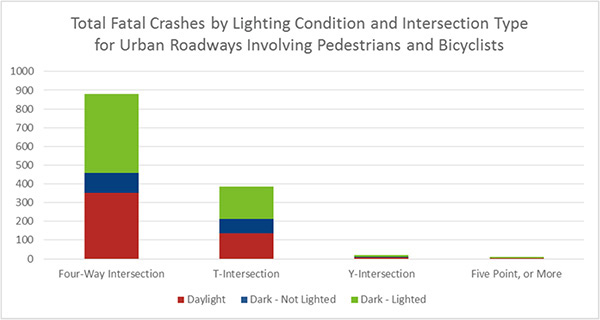
Figure 13. Total fatal crashes by lighting condition and intersection type for urban roadways involving pedestrians and bicyclists. (FARS Database, 2014)

Summary of Fatality Data Review

While the FARS database provides a rich source of information for the potential causes and remedies for fatal crashes, the limitations in the data—in that the actual exposure cannot be calculated—confine the ability to perform a complete analysis of the impact of visibility treatments on fatalities.

There are some initial trends in terms of the impact of lighting that can be seen when considering the fatalities. In terms of roadway departures, there seems to be an impact of lighting in bad weather. Similarly, in terms of the intersections, there is the potential to reduce fatalities at T intersections with the addition of lighting. There may be many other trends in the data, but they are likely hidden by the crash exposure rate.

One of the primary findings in the data is that there is a significant need to perform a complete and proper analysis of visibility treatments in terms of safety that accounts for exposure, retroreflectivity, and all roadway geometry impacts.

 < Previous Table of Content Next >
Page last modified on April 5, 2017
Safe Roads for a Safer Future - Investment in roadway safety saves lives
Federal Highway Administration | 1200 New Jersey Avenue, SE | Washington, DC 20590 | 202-366-4000