U.S. Department of Transportation
Federal Highway Administration
1200 New Jersey Avenue, SE
Washington, DC 20590
202-366-4000
Installing HFST at a few experimental locations, or spot treatments, is a valid approach as agencies test the usefulness and application of the treatment. Some States use the spot treatment approach on a large scale, consolidating multiple application locations under one contract. Other States systemically implement HFST by incorporating the treatment in agency-wide HFST initiatives, and some promote the treatment through Road Safety Audits (RSA), Roadway Departure Safety Implementation (RwD) Plans, or in Highway Safety Improvement Program (HSIP) guidelines. Implementing HFST systemically can:
Some agencies maintain a horizontal curve inventory, helping to reduce the time and resources needed to identify potential HFST sites. The inventory allows staff to overlay crashes at horizontal curve locations during crash analysis, and sync with other known horizontal curve criteria, such as superelevation, posted and advisory speeds, existing signing, etc. This speeds up the analysis process by removing an extra step as well as alleviating an initial field evaluation, in some cases.
Many States find it useful to include both safety and materials staff as the agency identifies potential locations for HFST implementation. The main criteria most States consider when choosing sites for HFST include whether the curve location exhibits:
High Crash Frequency (e.g., wet, RwD, severity);
Within the context of FHWA's Systemic Safety Project Selection Tool, which is described in more detail in Section 1.6, these criteria would represent the risk characteristics used to identify and prioritize curve locations for HFST.
Collecting information in these areas can help indicate HFST's potential to be effective at a horizontal curve. Many States found that following a data-driven process and collecting data in these areas was essential for HFST location identification. The sections within this chapter will discuss each of these criteria in greater detail.
The primary reason for implementing HFST is to avoid future crashes. To maximize the actual return on investment, HSFT should be applied at locations with the greatest potential to avoid the largest number of future crashes. High crash frequency is one means of estimating the frequency of future crashes that may be expected at a given location. The Highway Safety Manual, published in 2010 by the American Association of State Highway and Transportation Officials, describes limitations of relying solely on recent crash history to identify locations where treatments can be expected to have the potential to avoid the greatest number of future crashes. These limitations include the natural variability in crash frequency, regression-to-the mean bias, and changes in roadway characteristics over time. The Highway Safety Manual provides predictive methods that address these limitations through safety performance functions and Empirical-Bayes weighting of observed crash frequencies and safety performance function estimates.
Until they implement these predictive methods, many agencies evaluate horizontal curves for safety countermeasures when they exhibit a high frequency of crashes. Some States set a threshold crash frequency, above which the curve is automatically recommended for potential countermeasure development. For instance, Tennessee Department of Transportation (TDOT) performs a safety assessment on each horizontal curve that has four or more total crashes within a 3-year period.6
Other agencies use a ranking system by developing a list of locations that exhibit a significantly high concentration of collisions. They investigate the highest ranked locations on the lists, develop a list of potential countermeasures for each location, and select as many locations as possible for treatment based on funding availability.
When selecting locations for HFST, some agencies not only look at the total crash frequency, but also at wet- crash frequency, RwD crash frequency, and crash severity (i.e., fatal or serious injuries). For each crash, they examine the crash report narrative to determine the cause of the crash and to pinpoint the crashes' exact location within the curve. As crashes may occur or be recorded as happening before or after the horizontal curve, it is important to verify the location of the crashes in order to determine whether each crash belongs in the data set.
Wet pavement conditions can lower the available pavement friction drastically, particularly if the pavement has been polished by high friction demand. HFST is an ideal countermeasure for these conditions because it can improve pavement friction values up to 300 percent. Some agencies focus heavily on wet crashes as a HFST implementation criteria and annually identify locations that experience a high frequency of wet crashes year after year.
The process by which agencies select wet crash curve locations for potential HFST implementation varies. For example, agencies may develop a list of locations that have experienced a specified number of wet crashes within:
For wet crashes, agencies may even normalize the yearly wet crash frequency by historical percent wet-time values obtained per location, to understand the over-representation of wet crashes for locations that are either particularly wet or dry.
HFST is effective at combating RwD crashes on horizontal curves and, as a result, many agencies use HFST to target RwD crashes on horizontal curves by incorporating them into their Statewide RwD Safety Implementation Plan (RwDIP). In 2009, the Kentucky Transportation Cabinet (KYTC) was one of the first States to begin this process. Their RwDIP included a data analysis process that resulted in identifying 159 sections that had the potential to benefit from HFST. They selected to treat the 30 highest RwD crash locations that had a wet/dry crash ratio greater than 50 percent.
A benefit of HFST compared to other curve-related RwD countermeasures (e.g., edge line or shoulder rumble strips, edge line pavement markings, horizontal curve delineation, etc.) is that HFST does not depend on the driver to recognize the information associated with delineation or noise/vibration and make corrections. Rather, HFST interacts directly with the vehicle, independent of the driver's awareness, by providing the necessary friction needed to keep the vehicle on the roadway.
While some agencies prioritize improvement locations by the frequency and severity of crashes, it is also important to capture where frequent non-severe or property-damage-only (PDO) crashes occur. These less severe crashes may be predictors of future serious injury or fatal crashes, if left untreated.
Many agencies use a weighted scale to assign either numeric or monetary values to each crash severity level, in order to capture instances where frequent, less severe crashes may accumulate to a situation that requires addressing. FHWA's Highway Safety Improvement Program Manual provides monetarily values to an injury level scale (the KABCO scale).
By using the KABCO scale, or similar, agencies may be able to identify a threshold at which horizontal curves with few fatalities or serious injuries but frequent, less severe crashes can be identified and treated.
Studies have shown that doubling pavement surface friction reduces crash frequency by half by providing a large margin of error for the drivers to compensate for their mistakes (e.g., driving too fast for conditions).7 HFST can as much as triple existing pavement friction values. Thus, many States use friction values to identify curves that will benefit the most from HFST.
Pennsylvania Department of Transportation (PennDOT) uses a Skid Trailer to collect pavement friction values on curves both before and after HFST implementation, even though the instrument's main purpose is testing pavement friction on tangential section. PennDOT has found that HFST implementation provides friction values of 60+ after multiple years; whereas, a normal pavement overlay, such as micro-surfacing, has friction values of 50-55 that can reduce to the 40s within a few years.8
At one location in Pennsylvania, HFST tripled the existing pavement friction after it was applied on a curve that had an average friction/skid value of 24. After HFST implementation, the average friction/skid value increased to 75. Three years later, the average had only decreased to 71. The location experienced 21 crashes over the 8 years before HFST was implemented and no crashes for a period of five years after implementation.
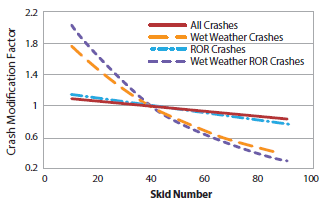
A study by Texas Transportation Institute (TTI) quantifies the increase in crash likelihood due to decreased friction values.9 The study involved development of a crash modification factor (CMF) for skid numbers on two-lane rural highway horizontal curves. The study set the CMF equal to 1 for a skid number of 40. This value is not an indication that a skid number of 40 is a universal average, but rather a nominal base condition. The study found that as pavement friction increases, crash likelihood decreases, particularly for wet weather crashes. The results of the study are summarized in Figure 2.
Figure 2. Skid Number CMF.
Even though some agencies assess pavement friction when considering HFST, they do not routinely collect or publish pavement friction measurements. Instead, agencies typically collect pavement friction values after site identification in order to verify and support the need for HFST. A few State DOTs systemically collect and archive pavement friction measurements in order to speed up the curve identification process.
HFST Lifespan
Just like pavement performance, HFST's wear is dependent on many factors such as initial construction quality, friction demand, choice of aggregate and binder, and traffic volume as well as the severity of the climate and the weight and number of heavy truck axles. Vendors have reported life spans from 5 to 8 years for locations with 15,000 vehicles per day, and up to 5 years with location having 50,000 vehicles per day.
Most agencies examine existing pavement and base quality when determining whether or not HFST can be used at a specific site. HFST is not intended as a repair for rutting or heaving and will not level pavements, although minor rutting or heaving is acceptable for HFST application.10 Oregon Department of Transportation requires an existing pavement condition rating of Good or better prior to placing HFST.11 Pavement deterioration, uneven joints, rutting, and cracks greater than ¼ inch in width and depth must be repaired at least 30 days prior to HFST installation. It is suggested that agencies not place HFST on pavement with known structural issues, or else structural pavement rehabilitation may be needed before HFST's full lifespan is realized, thereby reducing HFST's cost-effectiveness.
If a corridor repaving project is planned in the near future, some agencies choose to wait to implement HFST on the corridor's curves until 30 days after the repaving project is complete.12 While the new pavement inherently improves roadway friction, studies have shown that standard pavement friction values quickly reduce after a few years. HFST provides greater initial and lasting friction values than new pavement and is used by some States as an enhanced friction improvement at spot locations after corridor repaving.
On horizontal curves, a speed differential can be defined as the difference between the tangential posted speed limit and the curve advisory speed.13 This measurement can sometimes be a good indicator of the usefulness of a HFST treatment. Larger speed differentials directly correspond to greater vehicle deceleration when entering the curve. If motorists do not decelerate to the curve advisory speed and/or if wet weather or low pavement friction conditions are present then the vehicle has an increased likelihood of exceeding the available pavement friction and resulting in a RwD crash. Installing HFST can provide additional friction that allows motorists to break and navigate successfully without losing control.
Advisory speed is often set based on several factors, including the speed at which motorists feel comfortable traversing the curve, which is partially determined by the curve's radius, superelevation, and sometimes vertical grade. Typically, the smaller the curve radius and/or larger the superelevation variance (actual superelevation compared to design speed superelevation), then the lower the advisory speed, resulting in a larger speed differential compared to the posted speed limit.
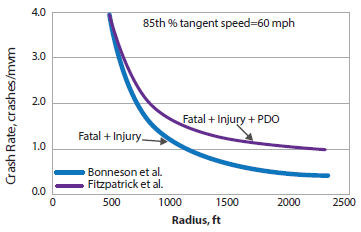
Studies have linked curve radii to crash likelihood. Figure 3 illustrates that as curve radius decreases, the crash rate increases. Since a smaller curve radius corresponds to a lower advisory speed and a greater speed differential, radius and speed differential can be deductively linked in many cases.
Figure 3. Curve Crash Rate as a Function of Radius.14
Many agencies consider the curve's speed differential – the difference between the posted speed and the curve advisory speed – when determining whether to use HFST. A greater speed differential causes vehicles to experience greater tangential and lateral accelerations if they do not heed the curve advisory speed. When coupled with low friction values brought on by polished pavement or wet weather conditions, these instances can have an even greater effect on severe curves. HFST can counteract loss of control when high friction demand from increased tangential and lateral forces exceeds normally available pavement friction. A curve's speed differential is typically not the main evaluation criteria when considering HFST, but rather another indication that HFST may be effective at certain locations.
Typically, agencies first employ low-cost horizontal curve safety improvements that can be implemented immediately as a "quick fix" before progressing to a more expensive countermeasure. These may include:
Signs, pavement markings, and delineation require drivers to perceive and then react to the need to slow down. Guardrails help mitigate the severity of a crash once a driver has lost control but it does not prevent the crash. If these countermeasures do not reduce crashes sufficiently, HFST may be the next likely alternative. HFST requires the driver to neither perceive nor react to a lost-control situation, rather it acts on the vehicle without involving the driver whatsoever, providing a hidden advantage.
For agencies with more sophisticated data analysis capabilities and good roadway inventory, the systemic approach for selecting curves for HFST installation should be considered. The following provides a general description of the Systemic Approach to Safety and provides links for resources with more details. The process may or may not lead to selecting HFST as the recommended safety countermeasure.
The Systemic Approach to Safety involves widely implementing low-cost safety improvements based on high-risk roadway features correlated with specific severe crash types. The approach provides a more comprehensive method for safety planning and implementation that supplements and complements traditional site analysis. The approach helps agencies broaden their traffic safety efforts and consider risk as well as crash history when identifying where to make low-cost safety improvements.
The Systemic Approach does not replace the need to focus on individual locations with high numbers of severe crashes; instead it provides an expanded comprehensive and proactive approach to road safety efforts. Agencies can use the Systemic Approach to address the requirements for the Highway Safety Improvement Program, which focuses on fatal and serious injury crashes on ALL public roads.
The key to the systemic approach is evaluating an entire system using a defined set of criteria, which results in an inferred prioritization that indicates some elements of the system are better candidates for safety investment than others.
Just as specific processes for conducting site analysis vary widely, the Systemic Approach used by individual agencies will vary. Some of the challenges include the following:
More information on the Systemic Approach to Safety is available at the following resources:
6 Interview with Brian Hurst, Danny Lane, and Matt Givens, Tennessee Department of Transportation, conducted on December 9, 2014. [ Return to note 6. ]
7 FHWA's High Friction Surface Treatments Frequently Asked Questions. Publication No. FHWA-CAI-14-019. [ Return to note 7. ]
8 Interview with Gary Modi, Pennsylvania Department of Transportation, conducted on January 20, 2015. [ Return to note 8. ]
9 Pratt, M.P., S.R. Geedipally, A.M. Pike, P.J. Carlson, A.M. Celoza, and D. Lord, Evaluation Need for Surface Treatments to Reduce Crash Frequency on Horizontal Curves, Figure 24. May 2014. [ Return to note 9. ]
10 FHWA's High Friction Surface Treatments Frequently Asked Questions. Publication No. FHWA-CAI-14-019. [ Return to note 10. ]
11 Oregon Department of Transportation, GFP Pavement Condition Rating Manual. July 2010. Available at: http://www.oregon.gov/odot/hwy/construction/docs/pavement/gfp_manual.pdf [ Return to note 11. ]
12 FHWA's High Friction Surface Treatments Frequently Asked Questions. Publication No. FHWA-CAI-14-019. [ Return to note 12. ]
13 B. Brimley and P. Carlson, Using High Friction Surface Treatments to Improve Safety at Horizontal Curves. July 2012. Available at: http://d2dtl5nnlpfr0r.cloudfront.net/tti.tamu.edu/documents/T TI-2012-8.pdf. [ Return to note 13. ]
14 Bonneson, J, M. Pratt, J. Miles, and P. Carlson. Development of Guidelines for Establishing Effective Curve Advisory Speeds, Figure 2-4. FHWA/TX-07/0-5439 1. Texas Department of Transportation, Austin, Texas, 2007. [ Return to note 14. ]
15 FHWA Systemic Approach to Safety website, available at: http://safety.fhwa.dot.gov/systemic/index.cfm. [ Return to note 15. ]
16 FHWA Systemic Safety Project Selection Tool, available at: http://safety.fhwa.dot.gov/systemic/fhwasa13019/. [ Return to note 16. ]
| < Previous | Table of Contents | Next > |

