U.S. Department of Transportation
Federal Highway Administration
1200 New Jersey Avenue, SE
Washington, DC 20590
202-366-4000


Skip to content
Facebook iconYouTube iconTwitter iconFlickr iconLinkedInInstagram

Safety

FHWA Home / Safety / Roadway Departure / Roadway Departure Strategic Plan

Roadway Departure Strategic Plan

Printable Version [PDF, 1.27 MB]

Graphic titled, “United State Fatalities by FHWA Focus Area Average 2016-2018”. Beneath the title are two pie charts. The pie chart on the left is divided into five pieces. The largest piece is, “Roadway Departure Only Crashes”, which is 46%. The second largest piece is, “Intersection Only Crashes”, which is 18%. The third largest piece is, “Crashes not involving a Focus Area”, which is 13%. The fourth largest piece is, “Pedestrian/Bicycle Only Crashes”, which is 12%, and the fifth, and smallest piece, is, “Multiple Focus Areas”, which is 11%. The Multiple Focus Areas piece is separated out from the pie and connects to a rectangle with a pie that is split into the four pieces that make up Multiple Focus Areas. The largest piece is, “Intersections and Pedestrian/Bicycles”, which is 5.6%. The second largest piece is, “Intersections and Roadway Departures”, which is 4.1%. The third largest piece is, “Roadway Departures and Pedestrian/Bicycles”, which is 1.4%, and the fourth piece, which is the smallest piece, is, “All Focus Areas”, which is 0.2%. In the bottom-left corner is text, “Source: FARS, FHWA definitions available at safety.fhwa.dot.gov/fas, Note: The total in the secondary pie chart does not exactly add up to 11% due to rounding.

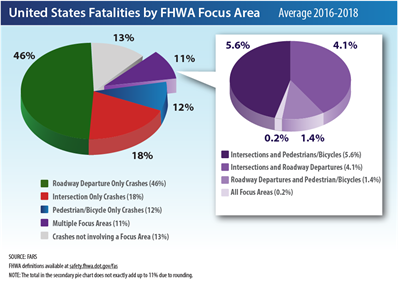
Each year Roadway Departures account for over half of all traffic fatalities in the United States. The Federal Highway Administration (FHWA) Roadway Departure (RwD) Team developed this Strategic Plan to provide a common vision for research, policy, and implementation to address these crashes.

The FHWA Roadway Departure Vision, Mission, and Goal

Vision

Pursue a proactive approach to addressing lane departure crashes on the Road to Zero.

Mission

Exercise leadership in the highway community to reduce the risk of RwD-related fatalities and serious injuries. The FHWA’s primary leadership role is with the engineering community and aims to assist transportation agencies to achieve their RwD-related SHSP goals through:

Goal

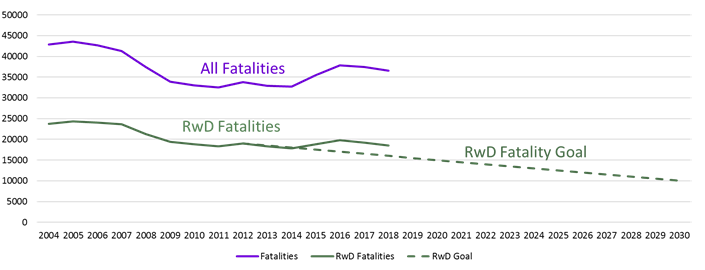
Reduce annual average national RwD fatalities to 10,000 by the year 2030. The FHWA RwD Team will pursue this goal by influencing both internal and external partners to plan strategically, implement RwD countermeasures systemically based on data, and promote safety performance in all facets of transportation decision-making.

Graph with an x-axis ranging from 2004 to 2030 in increments of 1 year and a y-axis ranging from 0 to 50,000 in increments of 5,000. Three trends are mapped on the graph. The first is All Fatalities. The All Fatalities line begins at 43,000 in 2004, drops to 33,000 in 2011, rises up to 34,000 in 2012, drops back down to 33,000 in 2014, increases up to 37,000 in 2016, and then decreases and ends at 36,000 in 2018. The RwD Fatalities line follows a similar trend of the All Fatalities line, however it begins at 24,000 in 2004, drops down to 18,000 in 2011, increases up to 19,000 in 2012, decreases down to 18,000 in 2014, increases back up to 19,750 in 2016, and then decreases and ends at 19,000 in 2018. The Fatality Goal Line is a dashed line that begins at 19,000 in 2012 and then decreases by 500 crashes per year until the line reaches 10,000 in 2030.

The Role of the Roadway Departure Strategic Plan

Pie chart titled, “RwD Fatalities by Most Harmful Event (FARS 2016 – 2018 average annual)”. The pie chart is divided into eight pieces. The largest piece is, “Head-On”, which is 27%. The second largest piece is, “Rollover”, which is 25%. The third largest piece is, “Trees”, which is 19%. The fourth largest piece is, “Other”, which is 9%. There are two pieces that are the fourth largest—"Posts & Poles” and “Other Fixed Objects”—which are both 6%. The fifth largest piece is, “Barriers”, which is 5%. The sixth, and smallest piece, is, “Other Roadside”, which is 4%. Head-On, Rollover, and Trees are labeled, “Primary Emphasis Areas”. Posts & Poles, Barriers, Other Fixed Object, and Other Roadside are labeled, “Secondary Emphasis Area”.

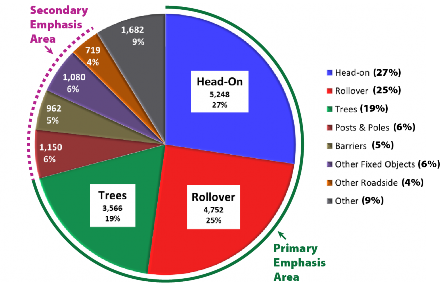
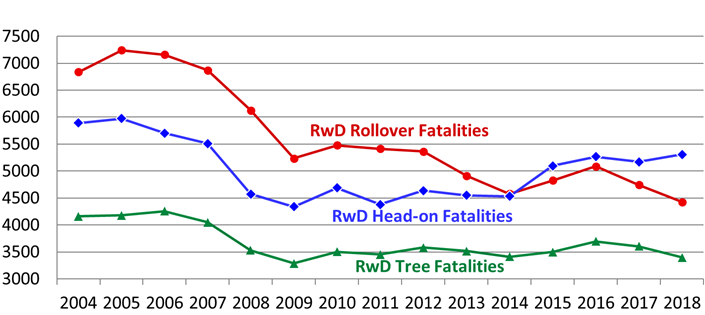
This Strategic Plan primarily serves as a tool to provide long-term focus for the FHWA RwD Team efforts using a data-driven approach. The FHWA defines RwD Crashes as those in which a vehicle crosses an edge line, a center line, or otherwise leaves the traveled way (also called lane departure by AASHTO). When considering the most harmful event in RwD fatalities, three crash types make up over 70 percent of the crashes. These three, head-on collisions, rollovers, and trees, are the primary emphasis of this strategic plan. Secondary emphasis is placed on reducing crashes with other fixed objects, including signs, poles, signals, and barriers as well as crashes involving roadside ditches and embankments. Some headway has been made in reducing the severity of rollover crashes as shown below.


Defining Roadway Departure Crashes (aka Lane Departure):
"A crash in which a vehicle crosses an edge line, a center line, or otherwise leaves the traveled way.

RwD Emphasis Area Fatality Trends

raph titled, “RwD Emphasis Area Fatality Trends”. The x-axis ranges from 2004 to 2018 and increases in increments of 1 year. The y-axis ranges from 3,000 to 7,500 and increases in 500. There are three lines on the graph: “RwD Rollover Fatalities”, “RwD Head-On Fatalities”, and “RwD Tree Fatalities”. The RwD Rollover Fatalities line begins at 6,700 in 2004, decreases down to 5,300 in 2009, increases to 5,500 in 2010, decreases down to 4,500 in 2014, increases up to 5,050 in 2016, and decreases and ends at 4,450 in 2018. The RwD Head-on Fatalities line begins at 5,900 in 2004, increases to 6,000 in 2005, decreases to 4,400 in 2009, increases to 4,600 in 2011, decreases to 4,400 in 2011, increases to 5,050 in 2015, and increases and ends at 5,400 in 2018. The RwD Tree Fatalities line begins at 4,100 in 2004, increases to 4,300 in 2006, decreases to 3,400 in 2009, increases to 3,550 in 2012, decreases to 3,450 in 2014, increases to 3,600 in 2016, and decreases and ends at 3,450 in 2018.

Internal Efforts

The RwD Team includes core members from three safety units within FHWA, each of which provide support and resources to Division Offices. Each of these units and the Divisions fulfill varying needs in FHWA’s efforts to reduce RwD fatalities. The primary roles of each follow.

The RwD Team uses an integrated roadmap process to specify short-term and mid-term efforts to achieve the goals of the Strategic Plan. It is reviewed and updated annually. Efforts in the RwD Roadmap include projects aligned under three objectives:

  1. Keep vehicles on the roadway and in their directional lane,
  2. Reduce the potential for crashes when vehicles leave their lane or the roadway, and
  3. Minimize the severity when roadway departure crashes occur.

The RwD Roadmap also includes projects in RwD analysis, research and outreach that span all three objectives. Because the roadmap process is integrated, there are teams considering projects for each primary emphasis area that coordinate with other headquarter, research and field offices within FHWA and other DOT agencies to gain technical and policy knowledge in planning and implementation.

Influence on External Efforts

Roadway Departure Head-On Collisions

Graphic of two vehicles colliding in a head-on crash.
Credit: skalapendra/iStock/Thinkstock

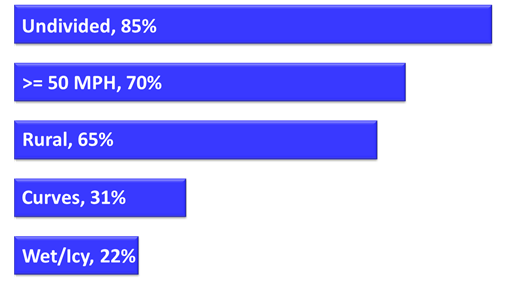
RwDs involving cross center line or cross median events that resulted in vehicle collisions were the most harmful event in 27 percent of RwD fatalities. Since 85 percent of these head-on roadway departure fatalities are on undivided roadways, a major focus of this primary emphasis area is addressing cross-centerline crashes and with less weight placed on cross median issues. Additional research and development of countermeasures for undivided highways will continue to be a focus for the foreseeable future. Crash data also indicates that the focus should remain on high-speed roadways, with more emphasis in rural areas while not ignoring urban areas. Detailed analysis found that in rural areas, the non-interstate freeways and expressways are significantly over-represented for this crash type, and other principal arterials and minor arterials are also somewhat over-represented compared to all roadway departures and all crashes.

Curves are only slightly over-represented for head-on roadway departures compared to all crashes, indicating focus should be on both tangents and curves. Detailed analysis showed that a common issue in urban areas is head-on lane departures due to drivers cutting to the inside of the curve, across the center line, while in rural areas these head-on crashes were in over-represented in tangent sections. Detailed analysis showed that while lane departures are only slightly over-represented in wet, snowy, and icy conditions, this is more of an issue in rural areas.

RwD Head-on Fatalities as percent of all RwD Fatalities
(FARS 2016 - 2018 average annual)

Graph titled, “RwD Head-on Fatalities as percent of all RwD Fatalities (FARS 2016-2018 average annual)”. Four stacked horizontal bars. From top to bottom the bars are labeled, “Undivided, 85%; >=50 MPH, 70%; Rural, 65%; Curves, 31%; and Wet/Icy, 22%”.

Strategies to keep vehicles in their lane to prevent head-on collisions include installation of:

Strategies to reduce the potential for head-on collisions when vehicles do leave their lanes include application of:

Strategies to minimize the severity of roadway departures into opposing traffic lanes include appropriate:

Roadway Departure Rollovers

Graphic of an overturned vehicle. There is a graphic of the right tire missing and resting next to the vehicle.
Credit: skalapendra/iStock/Thinkstock

The most harmful event in 26 percent of fatalities resulting from a roadway departure is a rollover. Approximately three-quarters of these fatal crashes occur in rural areas and 72 percent are where posted speed limits are at or above 50 mph. While these crashes have been reduced slightly in recent years in tangent sections, they continue to be significantly over-represented in curves. Detailed analysis found that rollovers are problematic both in curves in either direction for the vehicle, although they do happen somewhat more frequently on the outside of the curve. As with all crashes, the majority occur in dry pavement conditions. These fatalities are also somewhat over-represented on rural two-way undivided roads, especially collectors and local roads.


RwD Rollover Fatalities as percent of all RwD Fatalities (FARS 2016 – 2018 average annual)

Graph titled, “RwD Rollover Fatalities as percent of all RwD Fatalities (FARS 2016 – 2018 average annual)”. Three stacked horizontal bars. From top to bottom the bars are labeled, “Rural Areas, 72%; >= 50 MPH, 73%; and Curves, 43%”.

Strategies to keep vehicles on the roadway to prevent rollovers include installation of:

Strategies to reduce the potential for rollovers when vehicles do leave the roadway include application of:

Strategies to minimize the severity of roadway departures by reducing the potential for rollovers include appropriate specifications and installation of:

Tree Crashes

Graphic of a vehicle colliding head-on with a tree.
Credit: skalapendra/iStock/Thinkstock

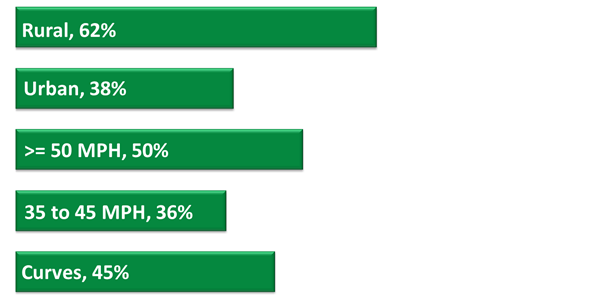
The most harmful event in 19 percent of RwD fatalities involves trees or shrubs on the roadside. A continued emphasis on removing or otherwise addressing these roadside obstacles and maintaining the clear zone is in order. The crash data indicate the need to address this on high- and medium-speed roadways in both rural and urban areas, to meet the RwD goals. Trees are unique from other fixed objects in that (with some exceptions) they are not “installed”. In addition, they present a greater hazard the larger they grow, and they multiply over time, encroaching ever closer to the roadway if maintenance is not addressed. While context is important to roadside designs, trees have not been proven to slow traffic. Detailed analysis indicates that in rural areas these fatalities are somewhat over-represented in wet and icy conditions. Since tree crashes are particularly over-represented in curves, agencies can initially focus clearing efforts on the outside of curves and consider if they are applying the recommendations of the AASHTO Roadside Design Guide to apply wider clear zone on the outside of curves.


RwD Tree Fatalities as percent of all RwD Fatalities
(FARS 2016 – 2018 average annual)

Graph titled, “RwD Rollover Fatalities as percent of all RwD Fatalities (FARS 2016 -2018 average annual)”. Five stacked horizontal bars. From top to bottom the bars are labeled, “Rural, 62%; Urban, 38%; >= 50 MPH, 50%; 35 to 45 MPH, 36%; and Curves, 45%”.

Strategies to keep vehicles on the roadway to prevent tree crashes include installation of:

Strategies to reduce the potential for collisions with trees when vehicles do leave the roadway include application of:

Strategies to minimize the severity of roadway departures by reducing the potential for tree crashes include appropriate specifications and installation regarding:

FHWA Roadway Departure Team Action Items within the Next Five Years

Objective 1: Keep vehicles on the roadway, in their appropriate directional lane.

  1. Continue to promote and provide training on retroreflectivity, lighting design, curve signing, HFST, and rumble strips.
  2. Develop materials to assist local agencies with systemic analysis and application of RwD countermeasures, particularly curve signing, pavement markings, HFST and rumble strips.
  3. Encourage transportation agencies to develop safety action plans to identify and prioritize RwD countermeasure implementation.
  4. Evaluate the effectiveness of newer delineation practices for reducing curve crashes.
  5. Demonstrate Continuous Friction Measurement tools for testing and screening pavement friction.
  6. Develop an installation checklist for HFST and improved methods for testing HFST materials.
  7. Evaluate sinusoidal rumble strips and develop recommendations for where to use instead of conventional designs.

Objective 2: Reduce the potential for crashes when vehicles leave their lane or the roadway. 

  1. Continue to promote and provide training on clear zones and SafetyEdgeSM.
  2. Promote best practices and develop case studies of clear zones practices that reduce rollover potential.1
  3. Encourage wider implementation of SafetyEdgeSM, particularly to local agencies.
  4. Promote experimentation and evaluation of increased separation between opposing traffic on undivided highways.
  5. Evaluate the effectiveness of removing trees and other fixed objects in curves, including maintenance practices such as mowing and clearing.
  6. Develop joint guidelines with the Office of Planning, Environment, and Realty for landscaping clear zones, and encourage States to adopt and implement them.
  7. Evaluate effectiveness of the delineation for addressing objects in the clear zone.

Objective 3: Minimize the severity of crashes that do occur.

  1. Continue to promote and provide training on designing and installing hardware
  2. Assist transportation agencies in updating their standards and policies.
  3. Continue to provide national eligibility determinations for hardware systems until an alternative national process is developed.
  4. Assist transportation agencies in development of multi-State or national In-Service Performance Evaluations.
  5. Develop, improve, and utilize finite element models of vehicles, hardware, and roadside to aid in RwD research, which will explore potential benefits and develop guidance for strategically recognized issues.
  6. Develop guidance for tradeoffs to reduce rollovers, especially on curves, using various slope shapes and various types of barriers.
  7. Develop case studies and data-driven guidance on the use of barrier on previously undivided roads.
  8. Explore the trade-offs of performance and maintenance issues for barrier in narrow medians.

1 NCHRP Report 911, Guidelines for Traversability of Roadside Slopes, 2019.

Logo: Safety Logo: FHWA
Page last modified on December 3, 2021
Safe Roads for a Safer Future - Investment in roadway safety saves lives
Federal Highway Administration | 1200 New Jersey Avenue, SE | Washington, DC 20590 | 202-366-4000