U.S. Department of Transportation
Federal Highway Administration
1200 New Jersey Avenue, SE
Washington, DC 20590
202-366-4000
This section presents the results of the ten CDIPs conducted between December, 2010 and May, 2013. Figure 2 shows the States that have participated in a CDIP during this period.
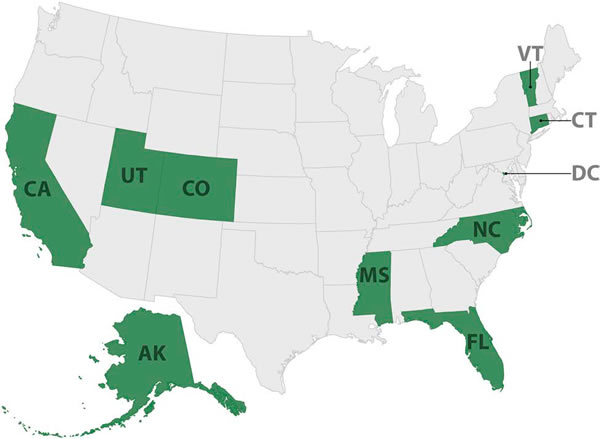
Figure 2: CDIP States 2010-2013.
Since 2010, the following ten States have participated in a CDIP:
At the end of Day 1, participants in four of the 10 States completed an evaluation form. The form is divided into segments to match the portions of the CDIP Workshop, as follows:
Participants rated each segment using a five point scale (five being the best) on each of the following five dimensions:
The form also included space for comments on each segment and overall for the entire Day 1 program.
Fifty-nine participants completed an evaluation. The results of the evaluations show that participants generally rated the CDIP Day 1 program highly. Figure 3 shows the overall distribution of scores for each of the five dimensions and overall for the entire program. Each set of five bars (corresponding to the ratings of five to one) sums to 100 percent.
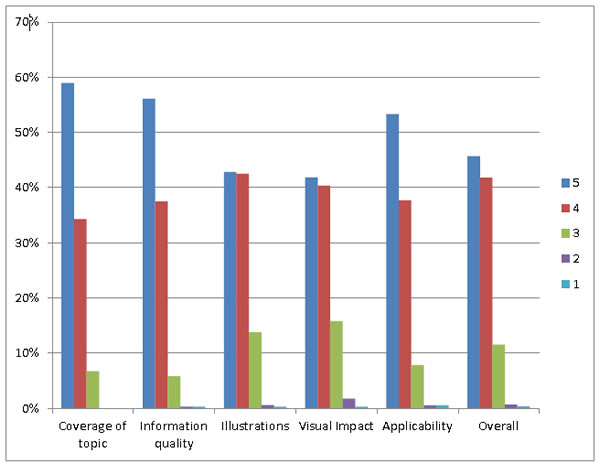
Figure 3: Overall distribution of ratings (five-point scale) for the CDIP workshop.
As seen in the figure, Workshop participant ratings of five (best) and four predominate in each dimension and for the CDIP overall. In all cases the top two responses account for between 80 to 90 percent of the ratings. There are some differences in ratings across dimensions, with participants rating "Coverage of topic" and "Information quality" most highly, followed by "Applicability". "Illustrations" and "Visual Impact", which were less highly rated than the other dimensions, still received high marks.
This section presents the most common findings and recommendations included in the ten CDIP Final Reports produced from October, 2010 through May, 2013. Any finding that appeared in at least five of the reports is included in this section. The text following each list includes selected less frequent findings and recommendations that have general importance for FHWA, the States, or recommendations for the future of CDIP.
In the ten CDIP reports, an average of 24 findings were referenced in the recommendations, the list below presents the most common findings. Numbers in parentheses are the number of States (out of 10) for which the finding was noted in the CDIP Final Report.
The findings, in general, indicate that States are not engaging in formal data quality management and, in particular, almost all States lack sufficient data quality performance measures for timeliness, accuracy, completeness, uniformity, integration, and accessibility. Few States log the errors that are noted in crash reports. This refers to both the data entry processes and errors noticed later by users. In the most typical case, when a user identifies an error in a crash record, they will fix the problem in their own copy of the data but then either (a) do not communicate the error and correction to the central crash data manager, or (b) the central crash data management process does not result in an update to the official record. Only one State kept an error log, but the contents of that log were not used as part of the data quality management process–that is, the information in the log was not used to develop training content, change the form or data collection manual, or develop new edit checks to address the most frequent errors. As implemented, the error log only applied to electronic data and did not include a way to log corrections to reports once they were accepted into the central crash database.
Roadway inventory files generally lack local roadway data. That means that when States measure the accuracy of location coding for crashes the number is, at best, incomplete. States in this situation may map 100 percent of crash locations, but they can only "land" the crashes for locations in their linear reference system (LRS). Depending on how the State counts the local roadway crashes in its indicator of success, this number could either over- or under- estimate the accuracy of location information. If the State reports the percentage of crashes that are assigned geographic coordinates and appear in the crash layer of its geographic information system (GIS), then the result is usually at or near 100 percent. The proportion of crash records that link to a roadway inventory record is often much lower, corresponding to those roadway segments the State maintains plus the subset of local roads on which the State gathers data for Federal reporting purposes.
In reviewing States' ability to measure the "six pack" of data quality attributes, the most common finding is that the attributes are not measured in a systematic way. Many States can produce measures, but the finding stands that the measures are not produced and reported on a regular basis. States that do measure data quality performance in one attribute typically have one measurement defined rather than a series of related measures. Such States are likely to have no measures of other data quality attributes.
Thus, six States have measures of "overall timeliness" but only one State has a measure of crash data submission timeliness. That same State lacks measures of accuracy, completeness, uniformity/consistency, integration, and accessibility. None of the ten States had routine measures in two or more data quality attributes. This has important implications for data quality management in several ways, not the least of which is that most States are not providing the data collectors in law enforcement any quantitative feedback on the quality of the reports they are submitting.
One State had a key agency that failed to report any crashes at all; however, systematic under-reporting is a serious problem affecting every State that participated in the program. Three States have adopted a crash reporting threshold that contributes directly to the under-reporting problem either by setting the damage threshold too high or because law enforcement officers are confused as to the exact criterion to apply. Two of the ten States address under- reporting by using reports submitted by drivers involved in crashes (operator reports). While not a recommended practice (drivers provide inaccurate data on some fields of the form), operator reports can help a State at least gauge the level of under-reporting by law enforcement.
Nine of ten States have not reviewed their edit checks in several years, and none do so on a periodic basis. For these nine states, the edit checks had not been reviewed since the most recent system update and sometimes not even then. The time spans ranged from five to twenty years or more. Edit check review is a process that would benefit from information contained in an error log, if such a log existed.
Some less frequent findings are also worth noting because they have an important impact on States' ability to manage their crash data:
As noted, five of the seven States that were described as having "widespread use of eCrash" also made at least some of those LEAs print their crash reports and send them in for manual data entry by the State. In every case, the State has a plan for increased electronic submission by law enforcement. In three of those States, the plan lacked details such as a timeline and interim measures of success.
Three States are unable to identify which LEA is responsible for a specific crash report.
As a result, it is impossible for the crash data managers to provide specific feedback to the agencies. This eliminates much of the value of a performance measurement system for crash data quality as the most crucial measures relate directly to data collection.
Three States have a crash report submission/entry backlog of more than a year. That makes it nearly impossible to implement any data quality improvement project that relies on feedback to law enforcement. Timely feedback is required for activities including (a) returning crash reports to the originating officer for correction; (b) providing agency-specific tallies of most common errors; and (c) discussions of deficiencies in edit checks and supervisory reviews.
The ten CDIP reports contained an average of 34 recommendations. The following list shows the most frequent issues addressed in the recommendations mirror the list of most frequent findings. Note that in some cases the recommendation appears in a different section of the report; the same key issues are addressed.
The recommendations are somewhat surprising in the frequency with which States were advised to create basic, top-level measurements for five of the six data quality attributes. For at least the past five years (the most recent cycle of Traffic Records Assessments), States have been required to develop data quality performance measures in order to qualify for funding under Section 408 of SAFETEA-LU. This requirement has continued under Section 405 of the new Transportation Reauthorization (MAP-21: Moving Ahead for Progress in the 21st Century). For timeliness, accuracy, completeness, integration, and accessibility, every CDIP report included a recommendation to create basic measurements assessing data quality. This is the result of the finding that none of the ten States had a data quality management program that included systematic measurement and reporting of more than one data quality attribute–most had no such measures.
The States do not engage in formal, comprehensive data quality management processes. The recommendations in the crash data management, location, and data quality assessment processes take on greater importance as a result. States clearly need guidance not just on what to measure, but how to incorporate data quality as part of the day-to-day management of the crash data resource. Measurement alone would move the States forward, but measurement in the context of a formal data quality management program would make it clear that data quality improvement is part of the job of data collection, data administration, and data use. The system to do this is not in place. States need both a series of measurements and a process to interpret and use those measurements within the context of a program that is designed to address the deficiencies that the numbers serve to uncover.
In every final report, the CDIP team acknowledged the costs associated with data quality management and made suggestions on the State-specific priorities and ways to fund the effort. One frequent suggestion applies to those States that still invest resources in managing a paper crash reporting process (either with staff or through a contract). In five States, the CDIP team recommended that the crash data custodian begin the process of transitioning away from a traditional crash data entry role to a crash data quality management role. In particular, the resources currently devoted to managing the paper reporting process can be reduced as electronic data submission increases. The States planning for increased electronic submission are advised to retain a portion of the resources rather than offer the entire data entry/paper management operation as a budget cut. The remaining resources should be allocated to support the recommended increases in data quality management activities. In some States, the same staff and job titles can be retained as the work transitions to focus on data quality management. In others, the transition will require a change in personnel and/or job titles, or a different type of vendor contract.
Some lower-frequency recommendations are important to consider for what they say about current State needs and in recommendations for the future of CDIP. These are:
| <<Previous | Table of Content | Next >> |

