U.S. Department of Transportation
Federal Highway Administration
1200 New Jersey Avenue, SE
Washington, DC 20590
202-366-4000


Skip to content
Facebook iconYouTube iconTwitter iconFlickr iconLinkedInInstagram

Safety

FHWA Home / Safety / Speed Management / Traffic Calming ePrimer

Traffic Calming ePrimer – Module 4

Effects of Traffic Calming Measures on Motor Vehicle Speed and Volume

A traffic calming measure can cause a reduction in average vehicle speed or in the range of speeds observed (i.e., eliminate or reduce very high vehicle speeds). The speed reduction could result in a shift in traffic from the roadway (i.e., a vehicle volume reduction). The following are selected charts and tables that illustrate measured changes in vehicle speed and volume as a result of individual traffic calming measures.

The data used to derive these charts come from Traffic Calming: State of the Practice (ITE, 1999) and several recent research and data analysis documents.17

17 Developing Design Standards for Speed Cushions (Chang, K. et al, TRR 2030, 2007), Collector Street Traffic Calming: A Comprehensive Before – After Study (Buckholz, K. et al, ITE Annual Meeting, 2000), An Evaluation of Traffic Calming Measures and Their Impact on Vehicular Speeds on an Urban Principal Arterial Roadway on the Periphery of an Activity Center (Dulaski, D., ITE Annual Meeting, 2006), Traffic Calming – An Assessment of Selected On-Road Chicane Schemes (Transport Research Laboratory, TRL Report 313, 1998), Investigating the Effectiveness of Traffic Calming Strategies on Driver Behavior, Traffic Flow and Speed (Minnesota Local Road Research Board, Report 2002-02, 2001), Temporary Speed Hump Impact Evaluation (Hallmark, S. et al, Iowa State University, 2002), Kodak Park Neighborhood Traffic Management (Huffine, C., ITE Annual Meeting, 2005)

4.1 Speed Hump and Speed Cushion18

85th Percentile Speed

A frequency distribution of 85th percentile vehicle speeds after installation of a speed hump is presented in Figure 4.1. The plot represents data from 218 speed humps. The most frequent post-implementation speed is shown to be 27 mph, followed closely by 25 mph. These two speed values are significant deviations from an otherwise normal distribution. Based on this data, the 25-to-27 mph range would appear to be a reasonable expectation for an 85th percentile speed for a new speed hump installation (note: observed speeds at speed table installations, presented later, are on the order of 5 mph higher with the highest frequency in the 30-to-32 mph range).

The data in Figure 4.1 represent a wide range of pre-treatment speed conditions. Further investigation into the data by initial speed bins points to some differences. In general, the post-implementation speeds tend to be higher for sites with higher pre-implementation speeds.

18 The data are from measurements at speed humps. It is presumed that a speed cushion should have a similar effect on speed as a speed hump for all but large vehicles (e.g., fire vehicles) that can straddle the cushions and maintain pre-implementation speed.
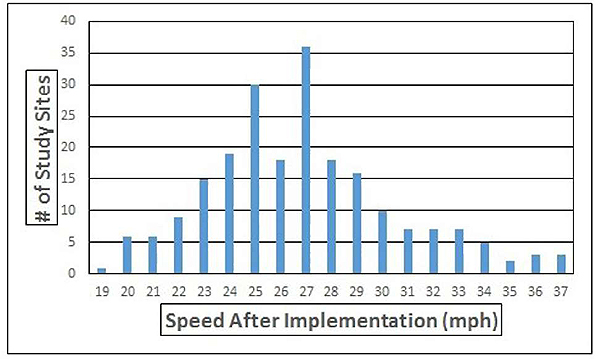
Figure 4.1. Frequency Distribution of 85th Percentile Vehicle Speeds After Implementation of a Speed Hump (All Sites). This figure contains a bar chart. The y-axis is labeled "# of Study Sites" and has values of zero through forty in increments of five. The x-axis is labeled "Speed After Implementation" with values of 19 through 37 in increments of one. The blue bar above the numeral 19 has an approximate value of 1. The blue bar above the numeral 20 has an approximate value of 6. The blue bar above the numeral 21 has an approximate value of 6. The blue bar above the numeral 22 has an approximate value of 9. The blue bar above the numeral 23 has an approximate value of 15. The blue bar above the numeral 24 has an approximate value of 18. The blue bar above the numeral 25 has an approximate value of 30. The blue bar above the numeral 26 has an approximate value of 17. The blue bar above the numeral 27 has an approximate value of 36. The blue bar above the numeral 28 has an approximate value of 18. The blue bar above the numeral 29 has an approximate value of 16. The blue bar above the numeral 30 has an approximate value of 10. The blue bar above the numeral 31 has an approximate value of 8. The blue bar above the numeral 32 has an approximate value of 8. The blue bar above the numeral 33 has an approximate value of 8. The blue bar above the numeral 34 has an approximate value of 5. The blue bar above the numeral 35 has an approximate value of 2. The blue bar above the numeral 36 has an approximate value of 3. The blue bar above the numeral 37 has an approximate value of 3.
Figure 4.1. Frequency Distribution of 85th Percentile Vehicle Speeds After Implementation of a Speed Hump (All Sites)

Figure 4.2 presents a frequency distribution of post-implementation speeds for sites with pre-treatment speeds in the 36-to-40 mph range. As is the case for the entire database, the most frequent reported post-implementation speed is 27 mph, but the range of high-frequency speeds is between 25-to-30 mph with the next tier of speed reports in the 31-to-34 mph range.
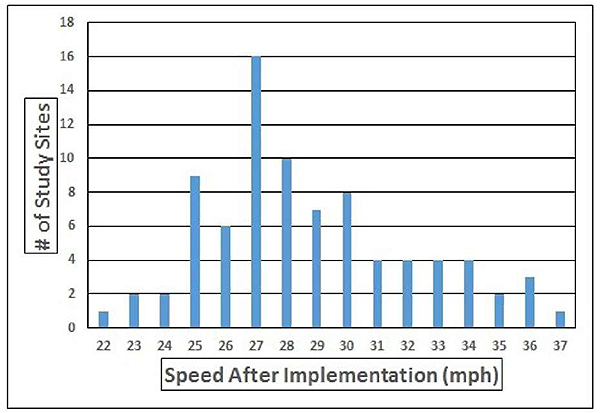
Figure 4.2. Frequency Distribution of 85th Percentile Vehicle Speeds After Implementation of a Speed Hump (with Initial Speed Range between 36 and 40 mph). This figure contains a bar chart. The y-axis is labeled "# of Study Sites" and has values of zero through eighteen in increments of two. The x-axis is labeled "Speed After Implementation" with values of 22 through 37 in increments of one. The blue bar above the numeral 22 has a value of 1. The blue bar above the numeral 23 has a value of 2. The blue bar above the numeral 24 has a value of 2. The blue bar above the numeral 25 has a value of 9. The blue bar above the numeral 26 has a value of 6. The blue bar above the numeral 27 has a value of 16. The blue bar above the numeral 28 has a value of 10. The blue bar above the numeral 29 has a value of 7. The blue bar above the numeral 30 has a value of 8. The blue bar above the numeral 31 has a value of 4. The blue bar above the numeral 32 has a value of 4. The blue bar above the numeral 33 has a value of 4. The blue bar above the numeral 34 has a value of 4. The blue bar above the numeral 35 has a value of 2. The blue bar above the numeral 36 has a value of 3. The blue bar above the numeral 37 has a value of 1.
Figure 4.2. Frequency Distribution of 85th Percentile Vehicle Speeds After Implementation of a Speed Hump (with Initial Speed Range between 36 and 40 mph)

For speed humps with pre-implementation speeds in the 31-to-35 mph range, Figure 4.3 illustrates the frequency distribution for post-implementation speeds. As is the case in the preceding two charts, the most frequent speed is 27 mph; in contrast, however, the next most frequent speeds range between 23 and 25 mph.
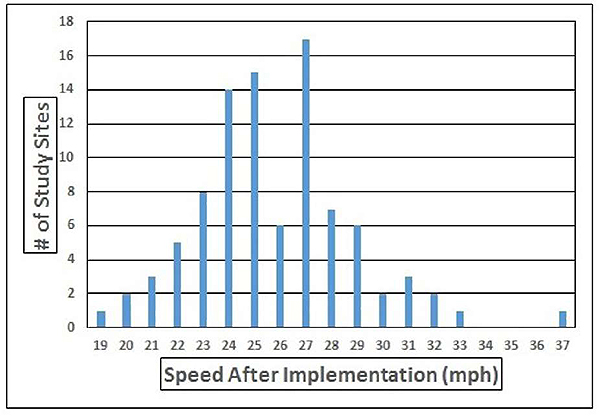
Figure 4.3. Frequency Distribution of 85th Percentile Vehicle Speeds After Implementation of a Speed Hump (with Initial Speed Range between 31 and 35 mph). This figure contains a bar chart. The y-axis is labeled "# of Study Sites" and has values of zero through eighteen in increments of two. The x-axis is labeled "Speed After Implementation" with values of 19 through 37 in increments of one. The blue bar above the numeral 19 has a value of 1. The blue bar above the numeral 20 has a value of 2. The blue bar above the numeral 21 has a value of 3. The blue bar above the numeral 22 has a value of 5. The blue bar above the numeral 23 has a value of 8. The blue bar above the numeral 24 has a value of 14. The blue bar above the numeral 25 has a value of 15 The blue bar above the numeral 26 has a value of 6. The blue bar above the numeral 27 has a value of 17. The blue bar above the numeral 28 has a value of 7. The blue bar above the numeral 29 has a value of 6. The blue bar above the numeral 30 has a value of 2. The blue bar above the numeral 31 has a value of 3. The blue bar above the numeral 32 has a value of 2. The blue bar above the numeral 33 has a value of 1. The blue bar above the numeral 34 has a value of 0. The blue bar above the numeral 35 has a value of 0. The blue bar above the numeral 36 has a value of 0. The blue bar above the numeral 37 has a value of 1.
Figure 4.3. Frequency Distribution of 85th Percentile Vehicle Speeds After Implementation of a Speed Hump (with Initial Speed Range between 31 and 35 mph)

For speed humps with pre-implementation speeds in the 26-to-30 mph range, Figure 4.4 illustrates the frequency distribution for post-implementation speeds. As should be expected, the most frequent speeds are 25 and 26 mph; followed by 23 and 20 mph.
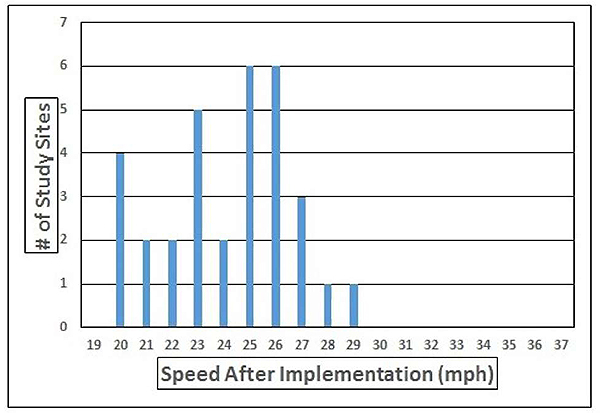
Figure 4.4. Frequency Distribution of 85th Percentile Vehicle Speeds After Implementation of a Speed Hump (with Initial Speed Range between 26 and 30 mph). This figure contains a bar chart. The y-axis is labeled "# of Study Sites" and has values of zero through seven in increments of one. The x-axis is labeled "Speed After Implementation" with values of 19 through 37 in increments of one. The blue bar above the numeral 19 has a value of 0. The blue bar above the numeral 20 has a value of 4. The blue bar above the numeral 21 has a value of 2. The blue bar above the numeral 22 has a value of 2. The blue bar above the numeral 23 has a value of 5. The blue bar above the numeral 24 has a value of 2. The blue bar above the numeral 25 has a value of 6 The blue bar above the numeral 26 has a value of 6. The blue bar above the numeral 27 has a value of 3. The blue bar above the numeral 28 has a value of 1. The blue bar above the numeral 29 has a value of 1. The blue bar above the numeral 30 has a value of 0. The blue bar above the numeral 31 has a value of 0. The blue bar above the numeral 32 has a value of 0. The blue bar above the numeral 33 has a value of 0. The blue bar above the numeral 34 has a value of 0. The blue bar above the numeral 35 has a value of 0. The blue bar above the numeral 36 has a value of 0. The blue bar above the numeral 37 has a value of 0.
Figure 4.4. Frequency Distribution of 85th Percentile Vehicle Speeds After Implementation of a Speed Hump (with Initial Speed Range between 26 and 30 mph)

Maximum Observed Speed

Data collected at 26 speed humps demonstrates that the effect of speed humps on high speed vehicles is dramatic. For the study sites, 14 percent of the pre-implementation traffic had a measured speed that was at least 10 mph higher than the posted speed limit. After implementation of a speed hump, this high speed traffic had dropped to an average of 1 percent of the total traffic.

Traffic Volume

Data collected at 187 speed humps demonstrate that they can have a wide-ranging effect on traffic volume. The average reduction in the reported daily volumes is 20 percent (the same average as for speed tables), with values ranging from a reduction of 72 percent on the low end to no reduction, and even an increase in some situations (where additional changes to the roadway network are presumed to have likely been implemented).

A site-specific traffic shift depends not only on the speed changes caused by the speed humps but also the availability of alternative routes that can provide a shorter travel time for a motorist that shifts routes.

4.2 Speed Table, Raised Crosswalk, and Offset Speed Table19

85th Percentile Speed

A frequency distribution of 85th percentile vehicle speeds after installation of a speed table is presented in Figure 4.5. The plot represents data from 90 speed tables. The most frequent post-implementation speed is shown to be 30 mph, followed closely by values of 31 and 32 mph. Based on this data, the 30-to-32 mph range would appear to be a reasonable expectation for an 85th percentile speed for a new speed table installation [note: observed speeds at speed hump installations, presented earlier, are on the order of 5 mph lower with the highest frequency in the 25-to-27 mph range].
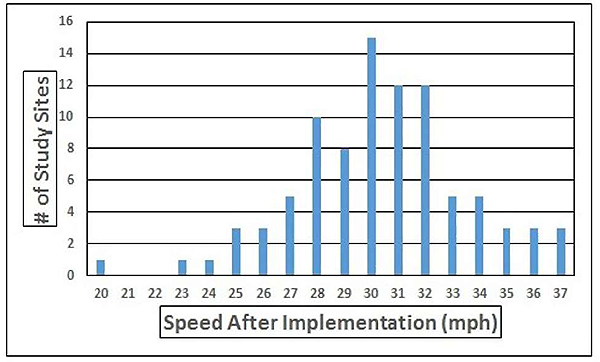
Figure 4.5. Frequency Distribution of 85th Percentile Vehicle Speeds After Implementation of a Speed Table (All Sites). This figure contains a bar chart. The y-axis is labeled "# of Study Sites" and has values of zero through sixteen in increments of two. The x-axis is labeled "Speed After Implementation" with values of 20 through 37 in increments of one. The blue bar above the numeral 20 has a value of 1. The blue bar above the numeral 21 has a value of 0. The blue bar above the numeral 22 has a value of 0. The blue bar above the numeral 23 has a value of 1. The blue bar above the numeral 24 has a value of 1. The blue bar above the numeral 25 has a value of 3 The blue bar above the numeral 26 has a value of 3. The blue bar above the numeral 27 has a value of 5. The blue bar above the numeral 28 has a value of 10. The blue bar above the numeral 29 has a value of 8. The blue bar above the numeral 30 has a value of 15. The blue bar above the numeral 31 has a value of 12. The blue bar above the numeral 32 has a value of 12. The blue bar above the numeral 33 has a value of 5. The blue bar above the numeral 34 has a value of 5. The blue bar above the numeral 35 has a value of 3. The blue bar above the numeral 36 has a value of 3. The blue bar above the numeral 37 has a value of 3.
Figure 4.5. Frequency Distribution of 85th Percentile Vehicle Speeds After Implementation of a Speed Table (All Sites)

The data in Figure 4.5 represent a wide range of pre-implementation speed conditions. Further investigation into the data by initial speed bins points to similar frequency distribution of post-implementation speeds for three ranges of pre-implementation speeds: 41-to-47 mph, 36-to-40 mph (shown in Figure 4.6), and 31-to-35 mph.

19 The data are from measurements at speed tables. It is expected that a raised crosswalk should have a similar effect on motor vehicle speeds as a speed table. It is presumed that an offset speed table should, likewise, have a similar effect on speed as a speed table for all but large vehicles (e.g., fire vehicles) that can drive around the offset tables and limit any speed reduction.
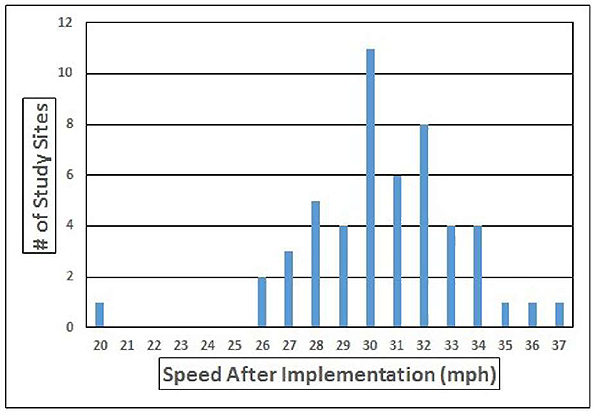
Figure 4.6. Frequency Distribution of 85th Percentile Vehicle Speeds After Implementation of a Speed Table (with Initial Speed Range between 36 and 40 mph). This figure contains a bar chart. The y-axis is labeled "# of Study Sites" and has values of zero through twelve in increments of two. The x-axis is labeled "Speed After Implementation" with values of 20 through 37 in increments of one. The blue bar above the numeral 20 has a value of 1. The blue bar above the numeral 21 has a value of 0. The blue bar above the numeral 22 has a value of 0. The blue bar above the numeral 23 has a value of 0. The blue bar above the numeral 24 has a value of 0. The blue bar above the numeral 25 has a value of 0 The blue bar above the numeral 26 has a value of 2. The blue bar above the numeral 27 has a value of 3. The blue bar above the numeral 28 has a value of 5. The blue bar above the numeral 29 has a value of 4. The blue bar above the numeral 30 has a value of 11. The blue bar above the numeral 31 has a value of 6. The blue bar above the numeral 32 has a value of 8. The blue bar above the numeral 33 has a value of 4. The blue bar above the numeral 34 has a value of 4. The blue bar above the numeral 35 has a value of 1. The blue bar above the numeral 36 has a value of 1. The blue bar above the numeral 37 has a value of 1.
Figure 4.6. Frequency Distribution of 85th Percentile Vehicle Speeds After Implementation of a Speed Table (with Initial Speed Range between 36 and 40 mph)

Maximum Observed Speed

Data collected at 7 speed tables demonstrates that the effect of speed tables on high speed vehicles is dramatic. For the study sites, 27 percent of the pre-implementation traffic had a measured speed that was at least 10 mph higher than the posted speed limit. After installation of a speed table, this high speed traffic had dropped to an average of 3 percent of the total traffic.

Traffic Volume

Data collected at 58 speed tables demonstrate that they can have a wide-ranging effect on traffic volume. The average reduction in the reported daily volumes is 20 percent (the same average as for speed humps), with values ranging between a reduction of 57 percent and an increase of 53 percent of the total traffic.

A site-specific traffic shift depends not only on the speed changes caused by the speed tables but also the availability of alternative routes that can provide a travel time for which a motorist could shift routes.

4.3 Chicane

85th Percentile Speed

A summary of pre- and post-implementation 85th percentile speeds at 25 chicanes is presented in Table 4.1. For a one-lane, one-way chicane, the pre-implementation speed

Traffic Calming ePrimer

range appears to have little effect on the post-implementation speed range and average speed (26 mph). They are similar for both pre-implementation speed ranges.

For a two-lane, two-way chicane, the pre-implementation speed range appears to have a limited effect on the post-implementation speed range and average speed. The lower initial speed produces a lower post-implementation speed difference (by 2 mph), but not of the same magnitude of the pre-implementation speed differences (6-or-more mph).

Table 4.1. Effects of Chicanes on Vehicle Speeds

Type of Chicane Number of Sites Pre-Implementation Speed Range Post-Implementation
Speed Range Average Speed
1-lane, 1-way 4 41-to-50 mph 21-to-32 mph 26 mph
1-lane, 1-way 8 29-to-37 mph 20-to-31 mph 26 mph
         
2-lane, 2-way 8 40-to-52 mph 25-to-40 mph 33 mph
2-lane, 2-way 5 34-to-37 mph 27-to-34 mph 31 mph

4.4 Traffic Circle

85th Percentile Speed

A frequency distribution of 85th percentile vehicle speeds after installation of a traffic circle is presented in Figure 4.7. The plot represents data from 47 traffic circles. The most frequent speeds are shown to be 27 and 28 mph. The majority of sites with post-implementation speeds of 32 and above had pre-implementation speeds in the 36-to-42 mph range. The sites with post-implementation speeds that cluster around 27 and 28 mph had pre-implementation speeds in the 32-to-35 mph range.
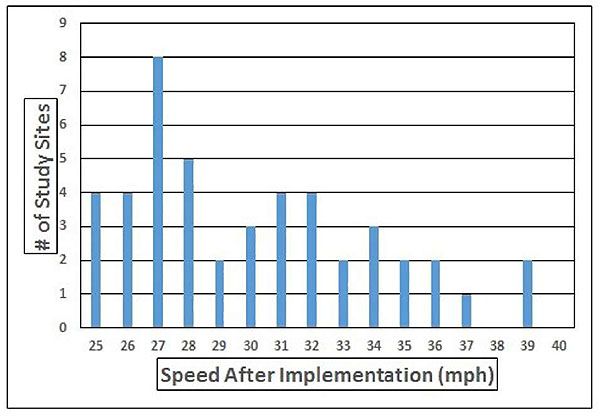
Figure 4.7. Frequency Distribution of 85th Percentile Vehicle Speeds After Installation of a Traffic Circle (All Sites). This figure contains a bar chart. The y-axis is labeled "# of Study Sites" and has values of zero through nine in increments of one. The x-axis is labeled "Speed After Implementation" with values of 25 through 40 in increments of one. The blue bar above the numeral 25 has a value of 4 The blue bar above the numeral 26 has a value of 4. The blue bar above the numeral 27 has a value of 8. The blue bar above the numeral 28 has a value of 5. The blue bar above the numeral 29 has a value of 2. The blue bar above the numeral 30 has a value of 3. The blue bar above the numeral 31 has a value of 4. The blue bar above the numeral 32 has a value of 4. The blue bar above the numeral 33 has a value of 2. The blue bar above the numeral 34 has a value of 3. The blue bar above the numeral 35 has a value of 2. The blue bar above the numeral 36 has a value of 2. The blue bar above the numeral 37 has a value of 1. The blue bar above the numeral 38 has a value of 0. The blue bar above the numeral 39 has a value of 2. The blue bar above the numeral 40 has a value of 0.
Figure 4.7. Frequency Distribution of 85th Percentile Vehicle Speeds After Installation of a Traffic Circle (All Sites)

Traffic Volume

Data collected at 51 traffic circles demonstrate that they can have a wide-ranging effect on traffic volume. The average reduction in the reported daily volumes is 29 percent, with values ranging between a reduction of 86 percent and an increase of 270 percent of the total traffic.

A site-specific traffic shift depends not only on the speed changes caused by the traffic circle but also the availability of alternative routes that can provide a shorter travel time for a motorist that shifts routes.

<< Back to Traffic Calming ePrimer

Page last modified on February 13, 2017
Safe Roads for a Safer Future - Investment in roadway safety saves lives
Federal Highway Administration | 1200 New Jersey Avenue, SE | Washington, DC 20590 | 202-366-4000