U.S. Department of Transportation
Federal Highway Administration
1200 New Jersey Avenue, SE
Washington, DC 20590
202-366-4000
| < Previous | Table of Contents | Next > |
With roadway departure, intersections, and pedestrian and bicycle crashes accounting for approximately 90 percent of the traffic fatalities in the United States, these key focus areas are a vital link in managing speed and targeting speeding-related crashes.14 Using the results of this research project's crash analysis report,15 this chapter includes crash trends involving speeding-related fatal crashes and potential strategies to assist agencies in addressing speeding-related crashes within each focus area. While each focus area and its respective strategies are listed in separate sections within Chapter 4, FHWA encourages agencies to use a combination of strategies since speeding-related crash issues often overlap into multiple focus areas. Overall program-level strategies (non-focus area specific) are listed in Chapter 3.
A roadway departure crash is defined by FHWA as "a crash which occurs after a vehicle crosses an edge line or a center line, or otherwise leaves the traveled way."16
Roadway departure crashes are frequently severe and account for the majority of highway fatalities. In 2013, there were 18,257 fatalities as a result of roadway departure crashes, which accounted for 56 percent of the traffic fatalities in the United States.17 Approximately 40 percent of fatal roadway departure crashes are speeding-related.18
Crash analysis performed on national data relating to speeding-related and roadway departure crashes gives insight into the nature of these crash types, where these crashes occur, and driver characteristics or behavioral elements that may affect the number and severity of these crashes.
The FHWA Safety Roadway Departure Program analyzed Fatality Analysis Reporting System (FARS) and General Estimation System (GES) data (2010-2013) and determined there are three primary event types that are most harmful in 75 percent of all roadway departure crashes:
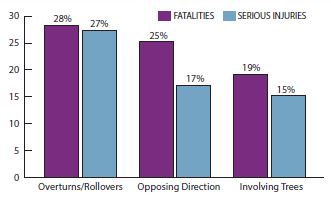
These top three crash types have been designated as primary emphasis areas and researchers determined speed is one of the contributing factors. Each crash category underwent further analysis to determine where these crashes occur and significant contributing factors. Figures 5 through 7 show the results.
While the data above focuses more broadly on roadway departure crashes (not necessarily speeding- related), the following sections present some crash trends for speeding-related roadway departure crashes.
ROADWAY FUNCTIONAL CLASS
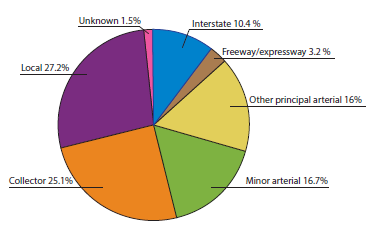
Initially, some may be surprised to learn that the majority of fatal speeding-related roadway departure crashes do not happen on Interstates and freeways. In fact, 85 percent of vehicles involved in these fatal crash types were traveling on local, collector, minor arterial, or other principal arterial roadways, as shown in Figure 8.
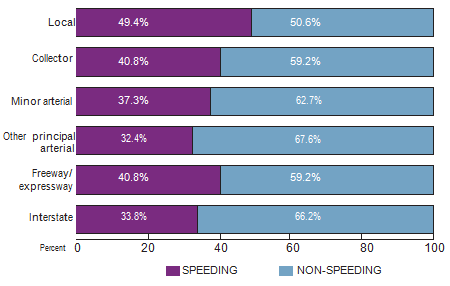
The following figure shows the percentage of vehicles involved in these types of crashes that were speeding and non-speeding by roadway type during the 2010-2012 period. Nearly half of all vehicles involved in fatal roadway departure crashes on local roads are speeding-related. Other principal arterials and interstates ranked lowest at 32.4 percent and 33.8 percent, respectively.
POSTED SPEED LIMIT
The distribution of vehicles involved in speeding-related roadway departure fatal crashes by speed limit during the 2010-2012 period is shown in Figure 10. More than half of the vehicles involved in speeding-related roadway departure fatal crashes occur on roadways posted between 40 and 55 mph.
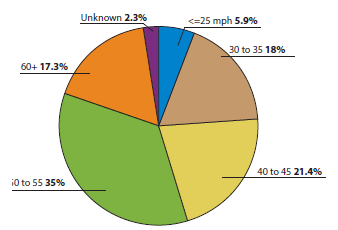
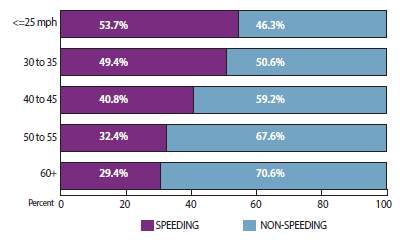
Figure 11 provides the percentage of vehicles involved in speeding and non-speeding roadway departure fatal crashes according to speed limit category. Note that the proportion of speeding-related crashes increases as the posted speed limit decreases.
ROADWAY GEOMETRY
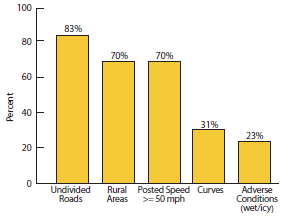
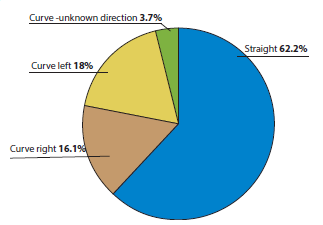
A major aspect of preventing speeding-related roadway departure crashes is addressing curves. As Figure 12 shows, a large share of speeding-related fatal roadway departure crashes occur on tangent sections of roadways. More than 37 percent of vehicles involved in speeding-related fatal roadway departure crashes are on curves.
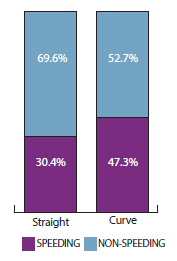
When fatal roadway departure crashes are broken down separately by whether they occur on curves or straight sections of roadway, the likelihood of these types of crashes being speeding related is higher on curves. Close to half of vehicles involved in fatal roadway departure crashes on curves were coded as speeding related. By comparison, 30 percent of speeding-related fatal roadway departure crashes occurred on tangent sections of roadway.
DRIVER CHARACTERISTICS
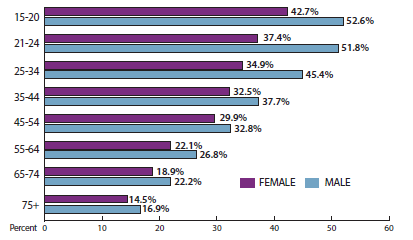
The national data shows a very clear distinction: males are more likely to be involved in a roadway departure fatal crash and have even higher likelihood of being involved in a speeding-related roadway departure fatal crash. During the 2010-2012 period, males comprised approximately 75 percent of roadway departure fatalities and accounted for nearly 80 percent of speeding-related roadway departure fatalities. When looking at the fatal roadway departure crashes within each age group, both males and females in the 15 to 20 age group were more likely to be involved in speeding-related roadway departure crashes. As shown in Figure 14, 42.7 percent of fatal roadway departure crashes for females in the 15 to 20 age group were speeding-related while 52.6 percent of fatal roadway departure crashes for males in that age group were speeding-related.
TIME OF DAY
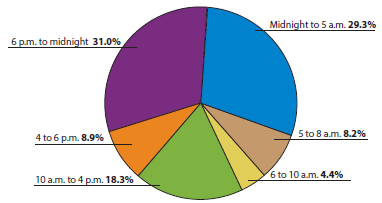
With respect to the time of day, Figure 15 shows 60 percent of the speeding-related fatal roadway departure crashes happen between 6 p.m. and 5 a.m. Further analysis reveals that between midnight and 5 a.m., nearly 50 percent of all fatal roadway departure crashes that occur are speeding-related.
A number of potential strategies and countermeasures exist for agencies to consider when addressing speeding-related roadway departure crashes. By reviewing the national data, investigating the state of the practice, and conducting interviews with national experts, our researchers identified key issues relating to speeding-related roadway departure crashes. Some recommended strategies were identified through agency interviews and published resources.19 Every situation or location is unique, and agencies should exercise engineering judgment for determining the appropriate solution for their specific crash concerns.
Issue: National data shows 85 percent of vehicles involved in speeding-related roadway departure fatal crash types were traveling on local, collector, or minor arterial, or other principal arterial roadways.
Potential strategies:
Issue: Males are involved in nearly 80 percent of speeding-related roadway departure fatalities. Drivers ages 15 to 20 are more likely to be involved in speeding-related roadway departure fatal crashes.
Potential strategies:
Issue: Roadway departure fatalities within curves are more likely to be speeding-related.
Potential strategies:
Issue: Rollover/overturn crashes, opposing direction crashes, and crashes involving trees are the three primary event types that are most harmful in 75 percent of all roadway departure crashes, and speeding is identified as one of the contributing factors.
Potential Strategies:
Speed management countermeasures references are available on FHWA's Speed Management website. FHWA has published two desktop references that summarize studies on the effectiveness of engineering countermeasures in reducing crashes and managing speed.24 The CMF Clearinghouse provides a comprehensive database of CMFs along with supporting documentation to help agencies identify potential countermeasures and their proven levels of effectiveness.25
"An intersection, by design, is a planned location where vehicles traveling on different highways may come into conflict. The functional area of an intersection extends upstream and downstream from the physical area of the crossing streets. The different approach and crossing movements by motorists, bicyclists, and pedestrians make at-grade intersections one of the most complex traffic situations that people encounter."
Excerpt from FHWA Issue Brief 2, "The National Intersection Safety Problem," 2009
Intersections account for almost 20 percent of speeding-related fatal crashes and more than one-third of all speeding-related crashes. A summary of the national crash analysis results for speeding-related fatal crashes at intersections is shown below. The full analysis is included in Appendix A.
ROADWAY FUNCTIONAL CLASS
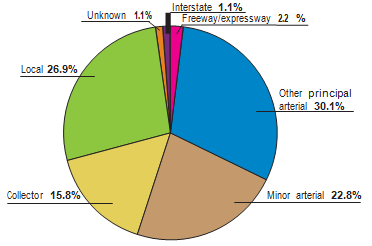
Figure 16 shows the distribution of vehicles involved in speeding-related fatal intersection crashes by roadway type during the 2010-2012 period. Nearly 53 percent took place on arterial roadways. Local roads contained more than 25 percent of the vehicles involved in speeding-related fatal intersection crashes.
POSTED SPEED LIMIT
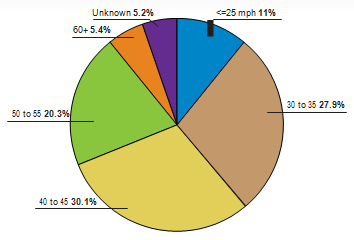
The analysis by speed limit in Figure 17 shows that almost 60 percent of vehicles involved in speeding-related fatal intersection crashes from 2010 to 2012 happened on roadways with speed limits between 30 and 45 mph.
DRIVER CHARACTERISTICS
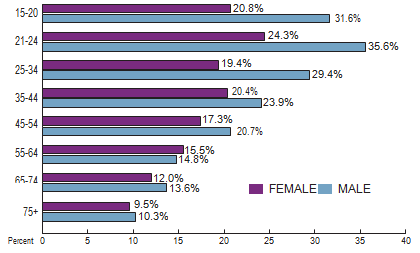
Following the same trend as speeding-related fatal roadway departure crashes, male drivers account for more than 75 percent of speeding-related fatal crashes at intersections. When looking at the fatal intersection crashes within each age group, both males and females in the 21 to 24 age group were more likely to be involved in speeding-related intersection crashes. As shown in the figure below, 24.3 percent of female drivers and 35.6 percent of male drivers in that age group who were involved in fatal intersection crashes during the 2010-2012 period were speeding.
VEHICLE TYPE
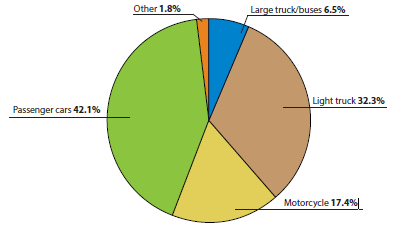
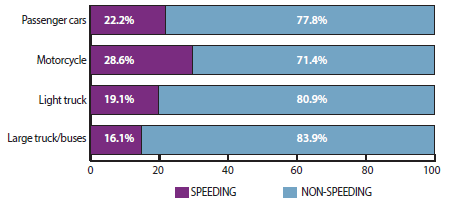
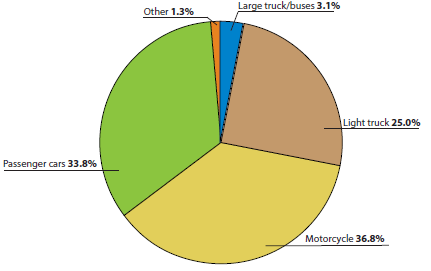
The fact that passenger cars and light trucks account for approximately 75 percent of the vehicles involved in fatal intersection crashes is not surprising since they are the predominant transportation modes. With motorcycles making up just 3 percent of all registered vehicles in the United States and accounting for only 0.7 percent of all vehicle miles travelled,26 the results in Figure 19, which shows that motorcycles account for over 17 percent of the vehicles that were involved in speeding-related fatal intersection crashes between 2010 and 2012, is significant.
When analyzing each vehicle type separately to determine the percentage involved in speeding-related fatal intersection crashes, approximately 30 percent of motorcycle-involved intersection crashes–the highest percentage of all vehicle types–were considered speeding-related.
CRASH TYPE
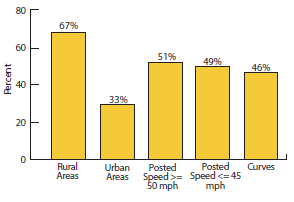
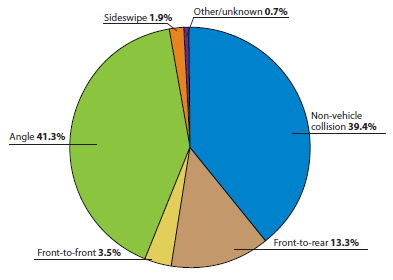
Figure 21 shows that, at more than 41 percent, angle crashes make up the highest percentage of speeding-related fatal intersection crashes for the 2010-2012 period, and collisions with non-vehicle objects (e.g., pedestrians, bicycles, roadside features, etc.) follows closely behind, accounting for almost 40 percent. Notably, although rear-end crashes make up just over 6 percent of all fatal intersection crashes, they more than doubled that percentage (13.3 percent) for speeding-related fatal intersection crashes. Around 44 percent of rear-end fatal intersection crashes took place in rural areas.
When looking at the crash types independently, additional insight can be gained on the nature of fatal intersection crashes. Figure 22 shows the distribution of vehicles involved in speeding-related fatal angle crashes at intersections by vehicle type during the study period. Once again, motorcycles are the predominant vehicle type in these crashes. Almost 40 percent of the vehicles involved in speeding-related fatal angle crashes were motorcycles.
FHWA, the National Highway Transportation Safety Administration (NHTSA), the American Association of State Highway and Transportation Officials (AASHTO), Institute of Transportation Engineers (ITE), and other organizations have developed a number of potential resources for agencies to use in identifying successful strategies for improving intersection safety. Many of these strategies and countermeasures are just as applicable for addressing speeding-related intersection crashes. By reviewing the national data, investigating the state of the practice, and conducting interviews with national experts, some key issues or focus areas relating to speeding-related intersection fatal crashes were identified. These strategies were discovered through agency interviews and published resources.27 Every situation or location is unique, and agencies should exercise engineering judgment when determining the appropriate solution for their specific crash concerns.
Issue: National data shows nearly 53 percent of vehicles involved in speeding-related intersection fatal crash types were traveling on arterial roadways.
Potential strategies:
Issue: Motorcyclists have a high risk of being involved in speeding-related intersection fatal crashes.
Potential strategies:
Issue: Angle crashes make up the highest percentage of speeding-related fatal intersection crashes at over 41 percent.
Potential strategies:
Issue: Speeding-related fatal intersection crashes are more likely to happen in rural areas.
Potential strategies:
Issue: While roundabouts and mini roundabouts are two of the most effective measures for managing speed through intersections and reducing severe crashes, initial cost or public sentiment often precludes widespread implementation in favor of conventional intersection designs and low-cost improvements.
Potential strategies
Transportation safety is not only about motor vehicle safety, it also encompasses protecting vulnerable users. Pedestrian safety is a primary concern in communities across the United States, with pedestrians accounting for approximately 14 percent of traffic fatalities.33 In 2013, bicyclist deaths accounted for over 2 percent of all motor vehicle traffic fatalities.34,35
The speeding-related crash analysis completed on the national data included information on both pedestrians and bicyclists involved in fatal crashes. Approximately 8 percent of fatal crashes involving a pedestrian or bicyclist were speeding related, and 73 percent occurred predominantly in an urban setting. When looking at all fatal pedestrian and bicycle crashes, the speeding-related crashes were almost twice as likely to be hit and run. While the complete report is included in Appendix A, some of the more significant results are listed below.
LOCATION
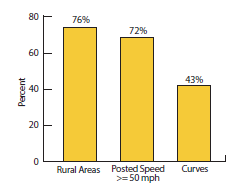
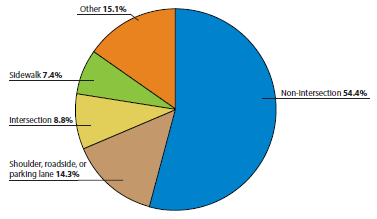
Locations for speeding-related fatal pedestrian and bicycle crashes are summarized in Figure 23. The majority of these fatal crashes did not take place at an intersection. These locations, making up nearly 55 percent of fatal speeding-related pedestrian and bicycle crashes, may indicate mid-block crossings. Shoulders, roadsides, or parking lanes accounted for approximately 15 percent.
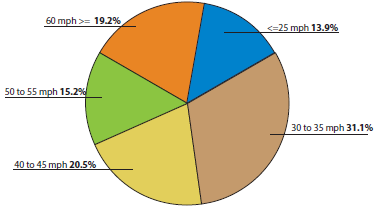
SPEED LIMIT
The distribution of vehicles involved in speeding-related pedestrian and bicycle fatal crashes by posted speed limit is shown in the figure below. More than 50 percent occurred on roads with speed limits between 30 mph and 45 mph, although roadways with these types of speed limits are more likely to have higher pedestrian and bicyclist volumes. Conversely, roads with speed limits of 60 mph or more, which account for almost 20 percent of the vehicles involved in these types of fatal crashes, typically have fewer pedestrians and bicyclists.
DRIVER CHARACTERISTICS
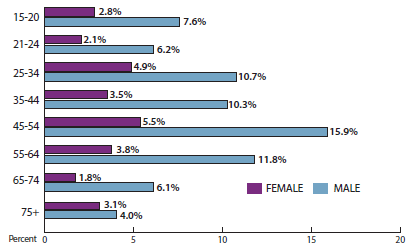
As with the other focus areas, males also make up more than 70 percent of drivers in speeding-related pedestrian and bicycle fatal crashes. The age group that is more likely to be involved in speeding-related fatal pedestrian and bicycle crashes is quite different than those involved in speeding-related roadway departure and intersection crashes. The distribution of drivers by age and gender category is shown in Figure 25 (the sum of all bars equals 100 percent). Males aged 45 to 64 make up nearly 30 percent of all speeding-related fatal pedestrian and bicycle crashes. Because of hit and run crashes, driver characteristics in all crashes may not be identified.
TIME OF DAY
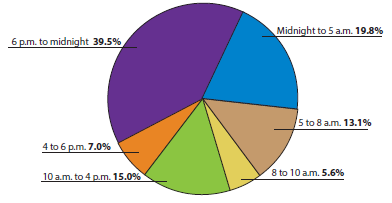
As shown in Figure 26, the most problematic time period was 6 p.m. to midnight, during which period nearly 40 percent of speeding-related fatal pedestrian and bicycle crashes occurred. The period with the second highest rate of crashes was from midnight to 5 a.m., during which time almost 20 percent of fatal pedestrian and bicycle crashes occurred.
"Every transportation agency, including DOT, has the responsibility to improve conditions and opportunities for walking and bicycling and to integrate walking and bicycling into their transportation systems."
— U.S. DOT Policy Statement on Bicycle and Pedestrian Accommodation Regulations and Recommendations, March 2010
Addressing speeding-related, fatal pedestrian and bicycle crashes may be more challenging or overwhelming to agencies compared to the other focus areas. The lack of robust data and convincing leaders to prioritize pedestrian and bicyclist safety are just some of the hurdles that agencies must overcome. Below are some of the common issues regarding speeding-related pedestrian and bicycle crashes that were identified both by agencies and by national data analysis results. The recommended strategies were identified through agency interviews and published resources.36 Every situation or location is unique, and agencies should exercise engineering judgment for determining the appropriate solution for their specific crash concerns. Although many of these strategies focus on pedestrian safety, many are also applicable to bicycle safety improvements.
Issue: It is challenging for agencies to identify clusters or problem locations for improving pedestrian safety because of data quality and quantity.
Potential strategies
Issue: National data analysis revealed nearly 40 percent of speeding-related fatal pedestrian and bicycle crashes took place between 6 p.m. and midnight. The period with the second greatest number of crashes, almost 20 percent, was from midnight to 5 a.m.
Potential strategies
Issue: The majority of pedestrian speeding-related fatal crashes do not take place at an intersection.
Potential strategies
Issue: Many roadways have historically been designed with vehicles as the primary user; little consideration has traditionally been given to non-motorized users.
Potential strategies
Speed management countermeasures references are available on FHWA's Speed Management website. FHWA has published desktop references that summarize studies about the effectiveness of engineering countermeasures in reducing crashes and managing speed.42 The CMF Clearinghouse provides a comprehensive database of CMFs along with supporting documentation to help agencies identify potential countermeasures and effectiveness.43
14 FHWA Office of Safety, "Focused Approach to Safety – Purpose of the Focused Approach" Web page. Available at: http://safety.fhwa.dot.gov/fas/. Accessed December 8, 2015. [ Return to note 14. ]
15 See Appendix A, Evaluation of the Role of Speeding in Crashes and Safety-critical Events. [ Return to note 15. ]
16 FHWA Office of Safety, "Roadway Departure Safety" Web page. Available at: http://safety.fhwa.dot.gov/roadway_dept/. Accessed December 8, 2015. [ Return to note 16. ]
17 Ibid. [ Return to note 17. ]
18 See Appendix A, Evaluation of the Role of Speeding in Crashes and Safety-critical Events. [ Return to note . ]
19 Additional resources are listed in Appendix C. [ Return to note 19. ]
20 FHWA developed USLIMITS2 to help practitioners set reasonable, safe, and consistent speed limits for specific roadway segments. It is applicable to all types of roads ranging from rural local roads and residential streets to urban freeways. For additional information, visit http://safety.fhwa.dot.gov/uslimits [ Return to note 20. ]
21 FWHA, Evaluation of Dynamic Speed Feedback Signs on Curves: A National Demonstration Project, FHWA-HRT-14-020 (Washington, DC: FHWA, January
2015). Available at: https://www.fhwa.dot.gov/publications/research/safety/14020/index.cfm
[ Return to note 21. ]
22 FHWA, "High Friction Surface Treatments Frequently Asked Questions" FHWA-CAI-14-019. (Washington, DC: FHWA, 2014). Available at: https://www.fhwa.dot.gov/innovation/everydaycounts/edc-2/pdfs/fhwa-cai-14-019_faqs_hfst_mar2014_508.pdf [ Return to note 22. ]
23 Safety EdgeSM provides a transition for vehicles to return to the pavement more smoothly and easily by shaping the edge of pavement to 30 degrees and eliminating vertical drop-off. More information on Safety EdgeSM is available at https://www.fhwa.dot.gov/innovation/everydaycounts/edc-1/safetyedge.cfm [ Return to note 23. ]
24 24 FHWA, A Desktop Reference of Potential Effectiveness in Reducing Speed, 2014, available at http://safety.fhwa.dot.gov/speedmgt/ref_mats/eng_count/2014/reducing_speed.cfm, and FHWA, A Desktop Reference of Potential Effectiveness in Reducing Crashes, 2014, available at http://safety.fhwa.dot. gov/speedmgt/ref_mats/eng_count/2014/reducing_crashes.cfm, accessed September 4, 2015 [ Return to note 24. ]
25 CMF Clearinghouse, available at: http://www.cmfclearinghouse.org [ Return to note 25. ]
26 FHWA Office of Safety, "Motorcycle Safety" Web page. Available at: http://safety.fhwa.dot.gov/motorcycles. Accessed December 8, 2015. [ Return to note 26. ]
27 Additional resources are listed in Appendix C. [ Return to note 27. ]
28 FHWA, "Red-Signal Enforcement Lights," FHWA-SA-09-005 (Washington, DC: FHWA 2009). Available at: http://safety.fhwa.dot.gov/intersection/resources/techsum/fhwasa09005 [ Return to note 28. ]
29 NHTSA, "Traffic Safety Facts, 2013 Data: Motorcycles," DOT HS 812 148 (Washington, DC: NHTSA, 2015). Available at: http://www-nrd.nhtsa.dot.gov/Pubs/812148.pdf [ Return to note 29. ]
30 FHWA, High Friction Surface Treatments Frequently Asked Questions, available at: https://www.fhwa.dot.gov/everydaycounts/edctwo/2012/pdfs/fhwa-cai-14-019_faqs_hfst_mar2014_508.pdf [ Return to note 30. ]
31 FHWA, A Desktop Reference of Potential Effectiveness in Reducing Speed, 2014, available at http://safety.fhwa.dot.gov/speedmgt/ref_mats/eng_count/2014/reducing_speed.cfm, and FHWA, A Desktop Reference of Potential Effectiveness in Reducing Crashes, 2014, available at http://safety.fhwa.dot.gov/speedmgt/ref_mats/eng_count/2014/reducing_crashes.cfm, accessed September 4, 2015. [ Return to note 31. ]
32 CMF Clearinghouse, available at: http://www.cmfclearinghouse.org/
[ Return to note 32. ]
33 FHWA, A Desktop Reference of Potential Effectiveness in Reducing Speed, 2014, available at http://safety.fhwa.dot.gov/speedmgt/ref_mats/eng_count/2014/reducing_speed.cfm, and FHWA, A Desktop Reference of Potential Effectiveness in Reducing Crashes, 2014, available at http://safety.fhwa.dot.gov/speedmgt/ref_mats/eng_count/2014/reducing_crashes.cfm, accessed September 4, 2015. [ Return to note 33. ]
34 The term bicyclist includes bicyclists and other cyclists including riders of two-wheel, non-motorized vehicles, tricycles, and unicycles powered solely by pedals. [ Return to note 34. ]
35 NHTSA, "Traffic Safety Facts, 2013 Data: Bicyclists and Other Cyclists," DOT HS 812 151 (Washington, DC: NHTSA, 2015). Available at: http://www-nrd.nhtsa.dot.gov/Pubs/812151.pdf [ Return to note 35. ]
36 Additional resources are listed in Appendix C. [ Return to note 37. ]
37 FHWA, Rectangular Rapid Flash Beacons (RRFB), FHWA-SA-09-009, May 2009. Available at: http://safety.fhwa.dot.gov/intersection/conventional/unsignalized/tech_sum/fhwasa09009/ [ Return to note 37. ]
38 FHWA, Pedestrian Hybrid Beacon, FHWA-SA-12-012, October 2014. Available at: http://safety.fhwa.dot.gov/provencountermeasures/fhwa_sa_12_012.cfm [ Return to note 38. ]
39 FHWA, Rectangular Rapid Flash Beacons (RRFB), FHWA-SA-09-009 (Washington, DC: FHWA, 2009). Available at: http://safety.fhwa.dot.gov/intersection/conventional/unsignalized/tech_sum/fhwasa09009/ [ Return to note 39. ]
40 FHWA, Road Diet Informational Guide, FHWA-SA-14-028 (Washington, DC: FHWA, November 2014). Available at: http://safety.fhwa.dot.gov/road_diets/info_guide [ Return to note 40. ]
41 FHWA, "Technical Advisory: Shoulder and Edge Line Rumble Strips," T 5040.39, Revision 1 (Washington, DC: FHWA, 2011). Available at: http://safety.fhwa.dot.gov/roadway_dept/pavement/rumble_strips/t504039 [ Return to note 41. ]
42 FHWA, A Desktop Reference of Potential Effectiveness in Reducing Speed, FHWA-SA-14-101 (Washington, DC: FHWA, 2015). Available at http://safety.fhwa.dot.gov/speedmgt/ref_mats/eng_count/2014/reducing_speed.cfm [ Return to note 42. ]
43 CMF Clearinghouse, available at: http://www.cmfclearinghouse.org [ Return to note 43. ]