U.S. Department of Transportation
Federal Highway Administration
1200 New Jersey Avenue, SE
Washington, DC 20590
202-366-4000
When contemplating an approach to understand the myriad of complex and interwoven factors and circumstances involved in speeding-related issues, practitioners sometimes ask "Where do I even start?" and "Which data are the most trustworthy?"
State crash reports use a variety of categories to describe speeding-related crashes: "exceeded speed limit," "too fast for conditions," "following too closely," "driving aggressively," etc. The assignment of these categories may be based largely on the perceptions or judgment of the responding law enforcement officers, introducing the potential for human error. Compounding this concern is that crash report categories may be imprecise; for example, driving "too fast for conditions" may not accurately or fully describe the circumstances surrounding the crash. As a result of these factors, many transportation agencies do not believe their speeding-related crash data is truly reflective of actual events and suitable for addressing speeding-related crashes.


A Systemic Safety Approach uses information from well-documented severe crashes (fatal and serious injury crashes) to help agencies define where future crashes may occur. Severe crash records have a greater accuracy than lesser crash severity records increasing an agency's certainty that these crashes are speeding-related and that the data are reliable. A Systemic Safety Approach uses severe crashes to identify the most prevalent crash types, facility types, and risk factors. This trilogy of characteristics enables an agency to identify locations with roadway characteristics similar to those of the known severe crash locations and preemptively prevent crashes from continuing to occur at those sites.
A Systemic Safety Approach uses speeding-related severe crash data to identify locations with similar risk characteristics that may experience a severe crash in the future.
The following steps are based on the process outlined in the FHWA's Systemic Safety Project Selection Tool.1
Examine the agency's speeding-related severe crash data to determine a focus crash type and select the crash type with the greatest number or greatest severity of crashes. Often, these crash types will be emphasis areas in a States' Strategic Highway Safety Plan (SHSP). Examples include:
The purpose for identifying a focus facility type is to take a very broad crash type (e.g., horizontal curves) and break it down into smaller groups based on location types that exhibit similar risk characteristics.
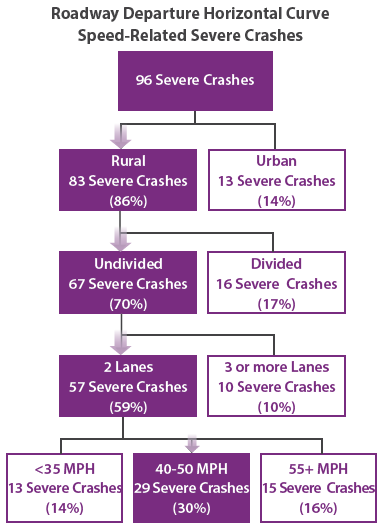
Consider using a crash tree diagram to break down crashes into progressively more detailed categories, as shown in the example to the right. The highest level of the crash tree begins with the total number of severe crashes in the focus crash type. In the example at right, the focus crash type is Speeding-related Horizontal Curve crashes. Each subsequent level separates the severe crashes by intrinsic roadway characteristics. The roadway characteristics with the greatest number of severe crashes are carried forward into the next level of the crash tree diagram.
The next step is to define, document, and assess the most common roadway characteristics, or risk factors, associated with the focus crash type and focus facility type. Again, an agency does not necessarily need a robust dataset to identify locations that can benefit from safety improvements. Examples of methods an agency can use to quantify roadway and intersection characteristics for risk factor evaluation include:
It's important to remember that a roadway feature itself is not the risk factor; rather, it is the degree to which the characteristic contributes to crash severity or frequency. For example, a 90 degree horizontal curve is more likely to contribute to a crash than a 5 degree curve. Translated: the 90 degree curve poses a greater risk for future crashes.
For information on identifying risk factors, practitioners can refer to the Highway Safety Manual (HSM) and the Federal Highway Administration's guidance on Potential Risk Factors.2 Agencies may also find that conducting field visits and speaking with field staff about their first-hand observations may aid in identifying risk factors.
A few of the many examples of potential risk factors include:
Note that practitioners can use the Highway Safety Manual and the Crash Modification Factor (CMF) Clearinghouse3 to estimate the degree to which each risk factor contributes to the overall reduced level of safety within the facility type.
Expand the vetting process from the severe crash locations (used to determine the focus group and risk factors) to all roads within the focus facility type. For each location, determine the number of risk factors (determined in Step 4) the site exhibits. This can be accomplished by using a roadway or intersection inventory, online aerial imagery, photo or video logs, or field visits. Rank locations based on the number of risk factors present. Some agencies choose to use a weighted ranking system, emphasizing roadway characteristics with greater risk. The result will be a ranked list with locations that have a high-risk of experiencing a severe crash in the future.
Countermeasure selection should be largely based on the risk factors identified. For example, if a narrow shoulder is a risk factor, then a countermeasure may be expanding shoulder widths. All risk factors may not be directly addressed by a countermeasure. For example, if a horizontal curve has narrow lanes, a tight radius, and no shoulders, then an appropriate countermeasure may be enhanced roadside delineation because it draws the motorist's eyes to these roadway characteristics. Directly addressing a risk factor by widening the road or straightening a curve may not be cost effective.
Once an agency has identified risk factors, it can consider the benefit-cost ratio of various countermeasures. The CMF Clearinghouse and other published resources can provide expected countermeasure safety benefits and the crash types they address.
A Systemic Safety Approach does not require robust data or complex analysis methods to be effective. Nearly all transportation professionals have access to the basic data needed to pursue systemic safety analysis and make appropriate systemic-based decisions. By identifying recurring risk factors using speeding-related severe crashes, agencies can treat the most at-risk facilities throughout their system using low-cost, effective speed-mitigation countermeasures.
For more information on a Systemic Safety Approach to Speed Management, visit:
For assistance, or to request technical support, contact:
Guan Xu
FHWA Speed Management Program Manager
Phone: 202-366-5892
Email: Guan.Xu@dot.gov
1 Federal Highway Administration, "Systemic Safety Project Selection Tool," FHWA-SA-13-019 (Washington DC: July 2013). Available at: https://safety.fhwa.dot.gov/systemic/resources.cfm.
2 Federal Highway Administration, Potential Risk Factors, Washington, D.C. (n.d.). Available at: https://safety.fhwa.dot.gov/systemic/pdf/FHWA_SystemicApproach_PotentialRiskFactors.pdf.
3 Federal Highway Administration, CMF Clearinghouse User Guide, Washington, D.C. Available at: http://www.cmfclearinghouse.org/userguide.cfm.
FHWA-SA-18-051

