U.S. Department of Transportation
Federal Highway Administration
1200 New Jersey Avenue, SE
Washington, DC 20590
202-366-4000
| ISSUE | STRATEGIES | TAKEAWAYS |
|---|---|---|
|
|
|
The City of Austin became a Vision Zero city in 2015 with the goal of zero traffic-related fatalities for this rapidly growing, diverse, and active community. Identifying a High Injury Network (HIN) exposed that the majority of fatal and serious injury crashes were occurring on collector and arterial streets. This perspective helped focus their program beyond neighborhoods and onto the more complex roadways which made up their HIN1.
Addressing speed limits on the HIN required consideration of the Texas Transportation Code which emphasizes an 85th percentile method be used for setting speed limits with allowances for other considerations, such as crash history and high driveway desnsity. The city determined that these considerations should be applied to roadways on the HIN based on their urban settings and operations; therefore, the city will be using USLIMITS2 extensively to support setting new speed limits on collector and arterial roadways. This moment represents a paradigm shift in how the city approaches transportation planning, codifying in city policy the preservation of human life as the paramount priority for Austin's transportation network. Citizens are asking for their transportation network to be safe, accessible, and inclusive for all members of the community. The city is determined to achieve this by promoting a culture of safety education, focusing on behaviors that cause traffic injuries and fatalities, and through integrating safe design principles across their multimodal infrastructure1.

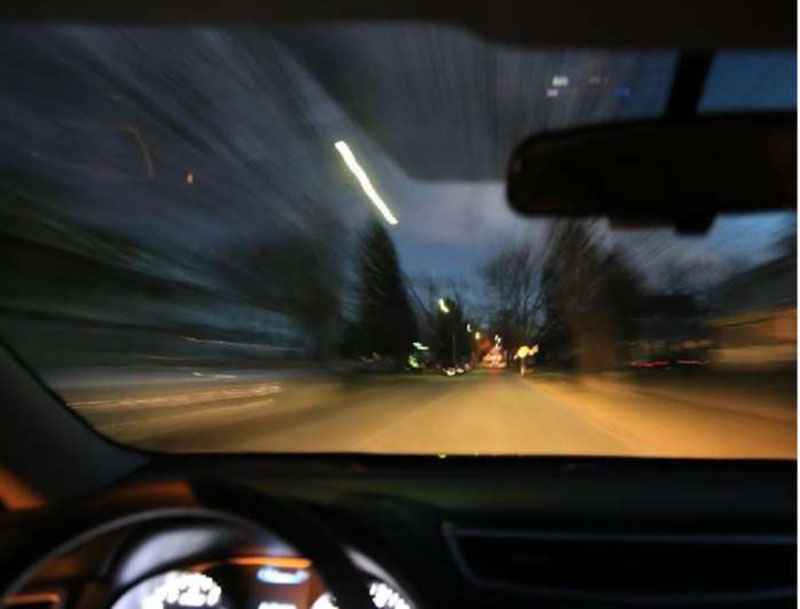
Interior of speeding vehicle. Source: Getty Images
In addition, the Austin Police Department is using a data-driven approach towards enforcement strategies. This includes participating in a Fatality Review Board, which meets monthly to review all fatal crashes, and then meets quarterly to review overall crash statistics and serious injury crashes2.

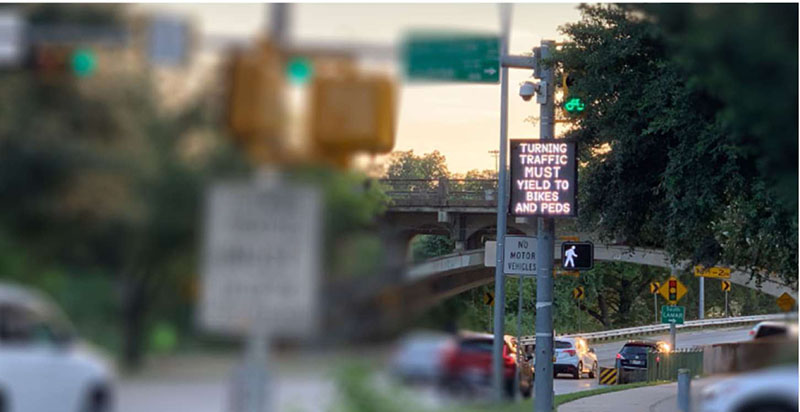
Austin's busy multimodal roadways. Image Source: Neal Hawkins
Speeding – In Austin, speeding was recorded as the primary contributing factor in 24 percent of traffic crashes resulting in death from 2013 to 2017. Speeding is the leading contributor to fatal crashes with the top four being speeding, failure to yield, distraction, and driving while intoxicated. On average, more than 70 people lose their lives on Austin area streets each year, another 450 suffer life-altering injuries, and countless other crashes and near-misses are unreported.
Vulnerable Road Users – The city found that vulnerable road users make up a disproportionate share of severe crashes. The proportion of all serious injury and fatal crashes by mode are 61 percent motor vehicle, 17 percent pedestrian, 16 percent motorcycle, and 6 percent bicycle. Austin's African-American population is also overrepresented given that their 7 percent share of the population makes up 16 percent of the serious injury and fatal crashes1.
Significant Growth – Since the last transportation plan was adopted in 1995, Austin has added more than 450,000 people and the region's population is slated to double in the next 30 years.
The objective of the Austin Transportation Department (ATD) speed management program is to improve safety and enhance the livability of Austin streets through context-appropriate speed reduction strategies2. ATD developed a framework for their new Speed Management Program through several actions including a workshop with ITE and the Vision Zero Network in February 2019 and in researching best practices from national studies and other leading cities. This framework relies on objective criteria, informed by community and policy objectives, to prioritize streets with the most serious speeding problems for targeted speed mitigation strategies3. The seven key Speed Management Program elements are as follows:
This approach provides different tools and strategies by roadway contextual factors applied to street levels including the following:

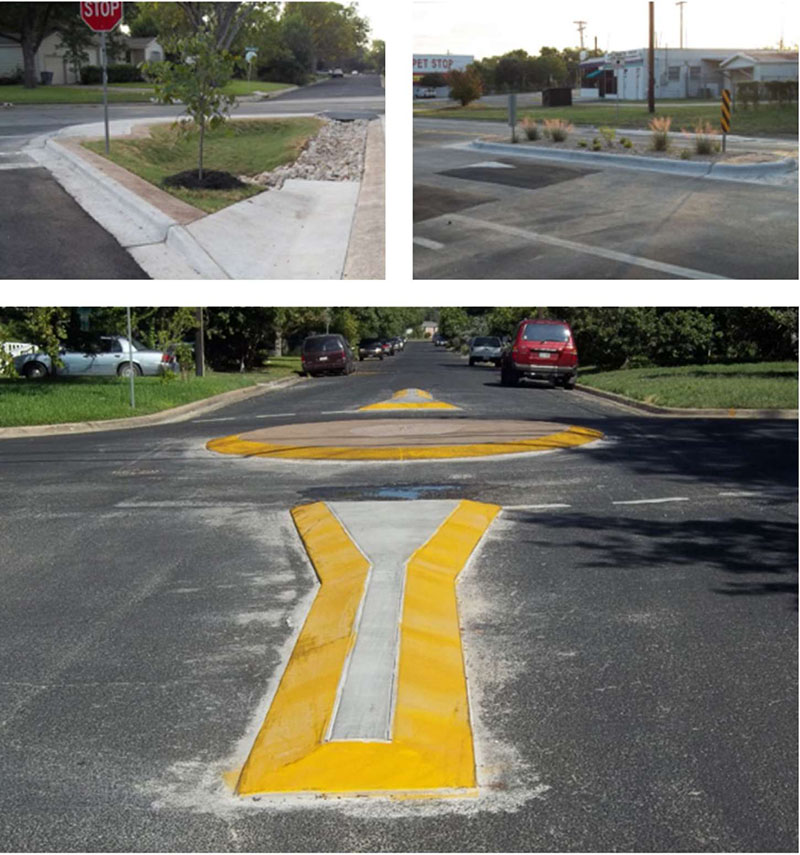
Images of several physical engineering countermeasures used are shown above: Rain Garden Bulb Out (top left), Median and Speed Cushions (top right), and Mountable Traffic Circles (bottom). Source: City of Austin
| <Previous | Table of Contents | Next > |
