U.S. Department of Transportation
Federal Highway Administration
1200 New Jersey Avenue, SE
Washington, DC 20590
202-366-4000
| ISSUE | STRfATEGIES | TAKEAWAYS |
|---|---|---|
|
|
|
Speeding is a contributing factor in almost one-third of fatalities and around 20 percent of serious injury crashes in New Zealand1,2. Additionally, roadway fatalities increased from 253 in 2013 to 373 in 2018 while serious injuries increased from 2,020 to 2,8363.
Historically speed limits in New Zealand were based on the number of access points and surrounding land use for a particular rather than considering roadway characteristics or safety performance.
To address concerns about speeding-related crashes, the New Zealand Transport agency developed the NZ Speed Management Guide which provides speed limits that are nationally consistent and evidence based2,4,. The resulting guide is an evidence-based, network-wide approach that recommends speed limits that are safe and appropriate based on road function, design, safety, and land use.
The objectives of the guide are the following5:
Speeding contributes to 1/3 of fatalities in New Zealand and is noted as being on par with drunk driving as their biggest safety problem2.
A recommended speed limit for each roadway type is developed based on various characteristics such as geometry, land use, roadside hazards, etc. An Infrastructure Risk Rate (IRR) is developed for each corridor based on the following and an IRR score is given (1 = low to 5 = high risk):

Speeding Vehicle. Source: Getty Images
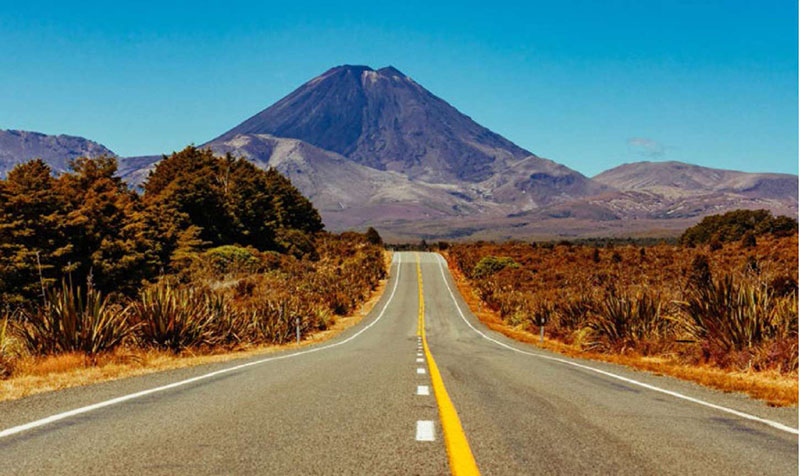
Typical rural road in New Zealand. Source: Getty Images
A measure of safety risk (low-to-high) is also assigned based on crash density and crash rate6. The IRR score is combined with safety risk and roadway function and a safe and appropriate speed recommended. The guide lays out principles for setting speed limits and applying speed management measures to ensure they are consistent across similar roadway types in a network4. A matrix was developed which recommends safe and appropriate speeds for a particular road class. An example of recommended speeds for a few roadway types is shown in Table 1.
Table 1: Example of Recommended Speeds for Select Road Types
| Roadway Function | Road Safety Metric | Infrastructure Risk Rating | Safe and Appropriate Speed |
|---|---|---|---|
|
|
|
80 km/h |
|
|
|
60 km/h |
|
|
|
50 km/h |
*One Network Road Classification **Risk is further defined in the NZ Speed Management Guide
The New Zealand Transport agency develops a map for each Road Controlling Agency, which shows where existing speed limits differ from the recommendations, and identifies where speed management will have the most benefit. Maps are developed using land use, speed limits, current operating speeds, and a measure of risk for the corridor4.
The network map is created by comparing existing speed limits against the recommended ones. Corridors with a safety issue and current travel speeds and speed limit above the calculated safe and appropriate speed are identified. The next step is to determine what type of intervention should be done for those corridors. Economically important roads where there is a strong case for investment are targeted for geometric improvements such as by-passes. When corridors do not meet these criteria, discussions are made about lowering the speed limit or employing lower-cost countermeasures. Finally, in locations where current travel speeds are below the current speed limit, lowering the speed limit is recommended to be consistent4.
61 percent of fatal crashes were found to occur on roadways where the calculated "safe and appropriate speed" was below the currently posted speed limit.
The speed management guide was used to develop a tool called "Mega Maps" which assigns speeds within a particular network area based on factors from the NZ Speed Management Guide2. Application of the tool for fatal road crashes in 2018 found 61 percent of fatal crash sites had a calculated "safe and appropriate speed" that was below the currently posted speed limit at that site2. This information allows agencies to better target speed limits for high-risk roadways.
New Zealand has also announced a $1.4 billion investment in road safety over the next 3 years with half of the funds allocated to state highways and half allocated for local roads. Improvements include the use of median and side barriers, rumble strips, and should widening3.
In Auckland, around 750 km of roads are being treated. The focus is on the top 10 percent high risk areas5.
Data-driven approach – New Zealand used a data-driven approach that can be replicated by other agencies. Speed limits were assigned based on an assessment of roadway characteristics (i.e., width, volume, and alignment) as well as crash density and rate. A measure of safety risk is assigned. In addition to having a clear metric for assigning speed limits, the concept of risk can be explained to agencies and the public more easily.
Outreach – As NZ began implementing the guide and tool they found some resistance. For instance, the use of the guide and tool resulted in speed limits on a large number of roadways being classified as "too high." One source reported that 87 percent of speed limits in New Zealand are too high according to the tool with only 5 percent of open roads warranting the current 100 km/h speed limit. Others expressed concerns that blanket reductions could weaken the economy by increasing time for businesses to move freight7.
To address these concerns, New Zealand found engagement and outreach were an important part of the process. Their approach and perspective for implementation included the following:
| <Previous | Table of Contents | Next > |

