U.S. Department of Transportation
Federal Highway Administration
1200 New Jersey Avenue, SE
Washington, DC 20590
202-366-4000
(Note: This document has been converted from the original document to 508-compliant HTML. The formatting has been adjusted for 508 compliance, but all the original text content is included, plus additional text descriptions for the images, photos and/or diagrams have been provided below.)
Source: Getty Images
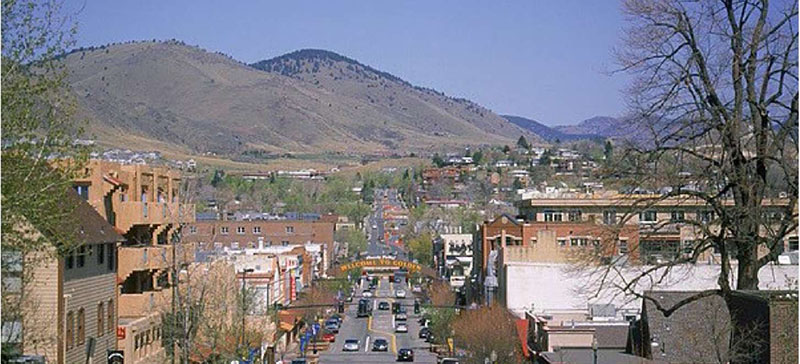
Speed Management ProgramCity of Austin, TX |
 |
Self-Enforcing RoadwaysCity of Golden, CO |
 |
Setting Credible Speed LimitsNew Hampshire DOT |
 |
High-Visibility EnforcementCity of Oro Valley, AZ |
 |
Successful Strategies for Adoption of Safety CamerasNew York City, NY |
 |
Targeted Reporting of Speeding Related CrashesArizona DOT |
 |
Consistent Speed Limits for Vulnerable Road UsersVarious Agencies |
 |
Network Approach to Setting Speed LimitsNew Zealand |
 |
| ISSUE | STRATEGIES | TAKEAWAYS |
|---|---|---|
|
|
|
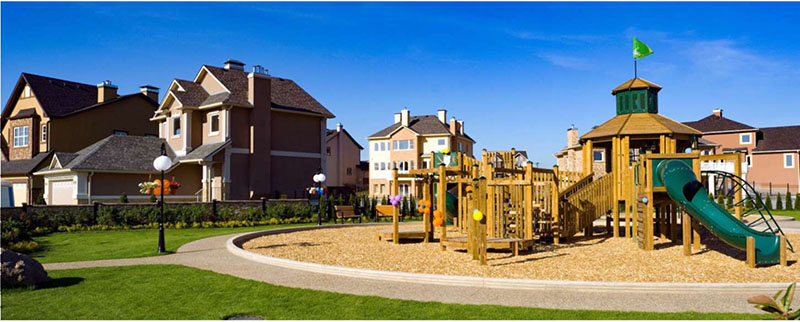
The City of Austin became a Vision Zero city in 2015 with the goal of zero traffic-related fatalities for this rapidly growing, diverse, and active community. Identifying a High Injury Network (HIN) exposed that the majority of fatal and serious injury crashes were occurring on collector and arterial streets. This perspective helped focus their program beyond neighborhoods and onto the more complex roadways which made up their HIN1.
Addressing speed limits on the HIN required consideration of the Texas Transportation Code which mandates an 85th percentile method be used for setting speed limits with allowances made where crashes are above average. The city determined that any roadway on the HIN meets the state's definition of roadways with above average crash rates and therefore will be using USLIMITS2 extensively to support setting new speed limits on collector and arterial roadways. This moment represents a paradigm shift in how the city approaches transportation planning, codifying in city policy the preservation of human life as the paramount priority for Austin's transportation network. Citizens are asking for their transportation network to be safe, accessible, and inclusive for all members of the community. The city is determined to achieve this by promoting a culture of safety education, focusing on behaviors that cause traffic injuries and fatalities, and through integrating safe design principles across their multimodal infrastructure1.
Interior of speeding vehicle. Source: Getty Images
In addition, the Austin Police Department is using a data-driven approach towards enforcement strategies. This includes participating in a Fatality Review Board, which meets monthly to review all fatal crashes, and then meets quarterly to review overall crash statistics and serious injury crashes2.
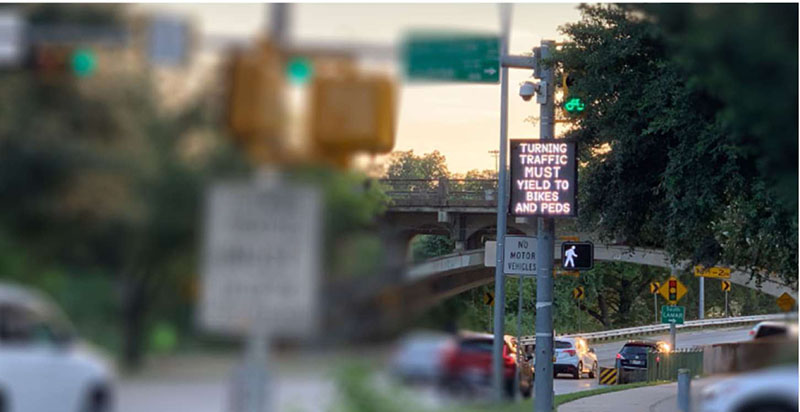
Austin's busy multimodal roadways. Image Source: Neal Hawkins
Speeding – In Austin, speeding was recorded as the primary contributing factor in 24 percent of traffic crashes resulting in death from 2013 to 2017. Speeding is the leading contributor to fatal crashes with the top four being speeding, failure to yield, distraction, and driving while intoxicated. On average, more than 70 people lose their lives on Austin area streets each year, another 450 suffer life-altering injuries, and countless other crashes and near-misses are unreported.
Vulnerable Road Users – The city found that vulnerable road users make up a disproportionate share of severe crashes. The proportion of all serious injury and fatal crashes by mode are 61 percent motor vehicle, 17 percent pedestrian, 16 percent motorcycle, and 6 percent bicycle. Austin's African-American population is also overrepresented given that their 7 percent share of the population makes up 16 percent of the serious injury and fatal crashes1.
Significant Growth – Since the last transportation plan was adopted in 1995, Austin has added more than 450,000 people and the region's population is slated to double in the next 30 years.
The objective of the Austin Transportation Department (ATD) speed management program is to improve safety and enhance the livability of Austin streets through context-appropriate speed reduction strategies2. ATD developed a framework for their new Speed Management Program through several actions including a workshop with ITE and the Vision Zero Network in February 2019 and in researching best practices from national studies and other leading cities. This framework relies on objective criteria, informed by community and policy objectives, to prioritize streets with the most serious speeding problems for targeted speed mitigation strategies3. The seven key Speed Management Program elements are as follows:
This approach provides different tools and strategies by roadway contextual factors applied to street levels including the following:
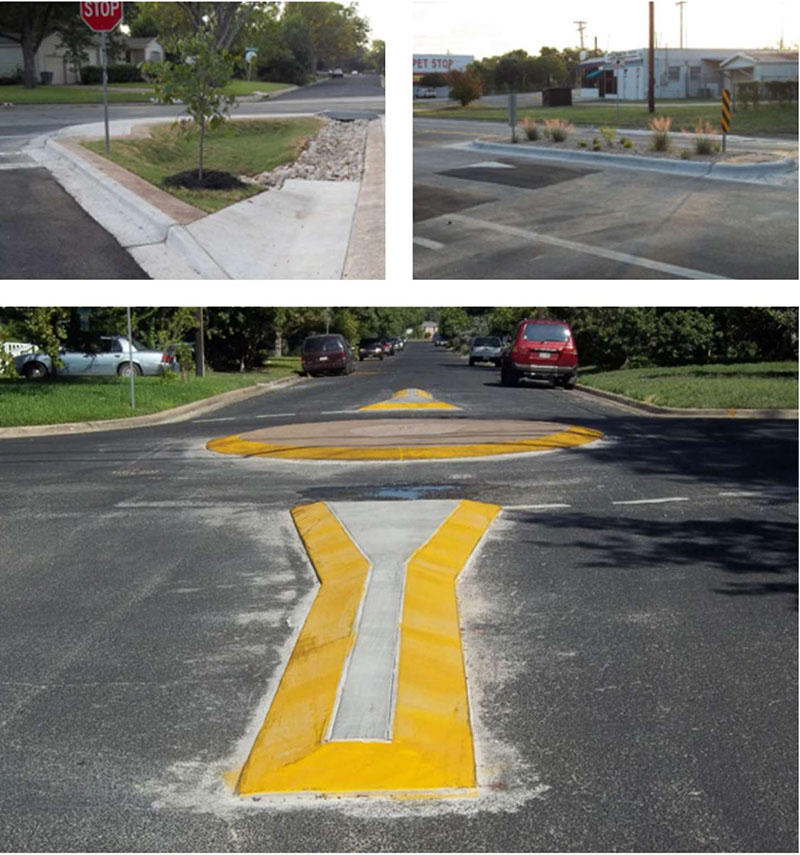
Images of several physical engineering countermeasures used are shown above: Rain Garden Bulb Out (top left), Median and Speed Cushions (top right), and Mountable Traffic Circles (bottom). Source: City of Austin
| ISSUE | STRATEGIES | TAKEAWAYS |
|---|---|---|
|
|
|
A self-enforcing road is a roadway that is planned and designed to encourage drivers to select operating speeds in harmony with the posted speed limit. Properly designed self-enforcing roadways can be effective in producing speed compliance and may contribute to less severe crash outcomes1.
The City of Golden, Colorado is located west of Denver at the base of the Rocky Mountains. It is both a residential community as well as home to the Coors Brewery and Colorado School of Mines. South Golden Road is one of the major arterials in town with a long-standing history of being a major thoroughfare2.
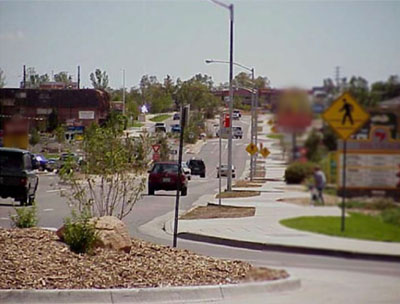
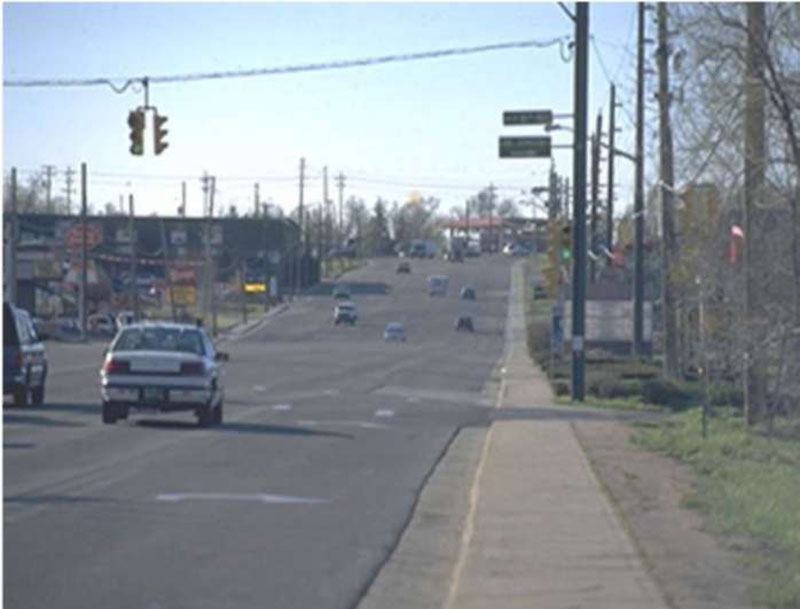
In 1999, plans for a new shopping center along South Golden Road elevated citizens' concerns about traffic speeds as well as pedestrian and bicycle safety along the corridor (see South Golden Road photo).
In response, the city rebuilt South Golden Road using design elements to address speeding, access, and overall safety. The self-enforcing design replaced traffic signals with roundabouts and addressed vulnerable road user safety3.
South Golden Road before improvements. Source: Dan Hartman, City of Golden, CO.
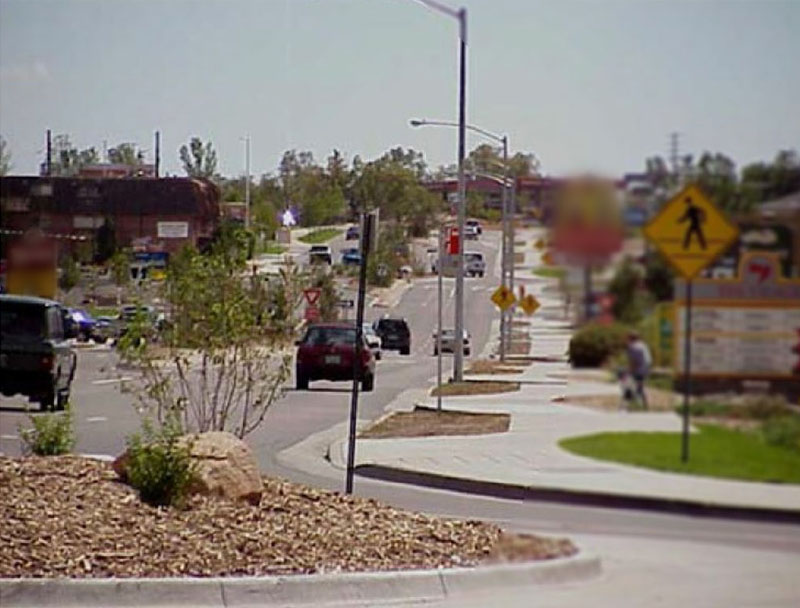
South Golden Road after improvements. Source: Dan Hartman, City of Golden, CO.
Golden, Colorado. Source: Getty Images
Prior to improvement – South Golden Road was a very wide (80 foot) street to cross and consisted of four through lanes plus a center turn lane. The corridor was capable of handling the 20,000 vehicles per day, however, the frequent points of access from business and side streets created operational and safety issues. The half-mile section of South Golden Road included two signalized intersections at Johnson Road and Ulysses Street and two stop-controlled intersections at Lunnonhaus Drive and Utah Street. The corridor was experiencing a number of issues including speeding between intersections, traffic conflicts at intersections for vehicles, pedestrians, and bicycles, and significant delays especially at Utah Street. Prior to improvement, the posted speed limit was 35 mph and the measured 85th percentile speed was 48 mph. The corridor experienced an average of four crashes per month with at least one of these involving an injury3.
Community Input – The city initiated a study that included community input to identify the most viable alternatives for improvement. The study established the following goals for South Golden Road:
Design Process – The city considered a range of improvement options, researched roundabout design opportunities, and then gained feedback from the community through public meetings, discussions with businesses, and at public hearings with City Council. The resulting two design options were the following:
The city's efforts led to the ultimate choice for Option 2 (roundabouts) where the design supports speed compliance even with a 25 mph speed limit in addition to enhancing access, operations, and safety for all users. The roundabouts were constructed in 1998 – 1999 and were fully operational in late 1999 (see South Golden Road after improvements photo).
Once constructed, the city was pleased to report that the new design was in fact supporting speed compliance as well as safety as noted by several metrics.
The City of Golden established corridor goals that resulted in eliminating a very wide, high-speed roadway that was experiencing safety and mobility issues. Instead of adding more traffic signals and stepping up police enforcement due to increasing vehicle speeds, they chose a roadway redesign including roundabouts and medians which was found to not only improve both operations and safety but to also provide a showcase community space which is aesthetically pleasing and has continued to accommodate all users in terms of traffic growth and safety.
| ISSUE | STRATEGIES | TAKEAWAYS |
|---|---|---|
|
|
|
New Hampshire DOT (NHDOT) is working to promote "reasonable and safe" speed limits for conditions and in a number of instances found that raising the existing speed limit was the appropriate solution.
Establishing and managing credible speed limits impacts safety. Community safety often suffers when we reduce speed limits in reaction to an event without considering the context and operations of the roadway. Educating the public one town or one highway segment at a time takes a lot of effort and it is not always received well. However, when explaining why a speed limit should fit the character of the roadway, the NHDOT has been pleasantly surprised by the number of people that seem to "get it." (B. Lambert, interview with the author, December 30, 2019).
There is a general consensus that where traffic speeds are a concern, lowering the speed limit is the perceived solution even if it is understood that the requested speed limit value is well below what is considered "reasonable and safe" for conditions.
Decades of questionable speed limit practice have resulted in a network of speed limits that are not always credible with respect to actual conditions thus contributing to a culture that treats the speed limit as a minimum, not a maximum value.
This culture is often reinforced through the actions of the courts where law enforcement is rumored to be forced to include a tolerance of as much as 10-15 mph over the posted speed limit to secure speeding convictions. (B. Lambert, letter to DOS/Chiefs of Police, November 5, 2019).
NHDOT has worked with a number of communities to address locations where posted speed limits were out of character for the conditions thus creating both safety and enforcement concerns.
| Roadway | Speeds (mph) | ||
|---|---|---|---|
| Posted | 85th Percentile | Difference | |
| US Route 3 at NH Route 28 | 40 | 58 | 18 |
| Wakefield NH 153 | 35 | 49 | 14 |
| Wakefield NH 153 | 35 | 46 | 11 |
| Wakefield NH 153 | 35 | 47 | 12 |
| Hancock, US Route 202 | 45 | 55 | 10 |
| Hancock, US Route 202 | 40 | 56 | 16 |
| Candia, NH Route 27 | 35 | 48 | 13 |
Table 1 shows the excessive speeds observed where posted speeds were ultimately increased.
Table 1. Spot speed study examples
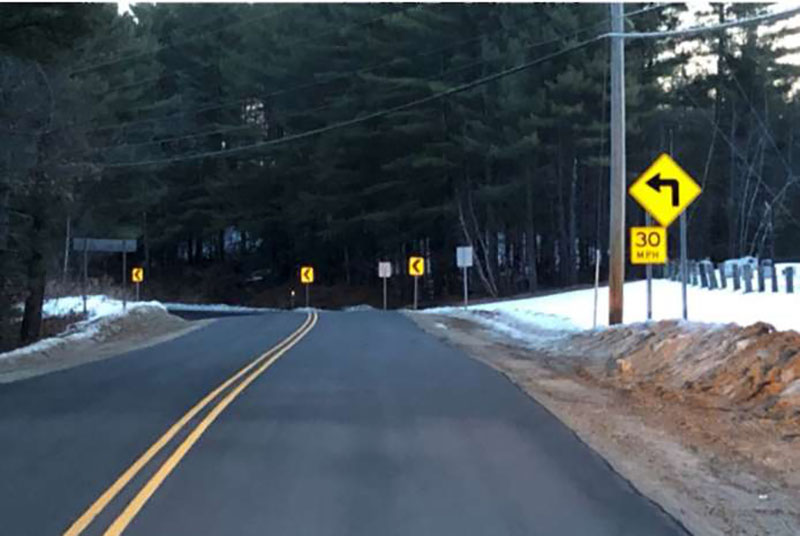
Curve warning signage in Wakefield, NH. Image Source: Bill Lambert, NHDOT
When NHDOT presents this information to communities, they also show how speed limits have a relationship with other traffic control devices. For example, required passing sight distance and curve warning signage are a function of the posted speed limit and mid-block crosswalks are not allowed where posted speed limits are greater than 40 mph (see Curve warning signage photo).
NHDOT also emphasizes to communities that speed limits need to be credible for the character of the road, including horizontal and vertical geometry, lane widths, on-street parking, roadside amenities, adjacent land uses, and all roadway users.
A credible speed limit should result in voluntary compliance by the majority of drivers based on these criteria. They note that if there is a desire to have lower speeds, it can only be achieved if the character of the road is also changed.
One thing that NHDOT always points out to communities is that by recommending an increase in the speed limit, they are not advocating that traffic speeds be increased beyond existing conditions, they are advocating that speed limits reflect the true nature of the segment so they are more likely to be respected as a reasonable and safe maximum.
NHDOT has reviewed—and where appropriate—increased speed limits within a number of communities based on traffic and engineering investigations. For example, within the communities of Wakefield and Candia, the posted speeds were changed from 35 to 45 mph.
Specific to Candia, records indicated that the 35 mph speed limit was established at approximately the same time as when traffic signals were installed (roughly 1967). Current practice would not consider the presence of a traffic signal as a reason for reducing the speed limit. The Bureau of Traffic conducted an engineering and traffic investigation with the MUTCD practice for determining credible speed limits being that they are set within 5 mph of the measured 85th percentile speed. NHDOT also used a web-based program produced by FHWA, USLIMITS2, to compare the results. This considered several other factors, including traffic volume, road character, and crash history to determine a recommended speed limit.
On review of the engineering and traffic investigation with enforcement, there was agreement that increasing the posted speed limit through the traffic signal controlled intersection to 45 mph would be more credible, and therefore more enforceable, than the current 35 mph speed limit. The new 45 mph posted speed required that the nearby traffic signals adjust for "dilemma zone" protection.
In Wakefield, the local police chief struggled to enforce the 35 mph speed limit. If motorists were stopped and ticketed at 45-50 mph, they were essentially penalized for traveling at a speed that was reasonable and safe for conditions; however, if they were stopped and ticketed at 60-65 mph, a speed that was considered marginally excessive, they were required to appear in court and faced a much stiffer penalty due to the fact that they were stopped at 25 mph over the posted speed limit. The DOT worked cooperatively with local police to complete an engineering and traffic investigation that supported increasing the speed limit to 45 mph.
Prior to replacing the speed limit signs, the DOT evaluated the horizontal alignment signing and passing zones based on the proposed speed limit and determined that an additional 200 horizontal alignment signs were added over approximately 12 miles, arguably providing additional safety information for the majority of drivers1.
| ISSUE | STRATEGIES | TAKEAWAYS |
|---|---|---|
|
|
|
The Oro Valley Police Department (OVPD) has created a data-driven initiative to improve traffic safety in the town of Oro Valley, Arizona. The program is called "HiVE" or High Visibility Enforcement, designed to target intersections that have high crash rates. HiVE is described as an "educational" initiative rather than a strict enforcement detail with the following two primary components:
OVPD reminds motorists not to engage in distracted driving or other driving behaviors that contribute to avoidable injury or fatal vehicle crashes.
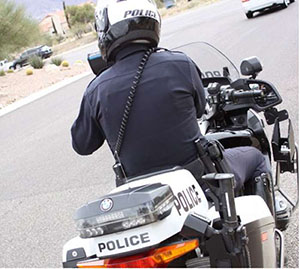
When injury crashes reached an all-time high in Oro Valley, the Police Department held its first series of HiVE deployments for its motorcycle officers with the goal of increasing awareness and safety. At that time, two intersections, see Table 1 accounted for roughly 20 percent of all injury-related crashes so the department sought to change driving behavior by implementing the following 1:

HiVE enforcement using motorcycles. Image Source: ORO Valley Police

HiVE logo used for communications. Source: Oro Valley Police
Over a 3-year period, OVPD conducted 142 HiVE deployments resulting in 4,005 traffic stops. Given the focus on education, this resulted in only 1 in 5 drivers receiving a moving violation citation. OVPD made a concerted effort to be transparent in the results of each deployment and in providing a 3-year analysis of crashes since the program began.
OVPD is working hard to show transparency to the public and to work with media outlets on the HiVE program. However, since this is a continuous program, it takes repeated efforts to ensure that messaging is consistent and that it accurately reflects the program's intent. Several lessons learned include the following:
Diligent Messaging – Do not let the media change the message. The police department has to be diligent in avoiding negative messaging such as:
When these messages appear OVPD works with the media outlets to make sure citizens are informed well ahead of any deployments and to stress the education components, (see example public message months in advance of deployment2).
The Oro Valley Police Department (OVPD) will be conducting its "High Visibility Enforcement" (HiVE) efforts during the months of April and May on Oracle Road and Magee. OVPD hopes to increase awareness and reduce collisions related to speed, inattention, following too close, and failing to yield to other drivers.
OVPD will deploy motorcycle officers on the following dates:
| Tuesday, April 16, 2019 | 7:00 a.m. to 10:00 a.m. |
| Thursday, May 2, 2019 | 4:00 p.m. to 7:00 p.m. |
| Tuesday, May 14, 2019 | 7:00 a.m. to 10:00 a.m. (distracted driving deployment) |
| Wednesday, May 29, 2019 | 7:00 a.m. to 10:00 a.m. |
Motorists are asked to be aware of the additional enforcement activity and drive safely. If you have any questions about this release or traffic related issues in Oro Valley, please contact (Officer Name, Phone Number).
Example public message in advance of enforcement actions.
Data Driven – OVPD conducted a study, measuring crashes before and during the HiVE program as shown in Table 1. On average, these two signalized intersections experienced 25 fewer crashes each year. A comparison of injury related crashes showed a 42 percent reduction at Oracle Road and Suffolk Drive and 15 percent reduction at Oracle Road and Magee Road.
Long Term Focus – OVPD continues to operate the HiVE program and believe that it is making a difference increasing awareness and reducing avoidable crashes related to speed, inattention, following too close, and failing to yield to other drivers.
Table 1. Crash frequency comparison before and during HiVE
| Intersection | Pre-HiVE (2010-2012) | HiVE (2013-2015) | Crash Reduction |
|---|---|---|---|
| Oracle Rd. at Suffolk Dr. | 124 |
72 |
-42% |
| Oracle Rd. at Magee Rd. | 144 |
123 |
-15% |
| Intersections Combined | 268 |
195 |
-27% |
| ISSUE | STRATEGIES | TAKEAWAYS |
|---|---|---|
|
|
|

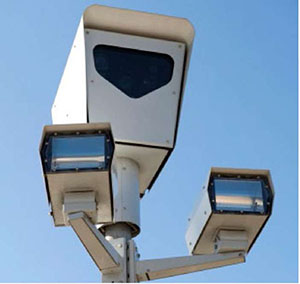
Safety Camera. Source: Getty Images
Speed is a persistent traffic safety issue; particularly in areas with high pedestrian and/or bike users. One effective enforcement strategy that has been utilized is Automated Speed Enforcement (ASE), more recently termed "safety cameras."
However, agencies have often struggled with implementing safety cameras due to citizen concerns, legislative resistance, speeding not being perceived as a safety issue, and privacy issues1. Implementation has also battled the perception that automated enforcement is a "money grab."
Due to the high number of pedestrians and bicyclists, New York City (NYC) had a particular interest in the use of safety cameras. In 2013, pedestrian and bicyclist crashes accounted for 28 percent of all police reported crashes but made up 65 percent of fatalities in New York City. Additionally, unsafe speed was noted as a contributing factor in 7 percent of all crashes but accounted for 25 percent of fatal crashes2.
New York City faced typical oppositions to safety cameras such as legislative restrictions and citizen resistance. They successfully instituted a safety camera program in school zones through several strategies.
The first factor for success in NYC's adoption of safety cameras and addressing crashes in general was the use of a data-driven approach. For instance, the New York Police Department (NYPD) combats traffic crashes by identifying traffic violations that have the greatest impact on crash severity and then focuses on changing the driver behaviors that contribute to these crashes.
Under Vision Zero, crash data were utilized to identify the following six violations that had the greatest impact on safety3:
Corridors for improvements were identified based on where pedestrian deaths and severe injuries were the most concentrated4 and in some cases challenged conventional wisdom about what streets had safety issues. For safety cameras, sites were selected by ranking school zones according to the number of traffic injuries during school hours on school days. Site selection also included the use of speed data, roadway geometry, engineering judgment, and areas identified within Pedestrian Safety Action Plans5.
Another factor for success was the active participation of advocacy and community organizations. Groups such as Transportation Alternatives and Families for Safe Streets helped elevate road safety as a priority of the city. Advocacy included events, petitions, use of technical statistics along with personal stories, and even working with faith-based organizations within communities5,6.
Another example was a joint venture between the NYPD and NYDOT to conduct on-street outreach. The Vision Zero Street Teams identify corridors with a significant crash history and pinpoint the types of crashes that occur. Next, the NYPD and NYDOT staff distribute fliers to pedestrians and drivers with safety tips that correspond to the most serious crashes along that corridor. The NYPD also targets enforcement resources to address the violations related to identified crash types3.
Other advocacy and outreach strategies include ads on television, radio, bus stops, and billboards to educate aggressive drivers about the consequences of negative behavior. Results have shown 72 percent of drivers recall having seen the media campaign5.
Advocacy was also critical in the initial implementation of the safety cameras. Later when NYC's authority to use safety cameras was set to expire in July 2018 after the state legislature failed to reach a compromise on extension, advocacy groups pushed for a special session to vote on the proposed bill. Advocacy groups directly contacted legislators to encourage them to vote7. The bill was ultimately passed.
Another important factor for success was the use of a comprehensive approach. Safety cameras were one piece of a comprehensive strategy4 to address pedestrian and bicyclist safety. For instance, NYC was the first to implement a Vision Zero policy. This included developing a pedestrian safety action plan for each of the City's five boroughs. Safety engineering projects were completed in areas with high rates of severe pedestrian crashes. NYC was able to implement countermeasures at almost 90 percent of priority corridors and intersections and 461 safety engineering projects have been completed4.
Engineering strategies have included the installation of Leading Pedestrian Interval (LPI) which gives crossing pedestrians a "head start" before vehicles begin to turn with around 2951 LPIs installed4. Left turn speed management was also instituted based on findings of a study of the interaction between left turn speeds and pedestrian safety and included the use of paint, flexible delineators, and rubber speed bumps. Other engineering countermeasures include bus boarding islands, speed cushions, dedicated bike lanes, roadway redesign, raised crosswalks, rubber pedestrian refuge islands offset crossings, and improved lighting3,4.
Enforcement has also played a role. In addition to playing a key role in Vision Zero, NYPD assesses speeding conditions in conjunction with the NYDOT and identifies solutions including increased enforcement.
New York conducted a safety camera pilot program in 20 school zones starting in 2013, using fixed and mobile cameras. A data-driven approach was used to determine locations. Cameras were placed on streets within a quarter mile of selected schools. The system was specifically targeted to school safety. The cameras operate 1 hour before and 1 hour after school activities and the speed threshold was set at 10 mph over the speed limit. Additionally, data collected from the program cannot be used for unrelated purposes.
The program was expanded to 140 school speed zones in 20145 and will further expand to be the largest urban network of safety cameras in the US (2,000 cameras in 750 areas within a quarter mile of a school)8. More recently hours of operation were expanded9.
NYC use of safety cameras has shown significant success. A 63 percent decrease in speed in school zones where safety cameras were present has been reported. Additionally, a 15 percent decrease in crashes, a 17 percent reduction in injuries, and a 55 percent reduction in fatalities have occurred in school zones with safety cameras5. By 2018, the daily rate of camera violations had decreased by 60 percent and only 19 percent of violations are repeat offenders3.
NYC has also reported success in addressing pedestrian safety overall. From 2008 to 2017 pedestrian fatalities in urban areas nationally increased by around 46 percent. Over that same time period, pedestrian fatalities in NYC dropped 31 percent. Additionally, a 36 percent decline in pedestrian fatalities has occurred at Vision Zero priority locations4.
Data driven – Successful adoption of safety cameras was due to NYC being able to respond to the key concerns about them. One strategy was use of a data-driven approach which highlighted the crash problem and focused on areas where safety issues existed. Camera locations were also selected using a data driven strategy.
Comprehensive strategy – NYC also used a comprehensive approach to address safety from a broad perspective which included utilizing a number of other countermeasures. This demonstrated safety cameras were just one piece of a larger strategy to address safety. Additionally, the use of a comprehensive approach addressed the problem from multiple angles rather than relying on one solution.
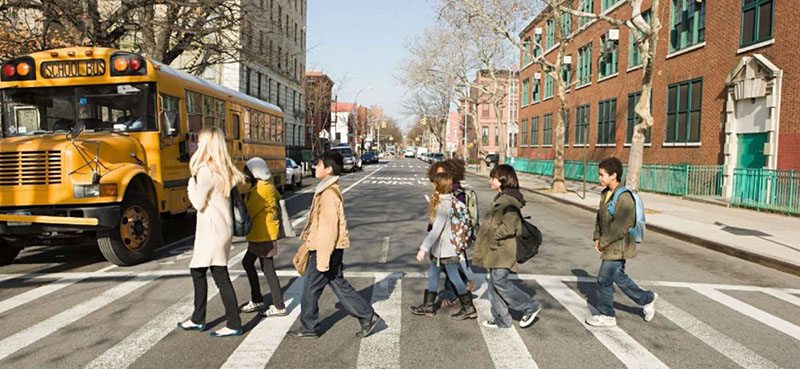
School Children crossing a street in NYC. Source: Getty Images
Advocacy – Another key strategy was extensive outreach and advocacy activities. Educating the public helps them understand the problem and get buy-in. Citizen advocates were key since they demonstrated to both legislators and the public that speeding is a concern.
Continued vigilance – Another lesson learned is that continued vigilance is needed. After initial implementation in 2013, NYC's authority to use safety cameras was set to expire in July 2018 after the state legislature failed to reach a compromise on extension. This required additional effort by the city and advocacy groups to ensure the program stayed active and was ultimately expanded.
Safety camera thresholds – Although not specific to the NYC case study, a general takeaway from the application of safety cameras is the use of thresholds. Most agencies set the system to activate at some threshold over the posted speed limit. This is generally 5 or 10 mph over. In the NYC program, a 10 mph threshold was utilized. Selecting a threshold over the speed limit is a typical approach, since most agencies do not want to ticket drivers right at the speed limit. It also allays concerns that the system is unfairly ticketing drivers and being used for revenue. However, once drivers become aware of the threshold, in reality, the target speed for drivers is likely to be the threshold limit rather than the actual speed limit. As a result, agencies should consider what the target speed is in selecting a threshold.
| ISSUE | STRATEGIES | TAKEAWAYS |
|---|---|---|
|
|
|
Speed Too Fast for Conditions (STFC) is a field provided on most agency crash forms. The intent is to label scenarios where a driver was traveling below the posted speed limit but the speed at the time of the crash was not appropriate for prevailing environmental conditions and was a contributor to the crash. However, significant variations exist in interpreting the definition of the environment when coding crash forms. As a result, it is often left to the attending officer's interpretation.
In Arizona, historically STFC was defined as "Traveling at a speed that was unsafe for the road, weather, traffic or other environmental conditions at the time." In many cases, an officer would include the behavioral or human environment and could interpret driver incapacity (Driving Under the Influence (DUI), impaired, distracted, fatigued) as a condition that would warrant traveling at a lower speed regardless of actual roadway conditions. For instance, a drunk driver on dry daytime roads traveling under the speed limit could be coded as Speed Too Fast for Conditions if the officer felt the state of impairment warranted a lower speed. Depending on the attending officer's interpretation, there may be scenarios in which no speed is safe for conditions1. While it is important to address these crashes, solutions should focus on the root cause of the crash when feasible. Countermeasures geared specifically towards speeding, such as Dynamic Speed Feedback Signs (DSFS), lane narrowing, or use of landscaping, may be less effective when the driver is impaired. Rather areas with a high number of impaired crashes should be targeted with countermeasures that address the impairment, such as enforcement.

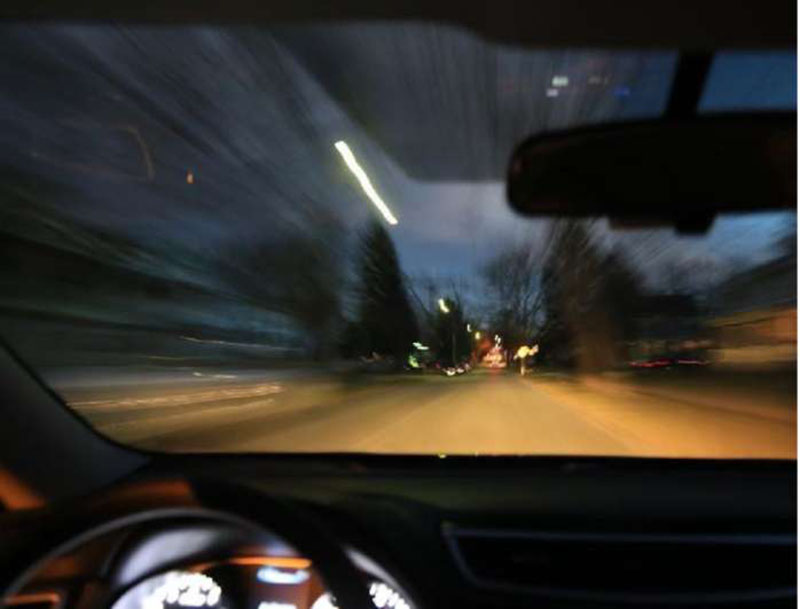
Speeding Vehicle. Source: Getty Images
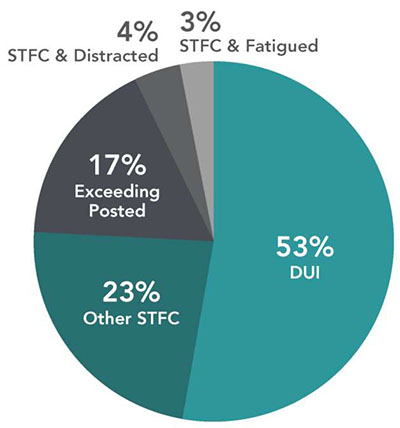
Around one-third of Arizona fatal crashes were coded as speeding related between 2012 and 2016 and over 53 percent of those fatal crashes were also coded as impaired but below the posted speed limit1,2,3.
Correcting the interpretation of behavioral conditions would have removed crashes such as DUI (53 percent), distracted (4 percent), sleeping or fatigued (3 percent) that were not marked as exceeding the posted limit and where no speed would have otherwise been reasonable. This would have reduced the number of crashes during this period that were coded as speeding related (Speed exceeded the limit and STFC) from over 33 percent down to approximately 11 percent of total fatalities.
As a result, Arizona made the decision to address the issue by providing clear instructions and training that would remove DUI and other impaired crashes from the category of STFC. In this manner locations with actual speeding-related issues can be better targeted1.

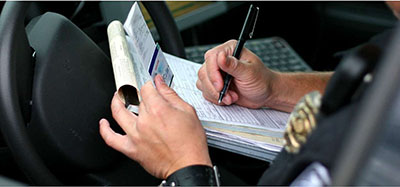
Officer uses driver information to complete a traffic ticket. Source: Getty Images
Arizona adapted coding instructions for their crash form for the field Speed Too Fast for Conditions. The new instructions define STFC as the following:
"Traveling at a speed that was unsafe for the road, weather, traffic or other environmental conditions at the time. This does not include behavioral conditions such as distraction, impairment, fatigue, falling asleep or other violations that would otherwise make any speed unreasonable".
Based on the new instructions, crashes where impairment, fatigue, or other behavioral issues are the main contributor are coded as impairment. Crashes with an impaired driver can still be coded "Exceeding the Posted Speed Limit" when both conditions are met1.
In the future, officers and agencies will be able to use the data to identify locations with a high number of speeding-related crashes which actually represent a speeding problem. In this manner, automated enforcement and other speeding-related countermeasures can be applied and are expected to be more effective. For instance, ADOT is evaluating speed limit decals on State Route 347 where a review of crash reports indicated drivers were cited as STFC in more than half of crashes along this section of roadway4.
Fatal Crashes in Arizona. Data Source: King, 2018; ADOT, 2016
Percentage of fatal crashes coded as STFC decreased by more than 1/3 after changing the crash form instructions.
Addressing crash contributing factors to target countermeasures – Although both Speed Too Fast for Conditions and Exceeded the Posted Speed Limit represent important safety issues, in most cases they represent two vastly different situations. In many cases, STFCs are either impaired drivers or weather related situations. Since neither scenario is usually tied to a specific roadway section, it is difficult to target site-based countermeasures. More importantly, many speed management countermeasures may not be suited to the problem. For instance, DSFS or safety cameras are set to activate at speed thresholds set for dry conditions. As a result, an impaired driver involved in a crash or a driver traveling too fast for weather conditions could be coded by the attending office as STFC yet be traveling below the thresholds set to activate DSFS or safety cameras. This may lead to utilizing countermeasures which would have no impact on these types of crashes. Other speed management countermeasures, such as lane narrowing or pavement markings, may similarly not be well suited in these situations if drivers are cognitively impaired.
Arizona came to this realization as they considered how speeding-related crashes could be addressed. As a result, they found a solution that allows them to focus on the root cause of the crash when feasible. The ability to parse crashes by situations where speeding-related countermeasures are effective versus situations, such as impaired driving, where countermeasures such as targeted enforcement are effective is important because it allows agencies to better focus resources.
Consistency in coding – Arizona also made the decision to update the crash form rather than relying solely on additional training for officers in how to better code STFC. This was successful since, even with training, significant variation can exist in how officers interpret fields on a crash form. As a result, the updated crash form provides more consistency.
| ISSUE | STRATEGIES | TAKEAWAYS |
|---|---|---|
|
|
|
Speed limits are sometimes inconsistent within a jurisdiction for similar roadways. In some cases, this is because speed limits are applied to roadway sections based on characteristics which may not be obvious to the driver. For instance, speed limits on one roadway classified as a collector are set at 35 mph while another collector with similar characteristics is set at 30 mph due to a higher crash history. Since both appear similar to drivers, they are likely to apply the speed they believe is the most suitable to both roadways.
In other cases, as noted by "Methods and Practices for Setting Speed Limits: An Informational Report," varying levels of experience, use of different procedures, as well as subjective procedures for determining speed limits can lead to inconsistencies in setting speed limits within or between jurisdictions1. In either case, inconsistency violates driver expectancy and can lead to drivers disregarding speed limits.
Consistent speed limits on roadways with similar functions and characteristics assist drivers in developing good driving habits. As a result, drivers understand what is expected when they enter a particular area2. Additionally, consistent and credible speed limits can be more easily enforced.
Several agencies have instituted consistent speed limits across a particular type of roadway as described in the following examples. The idea is to provide drivers with a consistent message. In most of the cases highlighted, speed limits were used to address vulnerable road users due to high pedestrian and bicyclist fatalities. As a result, the use of consistent speed limits across a jurisdiction usually resulted in lower speed limits. Although not highlighted in these noteworthy practices, the use of consistent speed limits can include redefining speed limit zone lengths and increasing speed limits along sections where a lower speed was not warranted.
Speed Limit Sign Source: Getty Images
The following summarizes examples of agencies that successfully set consistent speed limits. In most cases, changes were made to address pedestrian and bicyclist safety.
Charlotte, North Carolina
Between 2013 and 2017, while pedestrian and bicycling crashes accounted for less than 3 percent of crashes they made up 44 percent of fatalities3 in Charlotte. In response to concerns about traffic speed and pedestrian safety, the City of Charlotte developed a neighborhood traffic management program which is a joint program between the city and residents4 as well as adopted the city's Vision Zero plan.
Biker along busy roadway. Source: Getty Images
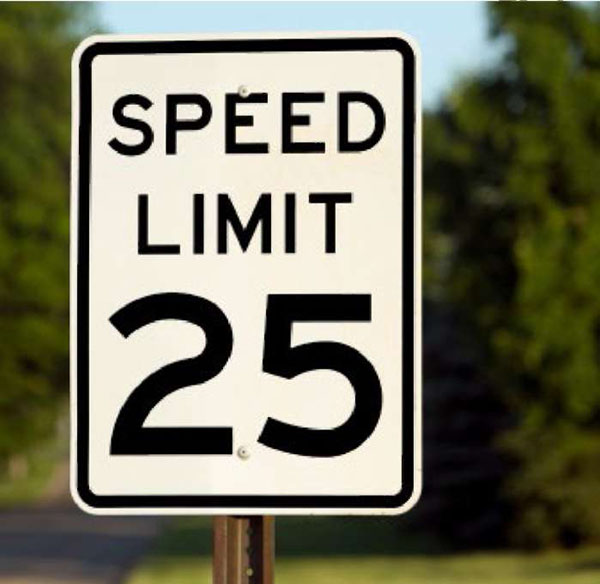
As part of those action plans, the city changed the speed limits on streets classified as "local" from 35 mph to 25 mph in November of 20185. The city also adopted other pedestrian-centric measures such as additional sidewalk construction, sidewalk improvements, and upgrades to pedestrian crossings. The Vision Zero action items were a result of a data-driven approach that included engaging with the community, enforcement, and education.
Portland, Oregon
Almost half (47 percent) of fatal crashes in Portland are the result of speeding. Pedestrians account for 31 percent and bicyclists account for 6 percent of motor vehicle fatalities. Further, 57 percent of deadly crashes occur on 8 percent of Portland Streets6.
Portland adopted a Vision Zero Action Plan in 2015 to reduce fatal and serious injuries. The plan developed a High Crash Network which identified high crash locations for people walking, biking, and driving. The plan also reviewed how speed limits were set including use of the 85th percentile speed. Their approach shifted away from setting speed limits solely based on drivers to a balanced approach that incorporates all road users. Part of this plan was to achieve speed consistency on local residential streets7. State law was successfully amended in 2017 to allow speed limits to be reduced from 25 to 20 mph on all of 3,000 miles of local residential streets. The bill that passed in 2017 was specifically for Portland. More recent legislation may allow the law to expand this option to cities across Oregon8. Portland used the marketing theme "20 is plenty" and conducted activities such a distributing yard signs to remind residents7. The Vision Zero Action Plan incorporated a range of other activities9,10.
Seattle, Washington
The City of Seattle, Washington experienced around 20 fatalities and 150 serious injury crashes annually. Pedestrian and bicyclist crashes made up 5 percent of all crashes but almost 50 percent of fatalities. Additionally, 9 out of 10 bicycle/pedestrian crashes resulted in injury. Speeding contributed to 25 percent of fatalities citywide and 42 percent of downtown traffic fatalities.
In order to address these and other traffic safety issues, Seattle funded Vision Zero through a 9- year transportation levy. As part of this initiative, Washington State passed legislation in 2013 allowing localities to lower speed limits to 20 mph. As a result, Seattle set consistent speed limits on non-arterials at 20 mph. Additionally, 200 miles of arterial streets were re-signed from 30 mph to 25 mph in 201611.
Seattle also utilized additional speed management strategies such as lane narrowing, speed cushions, and removing the center line. The process also included focusing on safety corridors with six completed and seven scheduled for 2019. Other safety corridor improvements include use of Leading Pedestrian Intervals (LPI), addition of protected bike lanes, use of more durable and visible pavement markings, lane narrowing, and speed cushions12. An LPI starts the pedestrian "walk" signal several seconds before the vehicle green phase changes so pedestrians are more visible to drivers making conflicting movements.
Although not solely attributed to changes in the speed limit, fatalities decreased by 26 percent between 2017 and 201813.
Pedestrians in NYC. Source: Getty Images
New York City, New York
In 2014, pedestrian and bicyclist crashes accounted for 27 percent of all police reported crashes but made up 62 percent of fatalities and 34 percent of injury crashes in New York City (NYC). Additionally, unsafe speed was noted as a contributing factor in 7 percent of all crashes but accounted for 23 percent of fatal crashes14.
The use of consistent city-wide speed limits was one strategy that NYC felt would be effective given the high pedestrian and bicycle volumes present. However, while State law allowed the city to reduce speed limits on a case by case basis, citywide speed limits could not be lower than 30 mph15.
NYC used a data driven and comprehensive approach to convince the legislature to pass a measure allowing a default 25 mph speed limit based on overwhelming evidence about pedestrian risk15. In particular, they used evidence to convince the legislature that a pedestrian's risk of dying is twice as high when struck at 30 mph as it is for being struck by a vehicle at 25 mph. According to Repogle15, Deputy Commissioner for Policy at the New York City Department of Transportation, they also used the argument that lowering New York City's speed limit was the most logical evidence based safety intervention they could take to save lives. Similar to their activities for safety cameras, the strategy was also part of the NYC Vision
Zero initiative. The default city-wide speed limit was lowered from 30 to 25 MPH in 2014. This included all local streets and most arterials, around 90 percent of the streets in New York's five boroughs. The 30 mph speed limit is still allowed on high traffic arterials16.
An important part of the process was to ensure the change was communicated to the public. Over 4,700 new 25 mph speed limit signs were posted. In some cases, the city re-evaluated and resigned streets that had speed limits higher than 25. Additionally, speed limit maps were created for citizens to check speed limits along a particular roadway if there were any uncertainties17.
New York City also implemented other speed management strategies such as eliminating the number of turning movements entering complicated intersections, extending medians at intersections, integrating LPI, better lane designation, adding pedestrian signals, adding crosswalks or pedestrian safety islands, adding speed bumps, addition of bike lanes and paths, and increasing street lighting18.
Queens Boulevard, which had a higher than average pedestrian fatality rate, had a 3-year period without a single pedestrian or bicyclist fatality after the installation of the 25 mph speed limit and safety cameras15.
Pedestrians in Boston. Source: Getty Images
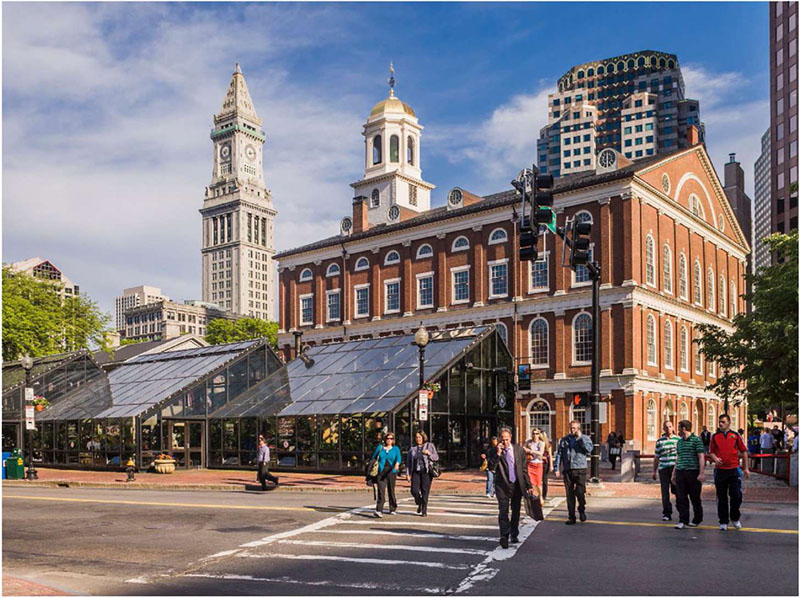
Boston, Massachusetts
Pedestrian and bicycle crashes accounted for 71 percent of fatal and 30 percent of injury crashes in 2016 in Boston19. Efforts to change the default speed limit were also part of the city's Vision Zero program. A State law instituting a 25 mph default speed limit was signed in January 2017 through a combined effort of the Boston City Council, Governor, Massachusetts DOT, and the Massachusetts State Legislature20. The default speed limit previously was 30 mph. In conjunction with the effort, they placed 25 mph signs at entrance points and other strategic locations to educate drivers about the change.
Overall fatalities in Boston dropped from 21 in 2016 to 10 in 2018. Pedestrian and bike fatalities decreased from 15 to 7 over the same time period. Pedestrian injury crashes dropped from 893 in 2016 to 680 in 2018, although bicycle crashes were reasonably unchanged (422 to 425)19.
80% of respondents in the City of Calgary survey felt it was easier to remember a single speed limit and consistent times.
Other Examples
The City of Calgary, Canada has used both playground and school zones to protect vulnerable road users. Efforts to achieve compliance with speed limits in these areas were initially approached using education and enforcement followed by traffic control enhancements and speed management countermeasures. Prior to 2014, school zones and playgrounds in Calgary had different hours and speed limits. A commonly noted concern was uncertainty about the type of zone a driver was entering along with effective hours.
Playground. Source: Getty Images
School zone and playground zone speed limits were changed by March 2016 to one consistent time (7:30 am to 9:00 pm) and speed limit (30 km/h) which is effective year-round,21,22,23.
A study by the City of Calgary and the University of Calgary collected data from 11 playgrounds and 18 school zones and found average speeds decreased from 35.9 to 30.1 km/h. Additionally, the study found the collision rate decreased from 78 percent while injury collisions within playground zones decreased by 33 percent21.
Data-driven approach – All of the agencies highlighted used a data-driven approach to set consistent speed limits which usually resulted in lower speed limits. Agencies were able to demonstrate a significant safety issue for vulnerable road users by underscoring the number of fatalities and injuries sustained by pedestrians and bicyclists. For instance, NYC used evidence about pedestrian risk to convince their legislature to make the change. Portland developed a High Crash Network and reviewed how speed limits were set. Additionally, most of them demonstrated the impact that speed has on the ability of vulnerable road users to survive a crash when educating decision makers and the public.
Advocacy – Advocacy efforts are undertaken by concerned citizens. Advocacy groups are able to reach out and educate their peers to demonstrate the safety issues behind proposed changes on a more personal level than agencies may be able to achieve. Additionally, many advocacy efforts involved groups contacting their legislators which demonstrates widespread acknowledgement of the problem.
Outreach – Most of the agencies spent considerable effort in educating the public about the need for changes and after consistent speed limits were adopted, they ensured the public was aware of the change. This included posting a large number of new speed limit signs, developing speed limit maps to show where changes had occurred, and using marketing campaigns.
Comprehensive approach – Another strategy for success was that in almost all of the cases, agencies also implemented other speed management countermeasures rather than just relying on changing the speed limit. In most cases, the speed limit reduction was part of their Vision Zero plan and was part of a multi-pronged approach to the problem. This helps make a case to the public that the changes are part of a larger plan to address safety.

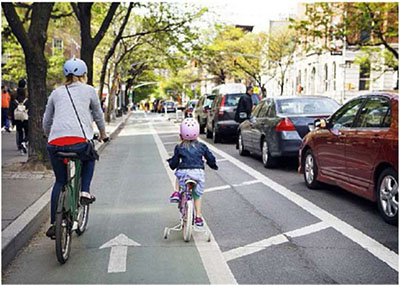
Adult and child riding in a bike lane. Source: Getty Images
Addressing driver expectancy – Although most of the agencies reduced the speed limit to address safety concerns, the use of consistent speed limits also provides drivers with a consistent message and expectations. For instance, as noted in the Calgary example, instituting the same speed limits and effective hours for school zones and playgrounds presented drivers with a consistent message. Consistent speed limits on roadways with similar functions and characteristics assist drivers in developing good driving habits. As a result, drivers understand what is expected when they enter a particular area (WHO, 2008). Additionally, consistent and credible speed limits can be more easily enforced.
| ISSUE | STRATEGIES | TAKEAWAYS |
|---|---|---|
|
|
|
Speeding is a contributing factor in almost one-third of fatalities and around 20 percent of serious injury crashes in New Zealand1,2. Additionally, roadway fatalities increased from 253 in 2013 to 373 in 2018 while serious injuries increased from 2,020 to 2,8363.
Historically speed limits in New Zealand were based on the number of access points and surrounding land use for a particular rather than considering roadway characteristics or safety performance.
To address concerns about speeding-related crashes, the New Zealand Transport agency developed the NZ Speed Management Guide which provides speed limits that are nationally consistent and evidence based2,4,. The resulting guide is an evidence-based, network-wide approach that recommends speed limits that are safe and appropriate based on road function, design, safety, and land use.
The objectives of the guide are the following5:
Speeding contributes to 1/3 of fatalities in New Zealand and is noted as being on par with drunk driving as their biggest safety problem2.
A recommended speed limit for each roadway type is developed based on various characteristics such as geometry, land use, roadside hazards, etc. An Infrastructure Risk Rate (IRR) is developed for each corridor based on the following and an IRR score is given (1 = low to 5 = high risk):

Speeding Vehicle. Source: Getty Images

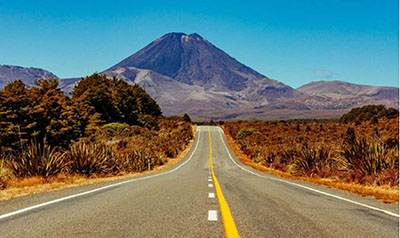
Typical rural road in New Zealand. Source: Getty Images
A measure of safety risk (low-to-high) is also assigned based on crash density and crash rate6. The IRR score is combined with safety risk and roadway function and a safe and appropriate speed recommended. The guide lays out principles for setting speed limits and applying speed management measures to ensure they are consistent across similar roadway types in a network4. A matrix was developed which recommends safe and appropriate speeds for a particular road class. An example of recommended speeds for a few roadway types is shown in Table 1.
Table 1: Example of Recommended Speeds for Select Road Types
| Roadway Function | Road Safety Metric | Infrastructure Risk Rating | Safe and Appropriate Speed |
|---|---|---|---|
|
|
|
80 km/h |
|
|
|
60 km/h |
|
|
|
50 km/h |
*One Network Road Classification **Risk is further defined in the NZ Speed Management Guide
The New Zealand Transport agency develops a map for each Road Controlling Agency, which shows where existing speed limits differ from the recommendations, and identifies where speed management will have the most benefit. Maps are developed using land use, speed limits, current operating speeds, and a measure of risk for the corridor4.
The network map is created by comparing existing speed limits against the recommended ones. Corridors with a safety issue and current travel speeds and speed limit above the calculated safe and appropriate speed are identified. The next step is to determine what type of intervention should be done for those corridors. Economically important roads where there is a strong case for investment are targeted for geometric improvements such as by-passes. When corridors do not meet these criteria, discussions are made about lowering the speed limit or employing lower-cost countermeasures. Finally, in locations where current travel speeds are below the current speed limit, lowering the speed limit is recommended to be consistent4.
61 percent of fatal crashes were found to occur on roadways where the calculated "safe and appropriate speed" was below the currently posted speed limit.
The speed management guide was used to develop a tool called "Mega Maps" which assigns speeds within a particular network area based on factors from the NZ Speed Management Guide2. Application of the tool for fatal road crashes in 2018 found 61 percent of fatal crash sites had a calculated "safe and appropriate speed" that was below the currently posted speed limit at that site2. This information allows agencies to better target speed limits for high-risk roadways.
New Zealand has also announced a $1.4 billion investment in road safety over the next 3 years with half of the funds allocated to state highways and half allocated for local roads. Improvements include the use of median and side barriers, rumble strips, and should widening3.
In Auckland, around 750 km of roads are being treated. The focus is on the top 10 percent high risk areas5.
Data-driven approach – New Zealand used a data-driven approach that can be replicated by other agencies. Speed limits were assigned based on an assessment of roadway characteristics (i.e., width, volume, and alignment) as well as crash density and rate. A measure of safety risk is assigned. In addition to having a clear metric for assigning speed limits, the concept of risk can be explained to agencies and the public more easily.
Outreach – As NZ began implementing the guide and tool they found some resistance. For instance, the use of the guide and tool resulted in speed limits on a large number of roadways being classified as "too high." One source reported that 87 percent of speed limits in New Zealand are too high according to the tool with only 5 percent of open roads warranting the current 100 km/h speed limit. Others expressed concerns that blanket reductions could weaken the economy by increasing time for businesses to move freight7.
To address these concerns, New Zealand found engagement and outreach were an important part of the process. Their approach and perspective for implementation included the following:
https://highways.dot.gov/research/research-programs/safety/speed-management
Noteworthy Practice Booklet – Speed Management – FHWA-SA-20-076

