U.S. Department of Transportation
Federal Highway Administration
1200 New Jersey Avenue, SE
Washington, DC 20590
202-366-4000
(Note: This document has been converted from the original document to 508-compliant HTML. The formatting has been adjusted for 508 compliance, but all the original text content is included, plus additional text descriptions for the images, photos and/or diagrams have been provided below.)
| ISSUE | STRATEGIES | TAKEAWAYS |
|---|---|---|
|
|
|
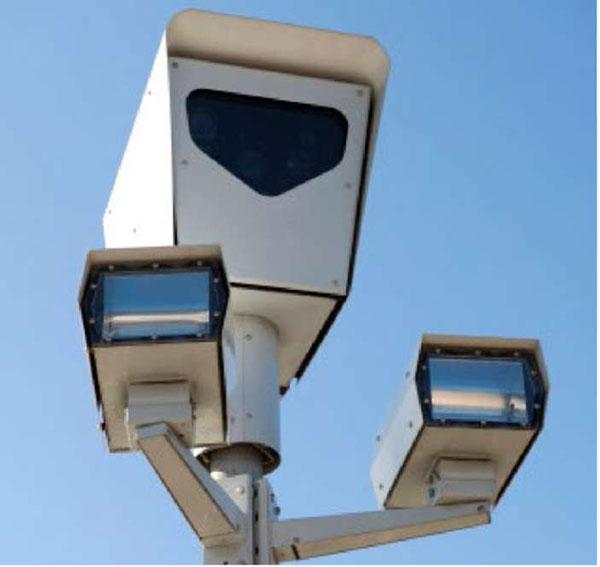
Safety Camera. Source: Getty Images
Speed is a persistent traffic safety issue; particularly in areas with high pedestrian and/or bike users. One effective enforcement strategy that has been utilized is Automated Speed Enforcement (ASE), more recently termed "safety cameras."
However, agencies have often struggled with implementing safety cameras due to citizen concerns, legislative resistance, speeding not being perceived as a safety issue, and privacy issues1. Implementation has also battled the perception that automated enforcement is a "money grab."
Due to the high number of pedestrians and bicyclists, New York City (NYC) had a particular interest in the use of safety cameras. In 2013, pedestrian and bicyclist crashes accounted for 28 percent of all police reported crashes but made up 65 percent of fatalities in New York City. Additionally, unsafe speed was noted as a contributing factor in 7 percent of all crashes but accounted for 25 percent of fatal crashes2.
New York City faced typical oppositions to safety cameras such as legislative restrictions and citizen resistance. They successfully instituted a safety camera program in school zones through several strategies.
Data-Driven Approach
The first factor for success in NYC's adoption of safety cameras and addressing crashes in general was the use of a data-driven approach. For instance, the New York Police Department (NYPD) combats traffic crashes by identifying traffic violations that have the greatest impact on crash severity and then focuses on changing the driver behaviors that contribute to these crashes.
Under Vision Zero, crash data were utilized to identify the following six violations that had the greatest impact on safety3:
Corridors for improvements were identified based on where pedestrian deaths and severe injuries were the most concentrated4 and in some cases challenged conventional wisdom about what streets had safety issues. For safety cameras, sites were selected by ranking school zones according to the number of traffic injuries during school hours on school days. Site selection also included the use of speed data, roadway geometry, engineering judgment, and areas identified within Pedestrian Safety Action Plans5.
Advocacy and Outreach
Another factor for success was the active participation of advocacy and community organizations. Groups such as Transportation Alternatives and Families for Safe Streets helped elevate road safety as a priority of the city. Advocacy included events, petitions, use of technical statistics along with personal stories, and even working with faith-based organizations within communities5,6.
Another example was a joint venture between the NYPD and NYDOT to conduct on-street outreach. The Vision Zero Street Teams identify corridors with a significant crash history and pinpoint the types of crashes that occur. Next, the NYPD and NYDOT staff distribute fliers to pedestrians and drivers with safety tips that correspond to the most serious crashes along that corridor. The NYPD also targets enforcement resources to address the violations related to identified crash types3.
Other advocacy and outreach strategies include ads on television, radio, bus stops, and billboards to educate aggressive drivers about the consequences of negative behavior. Results have shown 72 percent of drivers recall having seen the media campaign5.
Advocacy was also critical in the initial implementation of the safety cameras. Later when NYC's authority to use safety cameras was set to expire in July 2018 after the state legislature failed to reach a compromise on extension, advocacy groups pushed for a special session to vote on the proposed bill. Advocacy groups directly contacted legislators to encourage them to vote7. The bill was ultimately passed.
Comprehensive Approach
Another important factor for success was the use of a comprehensive approach. Safety cameras were one piece of a comprehensive strategy4 to address pedestrian and bicyclist safety. For instance, NYC was the first to implement a Vision Zero policy. This included developing a pedestrian safety action plan for each of the City's five boroughs. Safety engineering projects were completed in areas with high rates of severe pedestrian crashes. NYC was able to implement countermeasures at almost 90 percent of priority corridors and intersections and 461 safety engineering projects have been completed4.
Engineering strategies have included the installation of Leading Pedestrian Interval (LPI) which gives crossing pedestrians a "head start" before vehicles begin to turn with around 2951 LPIs installed4. Left turn speed management was also instituted based on findings of a study of the interaction between left turn speeds and pedestrian safety and included the use of paint, flexible delineators, and rubber speed bumps. Other engineering countermeasures include bus boarding islands, speed cushions, dedicated bike lanes, roadway redesign, raised crosswalks, rubber pedestrian refuge islands offset crossings, and improved lighting3,4.
Enforcement has also played a role. In addition to playing a key role in Vision Zero, NYPD assesses speeding conditions in conjunction with the NYDOT and identifies solutions including increased enforcement.
New York conducted a safety camera pilot program in 20 school zones starting in 2013, using fixed and mobile cameras. A data-driven approach was used to determine locations. Cameras were placed on streets within a quarter mile of selected schools. The system was specifically targeted to school safety. The cameras operate 1 hour before and 1 hour after school activities and the speed threshold was set at 10 mph over the speed limit. Additionally, data collected from the program cannot be used for unrelated purposes.
The program was expanded to 140 school speed zones in 20145 and will further expand to be the largest urban network of safety cameras in the US (2,000 cameras in 750 areas within a quarter mile of a school)8. More recently hours of operation were expanded9.
NYC use of safety cameras has shown significant success. A 63 percent decrease in speed in school zones where safety cameras were present has been reported. Additionally, a 15 percent decrease in crashes, a 17 percent reduction in injuries, and a 55 percent reduction in fatalities have occurred in school zones with safety cameras5. By 2018, the daily rate of camera violations had decreased by 60 percent and only 19 percent of violations are repeat offenders3.
NYC has also reported success in addressing pedestrian safety overall. From 2008 to 2017 pedestrian fatalities in urban areas nationally increased by around 46 percent. Over that same time period, pedestrian fatalities in NYC dropped 31 percent. Additionally, a 36 percent decline in pedestrian fatalities has occurred at Vision Zero priority locations4.
Data driven – Successful adoption of safety cameras was due to NYC being able to respond to the key concerns about them. One strategy was use of a data-driven approach which highlighted the crash problem and focused on areas where safety issues existed. Camera locations were also selected using a data driven strategy.
Comprehensive strategy – NYC also used a comprehensive approach to address safety from a broad perspective which included utilizing a number of other countermeasures. This demonstrated safety cameras were just one piece of a larger strategy to address safety. Additionally, the use of a comprehensive approach addressed the problem from multiple angles rather than relying on one solution.
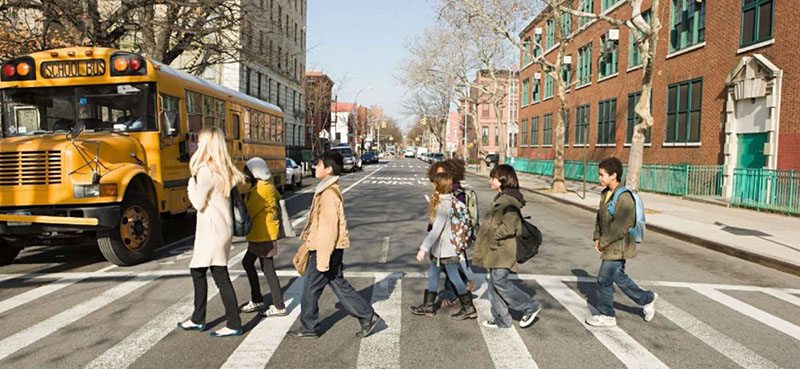
School Children crossing a street in NYC. Source: Getty Images
Advocacy – Another key strategy was extensive outreach and advocacy activities. Educating the public helps them understand the problem and get buy-in. Citizen advocates were key since they demonstrated to both legislators and the public that speeding is a concern.
Continued vigilance – Another lesson learned is that continued vigilance is needed. After initial implementation in 2013, NYC's authority to use safety cameras was set to expire in July 2018 after the state legislature failed to reach a compromise on extension. This required additional effort by the city and advocacy groups to ensure the program stayed active and was ultimately expanded.
Safety camera thresholds – Although not specific to the NYC case study, a general takeaway from the application of safety cameras is the use of thresholds. Most agencies set the system to activate at some threshold over the posted speed limit. This is generally 5 or 10 mph over. In the NYC program, a 10 mph threshold was utilized. Selecting a threshold over the speed limit is a typical approach, since most agencies do not want to ticket drivers right at the speed limit. It also allays concerns that the system is unfairly ticketing drivers and being used for revenue. However, once drivers become aware of the threshold, in reality, the target speed for drivers is likely to be the threshold limit rather than the actual speed limit. As a result, agencies should consider what the target speed is in selecting a threshold.
Case Study 5: Noteworthy Speed Management Practices – FHWA-SA-20-081

