U.S. Department of Transportation
Federal Highway Administration
1200 New Jersey Avenue, SE
Washington, DC 20590
202-366-4000
(Note: This document has been converted from the original document to 508-compliant HTML. The formatting has been adjusted for 508 compliance, but all the original text content is included, plus additional text descriptions for the images, photos and/or diagrams have been provided below.)
| ISSUE | STRATEGIES | TAKEAWAYS |
|---|---|---|
|
|
|
Speed limits are sometimes inconsistent within a jurisdiction for similar roadways. In some cases, this is because speed limits are applied to roadway sections based on characteristics which may not be obvious to the driver. For instance, speed limits on one roadway classified as a collector are set at 35 mph while another collector with similar characteristics is set at 30 mph due to a higher crash history. Since both appear similar to drivers, they are likely to apply the speed they believe is the most suitable to both roadways.
In other cases, as noted by "Methods and Practices for Setting Speed Limits: An Informational Report," varying levels of experience, use of different procedures, as well as subjective procedures for determining speed limits can lead to inconsistencies in setting speed limits within or between jurisdictions1. In either case, inconsistency violates driver expectancy and can lead to drivers disregarding speed limits.
Consistent speed limits on roadways with similar functions and characteristics assist drivers in developing good driving habits. As a result, drivers understand what is expected when they enter a particular area2. Additionally, consistent and credible speed limits can be more easily enforced.
Several agencies have instituted consistent speed limits across a particular type of roadway as described in the following examples. The idea is to provide drivers with a consistent message. In most of the cases highlighted, speed limits were used to address vulnerable road users due to high pedestrian and bicyclist fatalities. As a result, the use of consistent speed limits across a jurisdiction usually resulted in lower speed limits. Although not highlighted in these noteworthy practices, the use of consistent speed limits can include redefining speed limit zone lengths and increasing speed limits along sections where a lower speed was not warranted.
Speed Limit Sign Source: Getty Images
The following summarizes examples of agencies that successfully set consistent speed limits. In most cases, changes were made to address pedestrian and bicyclist safety.
Charlotte, North Carolina
Between 2013 and 2017, while pedestrian and bicycling crashes accounted for less than 3 percent of crashes they made up 44 percent of fatalities3 in Charlotte. In response to concerns about traffic speed and pedestrian safety, the City of Charlotte developed a neighborhood traffic management program which is a joint program between the city and residents4 as well as adopted the city's Vision Zero plan.
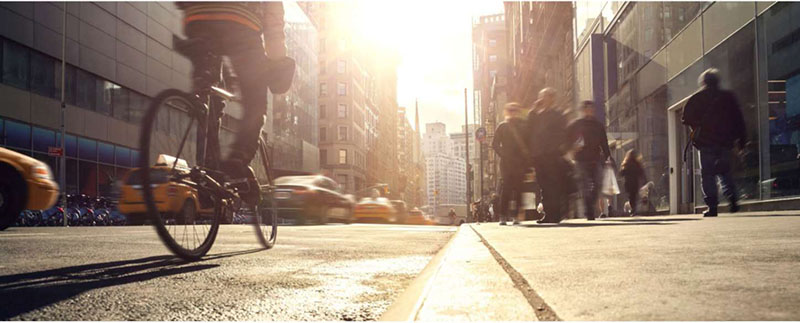
Biker along busy roadway. Source: Getty Images
As part of those action plans, the city changed the speed limits on streets classified as "local" from 35 mph to 25 mph in November of 20185. The city also adopted other pedestrian-centric measures such as additional sidewalk construction, sidewalk improvements, and upgrades to pedestrian crossings. The Vision Zero action items were a result of a data-driven approach that included engaging with the community, enforcement, and education.
Portland, Oregon
Almost half (47 percent) of fatal crashes in Portland are the result of speeding. Pedestrians account for 31 percent and bicyclists account for 6 percent of motor vehicle fatalities. Further, 57 percent of deadly crashes occur on 8 percent of Portland Streets6.
Portland adopted a Vision Zero Action Plan in 2015 to reduce fatal and serious injuries. The plan developed a High Crash Network which identified high crash locations for people walking, biking, and driving. The plan also reviewed how speed limits were set including use of the 85th percentile speed. Their approach shifted away from setting speed limits solely based on drivers to a balanced approach that incorporates all road users. Part of this plan was to achieve speed consistency on local residential streets7. State law was successfully amended in 2017 to allow speed limits to be reduced from 25 to 20 mph on all of 3,000 miles of local residential streets. The bill that passed in 2017 was specifically for Portland. More recent legislation may allow the law to expand this option to cities across Oregon8. Portland used the marketing theme "20 is plenty" and conducted activities such a distributing yard signs to remind residents7. The Vision Zero Action Plan incorporated a range of other activities9,10.
Seattle, Washington
The City of Seattle, Washington experienced around 20 fatalities and 150 serious injury crashes annually. Pedestrian and bicyclist crashes made up 5 percent of all crashes but almost 50 percent of fatalities. Additionally, 9 out of 10 bicycle/pedestrian crashes resulted in injury. Speeding contributed to 25 percent of fatalities citywide and 42 percent of downtown traffic fatalities.
In order to address these and other traffic safety issues, Seattle funded Vision Zero through a 9- year transportation levy. As part of this initiative, Washington State passed legislation in 2013 allowing localities to lower speed limits to 20 mph. As a result, Seattle set consistent speed limits on non-arterials at 20 mph. Additionally, 200 miles of arterial streets were re-signed from 30 mph to 25 mph in 201611.
Seattle also utilized additional speed management strategies such as lane narrowing, speed cushions, and removing the center line. The process also included focusing on safety corridors with six completed and seven scheduled for 2019. Other safety corridor improvements include use of Leading Pedestrian Intervals (LPI), addition of protected bike lanes, use of more durable and visible pavement markings, lane narrowing, and speed cushions12. An LPI starts the pedestrian "walk" signal several seconds before the vehicle green phase changes so pedestrians are more visible to drivers making conflicting movements.
Although not solely attributed to changes in the speed limit, fatalities decreased by 26 percent between 2017 and 201813.
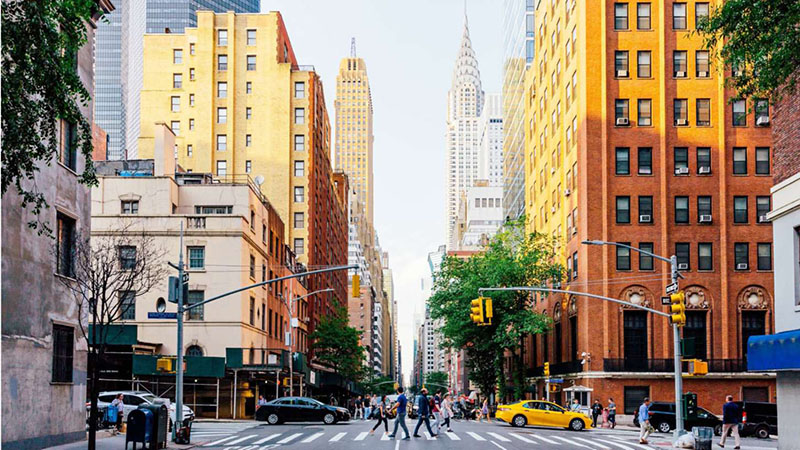
Pedestrians in NYC. Source: Getty Images
New York City, New York
In 2014, pedestrian and bicyclist crashes accounted for 27 percent of all police reported crashes but made up 62 percent of fatalities and 34 percent of injury crashes in New York City (NYC). Additionally, unsafe speed was noted as a contributing factor in 7 percent of all crashes but accounted for 23 percent of fatal crashes14.
The use of consistent city-wide speed limits was one strategy that NYC felt would be effective given the high pedestrian and bicycle volumes present. However, while State law allowed the city to reduce speed limits on a case by case basis, citywide speed limits could not be lower than 30 mph15.
NYC used a data driven and comprehensive approach to convince the legislature to pass a measure allowing a default 25 mph speed limit based on overwhelming evidence about pedestrian risk15. In particular, they used evidence to convince the legislature that a pedestrian's risk of dying is twice as high when struck at 30 mph as it is for being struck by a vehicle at 25 mph. According to Repogle15, Deputy Commissioner for Policy at the New York City Department of Transportation, they also used the argument that lowering New York City's speed limit was the most logical evidence based safety intervention they could take to save lives. Similar to their activities for safety cameras, the strategy was also part of the NYC Vision
Zero initiative. The default city-wide speed limit was lowered from 30 to 25 MPH in 2014. This included all local streets and most arterials, around 90 percent of the streets in New York's five boroughs. The 30 mph speed limit is still allowed on high traffic arterials16.
An important part of the process was to ensure the change was communicated to the public. Over 4,700 new 25 mph speed limit signs were posted. In some cases, the city re-evaluated and resigned streets that had speed limits higher than 25. Additionally, speed limit maps were created for citizens to check speed limits along a particular roadway if there were any uncertainties17.
New York City also implemented other speed management strategies such as eliminating the number of turning movements entering complicated intersections, extending medians at intersections, integrating LPI, better lane designation, adding pedestrian signals, adding crosswalks or pedestrian safety islands, adding speed bumps, addition of bike lanes and paths, and increasing street lighting18.
Queens Boulevard, which had a higher than average pedestrian fatality rate, had a 3-year period without a single pedestrian or bicyclist fatality after the installation of the 25 mph speed limit and safety cameras15.
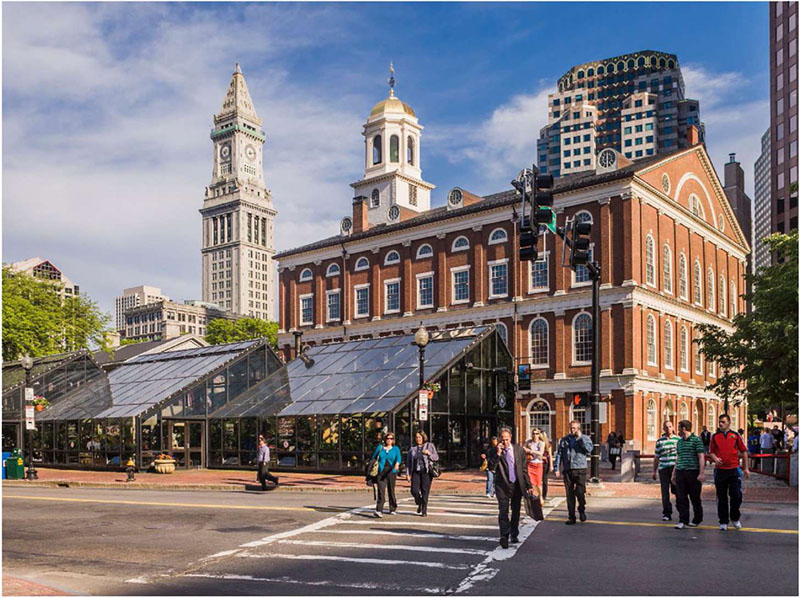
Pedestrians in Boston. Source: Getty Images
Boston, Massachusetts
Pedestrian and bicycle crashes accounted for 71 percent of fatal and 30 percent of injury crashes in 2016 in Boston19. Efforts to change the default speed limit were also part of the city's Vision Zero program. A State law instituting a 25 mph default speed limit was signed in January 2017 through a combined effort of the Boston City Council, Governor, Massachusetts DOT, and the Massachusetts State Legislature20. The default speed limit previously was 30 mph. In conjunction with the effort, they placed 25 mph signs at entrance points and other strategic locations to educate drivers about the change.
Overall fatalities in Boston dropped from 21 in 2016 to 10 in 2018. Pedestrian and bike fatalities decreased from 15 to 7 over the same time period. Pedestrian injury crashes dropped from 893 in 2016 to 680 in 2018, although bicycle crashes were reasonably unchanged (422 to 425)19.
80% of respondents in the City of Calgary survey felt it was easier to remember a single speed limit and consistent times.
Other Examples
The City of Calgary, Canada has used both playground and school zones to protect vulnerable road users. Efforts to achieve compliance with speed limits in these areas were initially approached using education and enforcement followed by traffic control enhancements and speed management countermeasures. Prior to 2014, school zones and playgrounds in Calgary had different hours and speed limits. A commonly noted concern was uncertainty about the type of zone a driver was entering along with effective hours.
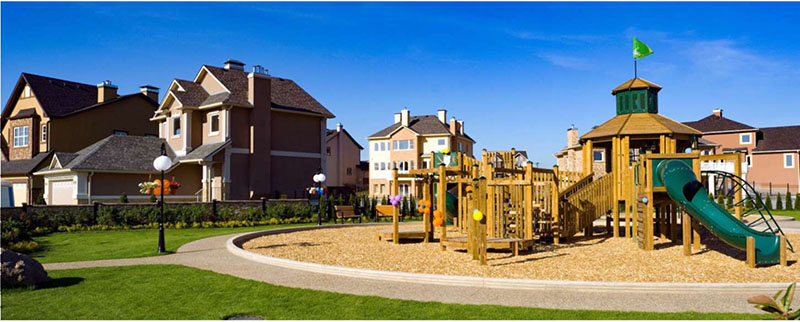
Playground. Source: Getty Images
School zone and playground zone speed limits were changed by March 2016 to one consistent time (7:30 am to 9:00 pm) and speed limit (30 km/h) which is effective year-round,21,22,23.
A study by the City of Calgary and the University of Calgary collected data from 11 playgrounds and 18 school zones and found average speeds decreased from 35.9 to 30.1 km/h. Additionally, the study found the collision rate decreased from 78 percent while injury collisions within playground zones decreased by 33 percent21.
Data-driven approach – All of the agencies highlighted used a data-driven approach to set consistent speed limits which usually resulted in lower speed limits. Agencies were able to demonstrate a significant safety issue for vulnerable road users by underscoring the number of fatalities and injuries sustained by pedestrians and bicyclists. For instance, NYC used evidence about pedestrian risk to convince their legislature to make the change. Portland developed a High Crash Network and reviewed how speed limits were set. Additionally, most of them demonstrated the impact that speed has on the ability of vulnerable road users to survive a crash when educating decision makers and the public.
Advocacy – Advocacy efforts are undertaken by concerned citizens. Advocacy groups are able to reach out and educate their peers to demonstrate the safety issues behind proposed changes on a more personal level than agencies may be able to achieve. Additionally, many advocacy efforts involved groups contacting their legislators which demonstrates widespread acknowledgement of the problem.
Outreach – Most of the agencies spent considerable effort in educating the public about the need for changes and after consistent speed limits were adopted, they ensured the public was aware of the change. This included posting a large number of new speed limit signs, developing speed limit maps to show where changes had occurred, and using marketing campaigns.
Comprehensive approach – Another strategy for success was that in almost all of the cases, agencies also implemented other speed management countermeasures rather than just relying on changing the speed limit. In most cases, the speed limit reduction was part of their Vision Zero plan and was part of a multi-pronged approach to the problem. This helps make a case to the public that the changes are part of a larger plan to address safety.
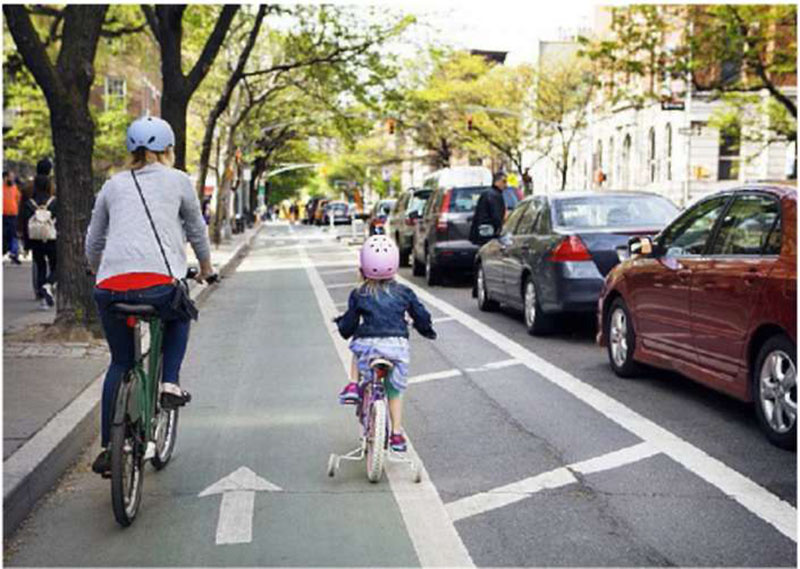
Adult and child riding in a bike lane. Source: Getty Images
Addressing driver expectancy – Although most of the agencies reduced the speed limit to address safety concerns, the use of consistent speed limits also provides drivers with a consistent message and expectations. For instance, as noted in the Calgary example, instituting the same speed limits and effective hours for school zones and playgrounds presented drivers with a consistent message. Consistent speed limits on roadways with similar functions and characteristics assist drivers in developing good driving habits. As a result, drivers understand what is expected when they enter a particular area (WHO, 2008). Additionally, consistent and credible speed limits can be more easily enforced.
Case Study 7: Noteworthy Speed Management Practices – FHWA-SA-20-083

