U.S. Department of Transportation
Federal Highway Administration
1200 New Jersey Avenue, SE
Washington, DC 20590
202-366-4000
| < Previous | Table of Content | Next > |
Results are presented for each of the 18 countermeasures (or combination of countermeasures) separately. For each countermeasure or group of countermeasures, the following information is presented:
Several static signs were installed and tested for their impact on pedestrian safety. These signs included:
The findings for the site-specific evaluations for each of these signs are presented below.
TURNING TRAFFIC YIELD TO PEDESTRIANS (R10-5 MUTCD 2003) signs are used to remind drivers who are making turns that they must yield to pedestrians in the crosswalks, particularly at signalized intersections where right turns on red (RTOR) are permitted.
These signs were installed by all three field teams. In Las Vegas and San Francisco, the text version of the sign, as shown in Figure 1, was installed at multiple intersections. In Miami, the signs used were symbol versions of the text signs installed in San Francisco and Las Vegas. These signs retained the text message TURNING VEHICLES and TO and substituted the yield symbol for the word YIELD and the pedestrian symbol for the word PEDESTRIAN (as illustrated in Figure 1). The purpose of using this symbol sign in place of the text message sign was to make the sign more comprehensible to tourists that were not native speakers of English and to increase the recognition distance of the sign.
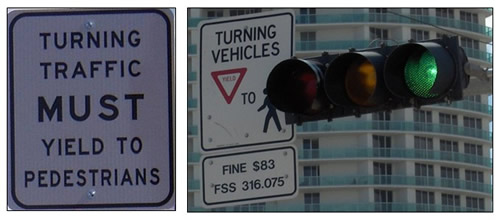
Figure 1. Signs used in Las Vegas and San Francisco (Left) and Sign Used in Miami (Right)
In Miami, symbol versions of the signs were tested at two intersections along Collins Avenue in Miami Beach. These signs were placed on the mast arm next to the traffic signals and were intended for both left-turn and right-turn drivers. In Las Vegas, text signs were tested at two different positions at two high crash locations: at one intersection the sign was placed next to the traffic signal (on the far side of the intersection), while at the other intersection the sign was placed on a sign pole 50 feet ahead of the intersection. In both cases, the signs were placed on the right and were intended for drivers making right turns. At both sites, a pedestrian crossing warning sign was installed at the same time as the turning sign. In San Francisco the signs were installed at four intersections with similar characteristics. At three of the four sites, the signs were positioned in one quadrant of the intersection and were directed at left-turn drivers on one approach (Figure 2). At the fourth site, the sign was directed at drivers making right turns on one approach. These locations are identified in Table 2.
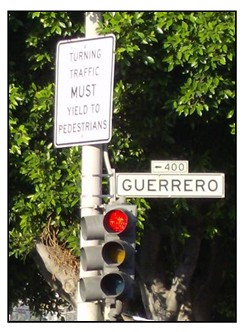
Figure 2. Sign at Guerrero & 16th in San Francisco
| Location | Study Sites | Site Descriptions |
|---|---|---|
| Miami | Collins & 17th Collins & 21st |
Both sites are located in South Beach just four blocks from each other. |
| San Francisco | Mission & Ocean Mission & Avalon Mission & Persia Guerrero & 16th |
Three of the sites are located in the same zone (along Mission Avenue) and have common speeds, parking, and surrounding land uses. The Guerrero & 16th site is located closer to downtown San Francisco, but has similar characteristics to the other sites. |
| Las Vegas | Harmon & Paradise Lake Mead & Pecos |
Sign was deployed in Stage 2 (after installation of Danish offset, median
refuge island, and high visibility crosswalk treatment). Sign was placed
at the intersection and installed in combination with a pedestrian crossing
warning sign on all approaches. Sign placed 50 feet upstream of intersection and installed in combination with a pedestrian crossing warning sign (only countermeasures installed at this location). Signs were installed on all four approaches to the intersection. |
Based on the placement of the signs, the teams collected a variety of MOEs to test the impacts of the signs on pedestrian safety and mobility, as well as driver mobility, as shown in Table 3. The primary purpose of the TURNING TRAFFIC YIELD TO PEDESTRIANS text and symbol signs is to increase driver yielding to pedestrians in the crosswalks during turns. Therefore, MOEs considered critical in assessing the effectiveness of these signs included driver behaviors such as yielding, blocking crosswalks, and coming to a complete stop before making a right turn on red. Other MOEs important in the assessment of the signs included pedestrian-vehicle conflicts and pedestrian and vehicle delay.
| Measure of Effectiveness | Miami | LV | SF |
|---|---|---|---|
| % of cycles where a pedestrian was trapped in the roadway | X | X | |
| % of drivers yielding to pedestrians | X | X | X |
| % of RTOR drivers that come to a complete stop | X | ||
| % of vehicles blocking crosswalk | X | ||
| % of cycles with pedestrian-vehicle conflicts | X | X | X |
| Pedestrian crossing time | X | ||
| Pedestrian delay | X | X |
To test the effectiveness of the signs in increasing driver yielding during turns, the teams measured a variety of driver behaviors. Due to the sign placement on the mast arm in Miami and the intention for the sign to be directed at both left- and right-turning drivers, the Miami team measured yielding separately for drivers making left turns and for those making right turns. These results are presented in Table 4. The results in the table show that there was a highly significant increase in both left-turn and right-turn driver yielding at Collins & 21st, while there was an unexplained decrease in left-turn driver yielding at Collins & 17th.
| Site | Before | After | % Change | p-value |
|---|---|---|---|---|
| % of Left-turning Drivers Yielding | ||||
| Collins & 17th | 59 (n = 188) |
51 (n = 370) |
-8 | >0.05 |
| Collins & 21st | 50 (n = 487) |
77 (n = 207) |
+27 | 0.01 |
| % of Right-turning Drivers Yielding | ||||
| Collins & 21st | 63 (n = 371) |
79 (n = 132) |
+16 | 0.01 |
Due to the sign placement on the right in Las Vegas and the intention for the sign to be directed at right-turning drivers, the Las Vegas team measured yielding for drivers making right turns on red (RTOR) separately from drivers making right turns on green (RTOG). These results are shown in Table 5.
| Site | Before | After | % Change | p-value |
|---|---|---|---|---|
| % of RTOR Drivers Yielding | ||||
| Harmon & Paradise | 61.3 (n = 31) |
73.3 (n = 30) |
+12 | 0.156 |
| Lake Mead & Pecos | 51.3 (n = 76) |
90.9 (n = 55) |
+39.7 | <0.001 |
| % of RTOG Drivers Yielding | ||||
| Harmon & Paradise | 73.5 (n = 102) |
76.7 (n = 90) |
+3.2 | 0.615 |
| Lake Mead & Pecos | 81.9 (n = 73) |
79.7 (n = 64) |
-2.2 | 0.566 |
The only significant impact on right-turn driver yielding at the two sites in Las Vegas was at Lake Mead & Pecos, where the sign was installed 50 feet upstream of the intersection. At this site, there was a highly significant increase in RTOR driver yielding. There was no significant change in yielding by drivers making RTOG. While there was an increase in driver yielding at Harmon & Paradise, it was not highly significant. This could be due to the fact that the sign was installed in Stage 2 following installation of a Danish offset, median refuge island, and high visibility crosswalk treatment. Over 60 and 70 percent of RTOR and RTOG drivers, respectively, were already yielding to pedestrians before installation of the signs in Stage 2.
The San Francisco team found no significant impacts on the percentage of drivers yielding to pedestrians during turns.
In addition to driver yielding, the San Francisco team also measured the distance drivers yielded before the crosswalk at each of the four sites where the signs were tested. The hypothesis was that the presence of the signs would encourage drivers to yield further away from the crosswalk. The team observed driver yielding and recorded whether drivers yielded within 5 feet of the crosswalk, between 5 and 10 feet of the crosswalk, or more than 10 feet from the crosswalk. The before and after distributions for each of the four test sites are shown in Figure 3 through Figure 6.
While the figures show that yielding distances after installation of the signs tended to increase at Mission & Avalon and at Guerrero & 16th, these changes were not statistically significant due to the small sample sizes. There were significant changes in driver yielding distance at Mission & Ocean and at Mission & Persia. At Mission & Ocean after installation of the signs, more drivers yielded within 5 feet of the crosswalk and fewer drivers yielded more than 10 feet from the crosswalk, a counterintuitive result. At Mission & Persia, there was a decrease in the number of drivers yielding within 5 feet of the crosswalk and more drivers yielding more than 10 feet from the crosswalk.
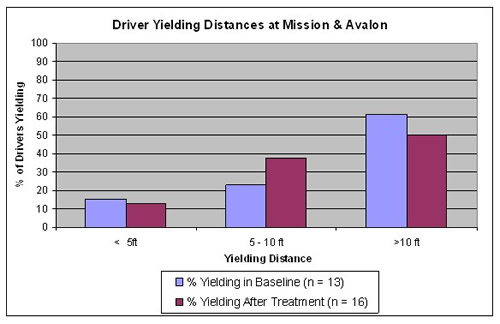
Figure 3. Driver Yielding Distances at Mission & Avalon
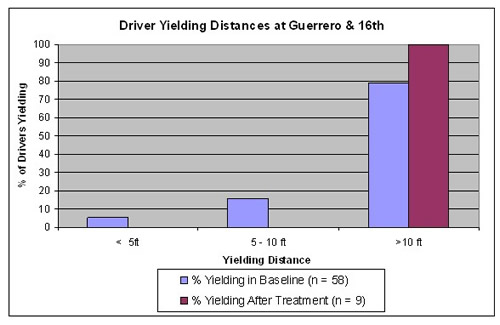
Figure 4. Driver Yielding Distances at Guerrero & 16th
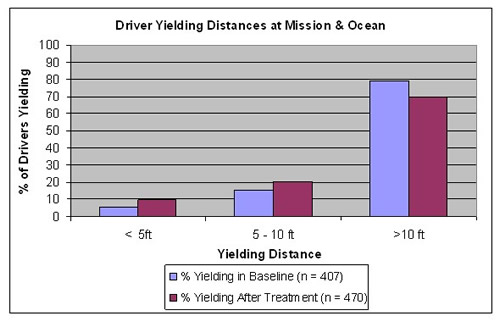
Figure 5. Driver Yielding Distances at Mission & Ocean (Significant Changes)
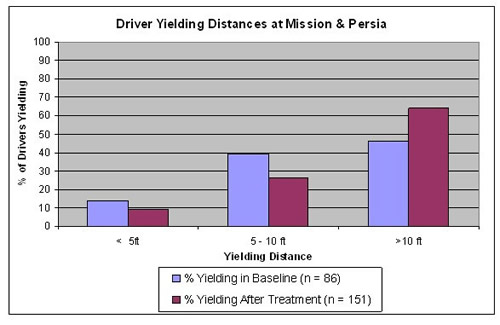
Figure 6. Driver Yielding Distances at Mission & Persia (Significant Changes)
The Las Vegas study team measured the percentage of drivers making a RTOR that came to a complete stop and the percentage of drivers blocking the crosswalk. The results are shown in Table 6 and Table 7, respectively. While there was a highly significant increase in drivers coming to a complete stop and a highly significant decrease in drivers blocking the crosswalk at Harmon and Paradise, the findings were the contrary at Lake Mead and Pecos.
| Site | % of RTOR Drivers that Come to a Complete Stop | % Change | p-value | |
|---|---|---|---|---|
| Before | After | |||
| Harmon & Paradise | 74.4 (n = 129) |
97.5 (n = 235) |
+23.1 | <0.0001 |
| Lake Mead & Pecos | 75.4 (n = 268) |
58 (n = 200) |
-17.4* | >0.05* |
| *Counterintuitive result; however statistical test not significant due to 1-tailed test. | ||||
| Site | % of Drivers Blocking the Crosswalk | % Change | p-value | |
|---|---|---|---|---|
| Before | After | |||
| Harmon & Paradise | 10.9 (n = 129) |
0 (n = 235) |
-10.9 | <0.0001 |
| Lake Mead & Pecos | 39.3 (n = 267) |
82.3 (n = 198) |
+43* | >0.05* |
| *Counterintuitive result; however statistical test not significant due to 1-tailed test. | ||||
| Site | % of Pedestrian-Vehicle Conflicts | % Change | p-value | |
|---|---|---|---|---|
| Before | After | |||
| Harmon & Paradise | 1.7 (n = 345) |
0.23 (n = 432) |
-1.47 | 0.021 |
| Lake Mead & Pecos | 2.4 (n = 421) |
0.6 (n = 481) |
-1.8 | 0.05 |
There were no significant impacts on pedestrians trapped in the roadway in Miami or at Harmon & Paradise in Las Vegas. The percentage of pedestrians trapped in the roadway did drop from 5.3 percent to 2.8 percent (p-value = 0.04) at Lake Mead & Pecos after installation of the signs 50 feet upstream of the intersection.
There were mixed and non-significant findings regarding pedestrian delay and crossing time at the San Francisco test sites and a significant increase in pedestrian delay at both Las Vegas sites.
Driver yielding behaviors and conflicts were the primary MOEs for assessing the effectiveness of the signs. The results show that there were only a few measurable significant changes in driver yielding behaviors and conflicts, and there were inconsistencies in these significant findings across the sites where the signs were installed. An increase in actual turning driver yielding was measured at only two of eight sites where the signs were installed, at Collins & 21st in Miami and at Lake Mead & Pecos in Las Vegas (where the sign was placed 50 feet upstream of the intersection). A decrease in conflicts was measured at only two of eight sites where the signs were installed, at Mission & Ocean in San Francisco and at Lake Mead & Pecos. Positive impacts on drivers stopping before RTOR and drivers blocking crosswalks were measured at Harmon & Paradise in Las Vegas (where the sign was placed at the intersection itself), while there were counterintuitive findings for the MOEs at Lake Mead & Pecos. Impacts on yielding distances were mixed across the four test sites in San Francisco. Based on these findings, it is difficult to make conclusions as the effectiveness of the signs in improving driver yielding behavior and in reducing pedestrian-vehicle conflicts.
It should be noted that neither of the signs evaluated in this project is proposed to be included in the next version of the MUTCD. The new R10-15 sign is similar to the text and symbol version tested in Miami, but includes color differences and a turning arrow.
In-street pedestrian crossing signs (2003 MUTCD R1-6 and R1-6a signs) are intended for use at uncontrolled (unsignalized) crosswalks to remind drivers of laws regarding pedestrians' rights-of-way (Figure 7). They are more noticeable than roadside signs and may also exert a minor traffic-calming effect by effectively narrowing the inside lanes slightly on roads with no raised median. The signs can be installed with either a portable or fixed base. The dimensions of the signs are 12" x 44", and the color is a fluorescent yellow-green diamond sheeting with 10" x 24" white high intensity sheeting inserts. The overall height of the signs is 47 inches.
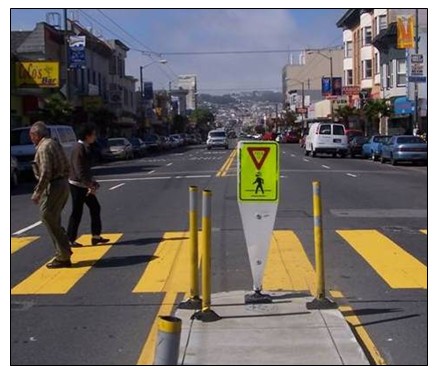
Figure 7. In-Street Pedestrian Sign in San Francisco
In-street pedestrian crossing signs were installed and tested in Miami, Las Vegas, and San Francisco. According to the Miami team, the cost for each sign was $225.00. The installation cost was $50.00 per sign for a total cost of $275.00 per installed sign.
The study sites for in-street pedestrian crossing signs are shown in Table 9. In Miami, in-street pedestrian signs were placed at three unsignalized intersections along Collins Avenue in South Beach (Figure 8). Two signs were installed at each of the three intersections, one for the northbound Collins approach and one for the southbound Collins approach. In San Francisco, in-street pedestrian signs were placed at four intersections. In Las Vegas, eight in-street pedestrian signs were placed along Bonanza in between D and F Street (Figure 9). A modified version of the sign stating, "watch for pedestrians," was used along Twain Avenue, and four of these signs were installed along Twain between Cambridge and Swenson Streets (Figure 10). Signs used in San Francisco and those used along Twain in Las Vegas did not include the STATE LAW or WITHIN CROSSWALK text associated with the MUTCD signs.
| Location | Study Sites | Site Descriptions |
|---|---|---|
| Miami | Collins & 6th Collins & 9th Collins & 13th |
This section of Collins Avenue is a 2-lane, 2-way roadway with parking on both sides of the roadway. The posted speed limit is 25 mph. |
| San Francisco | 16th & Capp (marked crosswalk) 16th & Capp (unmarked crosswalk) Mission & France Mission & Admiral |
The treatment intersections are medium-sized, low-speed intersections, located in institutional, commercial, or industrial areas. Street parking is present at all intersections. Two intersections are four-legged; Mission and Admiral is a skewed intersection, while Mission and France is a T-intersection. All intersections are stop-controlled and have two-way flow. |
| Las Vegas | Bonanza between D and F Twain Avenue between Cambridge and Swenson |
This section of Bonanza is a multi-lane, 2-way roadway. This section of Twain is a multi-lane, 2-way roadway. |
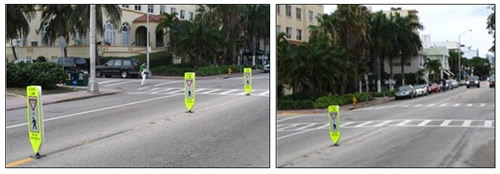
Figure 8. In-street Pedestrian Signs in South Miami Beach
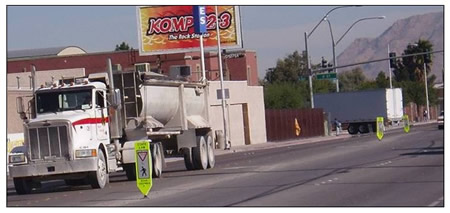
Figure 9. In-street Signs along Bonanza between D and F Streets in Las Vegas
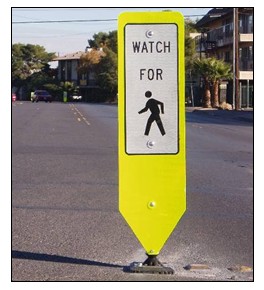
Figure 10. Modified Version of In-street Pedestrian Sign Installed along Twain Avenue in Las Vegas
The primary purpose of the in-street pedestrian signs is to increase driver awareness and yielding to pedestrians. Thus, MOEs considered critical in assessing the effectiveness of the in-street pedestrian signs included driver yielding, pedestrians trapped, and pedestrian-vehicle conflicts. These and other MOEs collected by the teams are shown in Table 10.
| Measure of Effectiveness | Miami | LV | SF |
|---|---|---|---|
| % of drivers yielding to pedestrians | X | X | X |
| Distance drivers yielded to pedestrians in crosswalk | X | ||
| % of cycles where a pedestrian was trapped in the roadway | X | X | X |
| % pedestrian-vehicle conflicts | X | X | |
| Average pedestrian delay | X | X |
The primary MOE used to assess the effectiveness of the in-street pedestrian signs was driver yielding. The Las Vegas team measured driver yielding to those pedestrians outside, but within 200 feet of the crosswalks on Bonanza at D and F Streets. Along Twain, driver yielding was measured for pedestrians crossing mid block between Cambridge and Swenson.
While the three field teams used different applications of the in-street pedestrian signs in terms of location and number of signs used, the signs proved to be very effective in increasing driver yielding. These results are shown in Table 11. Driver yielding increased from between about 13 percent and 46 percent depending on the location and the level of driver yielding measured in the baseline.
| Site | % of Drivers Yielding to Pedestrians | % Change | p-value | |
|---|---|---|---|---|
| Before | After | |||
| Miami: Collins & 6th | 32 (n = 400) |
78 (n = 440) |
46 | 0.01 |
| Miami: Collins & 9th | 21 (n = 400) |
65 (n = 240) |
44 | 0.01 |
| Miami: Collins & 13th | 34 (n = 1200) |
69 (n = 200) |
35 | 0.01 |
| San Francisco: 16th & Capp (marked crosswalk) | 60.5 (n = 519) |
73.6 (n = 447 |
13.1 | <0.01 |
| San Francisco: 16th & Capp (unmarked crosswalk) | 39.6 (n = 96) |
59.6 (n = 109) |
20 | <0.01 |
| San Francisco: Mission & France | 43 (n = 164) |
78 (n = 91) |
35 | <0.01 |
| San Francisco: Mission & Admiral | 22 (n = 41) |
57.4 (n = 47) |
35.4 | <0.01 |
| Las Vegas: Bonanza between D and F | 74 (n = 89) |
47 (n = 106) |
-27* | >0.05 |
| Las Vegas: Twain between Cambridge and Swenson | 7 |
35 |
18 | <0.001 |
| *Counterintuitive result; results are not significant due to 1-tailed test. | ||||
In addition to the percentage of drivers that yielded to pedestrians, the Las Vegas team measured the distance at which drivers yielded to pedestrians. The hypothesis was that the signs would increase yielding distances. The team observed driver yielding and recorded whether drivers yielded within 10 feet of the pedestrian, between 10 and 20 feet of the pedestrian, or more than 20 feet from the pedestrian. The before and after distributions for yielding distances are shown in Figure 11. Statistical comparisons were made for each of the three yielding distances, and the results showed that there was a significant increase in drivers yielding between 10 and 20 feet (15% increase, p < 0.05) and in drivers yielding more than 20 feet (15% increase, p < 0.05).
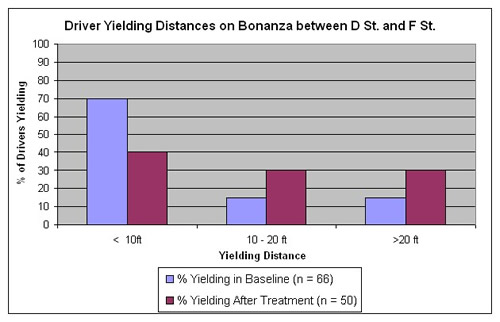
Figure 11. Yielding Distances at Las Vegas Site Before and After Installation of In-street Pedestrian Signs
While all three teams measured the percent of pedestrians trapped in the roadway at the test sites, there were no significant changes in this MOE at any of the sites.
There were no significant changes in the percentage of pedestrian-vehicle conflicts at the Miami sites or at two of the three sites in San Francisco. Only at Mission & Admiral in San Francisco was there a significant decrease in pedestrian-vehicle conflicts. Conflicts were reduced from 17.1 percent in the baseline to 2.1 percent after installation of the knockdown signs (p = 0.02).
There were no significant changes in average pedestrian delay in Las Vegas or at two of the three sites in San Francisco. Only at one of the sites in San Francisco (Mission & France) was there a significant change in average pedestrian delay after installation of the in-street pedestrian signs. Average pedestrian delay decreased from 7.9 seconds in the baseline to 5 seconds after installation of the knockdown signs (p = 0.02).
Based on the results of these studies, in-street pedestrian crossings signs are highly effective at increasing driver yielding to pedestrians. The location at the roadway centerline appears to capture drivers' attention more effectively than roadside signs. However, all three teams noted that while these signs were effective at increasing driver yielding, they had a very short lifespan at the many of the sites. In Miami, the test sites were narrow streets and did not have a median island to protect the signs. In Las Vegas, the signs were destroyed by trucks making turns at the test sites. Therefore, placement of the signs is critical to their continued effectiveness in increasing driver yielding and potentially improving pedestrian safety.
This countermeasure is intended to alert motorists that the upcoming section of roadway is associated with frequent pedestrian crossings. It includes a W11-2 pedestrian warning sign with a supplemental distance plaque (2 miles in the case of this deployment) that gives the distance that pedestrians may be encountered (Figure 12). The pedestrian warning sign is yellow in the shape of a diamond with a figure of a person walking. The Miami team acquired the signs for $25 each and installed them for $45 each.
Pedestrian zone signs were deployed at nine locations in the Miami area, approximately 30 feet from a crosswalk at an intersection. The signs were tested at a mid-block section of Collins Avenue between 10th Street and 11th Street, which is described in Table 12. The pedestrian zone warning sign was installed on Collins Avenue 10 meters north of 10th Street facing northbound traffic.
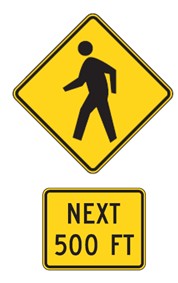
Figure 12. MUTCD W11-2 Pedestrian Warning Sign and Supplemental Distance Plaque
| Location | Study Sites | Site Descriptions |
|---|---|---|
| Miami | Collins Avenue between 10th and 11th Street |
Midblock location in the heart of the South Beach entertainment area. Collins Avenue is 2-lanes at this area and on-street parking with an ADT of 29,500 and a speed limit of 30 mph. Area has high density of pedestrians and high incidence of pedestrian crashes. |
The Miami study team used the following four MOEs to assess the impacts of the pedestrian zone signs on driver and pedestrian behavior:
The team measured driver speed prior to passing a pedestrian and the percent of pedestrians crossing when a vehicle was present that a conflict occurred. The percent of drivers who applied their brakes in the vicinity of a pedestrian was measured as a way to capture driver yielding behavior. Additionally, the Miami team collected data on the percent of pedestrians that were trapped in the crosswalk. It was expected that the pedestrian zone signs would increase driver braking for pedestrians and decrease vehicle speed, trapped pedestrians, and pedestrian-vehicle conflicts because drivers would be more cautious and alert to pedestrians in the area of the sign.
Following the deployment of the pedestrian zone signs, vehicle speeds when pedestrians were present did not change significantly. Before the sign was installed, driver speed averaged around 19 mph which was 10 mph below the posted speed limit of 30 mph. Driver speed probably did not decrease with the addition of the sign because speed was already so low.
There were no significant changes in average vehicle speed, the percentage of drivers braking when a pedestrian was present, or in the percentage of pedestrians trapped in the roadway at the study site. No conflicts were observed in the before or after conditions.
Collectively, these observations seem to indicate that the countermeasure was ineffective at altering driver behavior at this location. The researchers have suggested that this ineffectiveness may be related to the low speeds observed prior to deployment, which creates a "floor effect" in the data whereby there is not much margin for improvement. Also, the static nature of this warning sign against other signs may not draw the attention of many drivers.
Two types of active signs were installed and tested for their impact on pedestrian safety. These signs included:
The findings for the site-specific evaluations of these signs are presented below.
NO TURN ON RED (NTOR) signs are placed on signal mast arms as an indication to motorists that right turns on red are prohibited. The Miami team evaluated the relative effectiveness of three different types of NTOR signs was analyzed: 1) a static NO TURN ON RED (R10-11a 2003 MUTCD) sign, 2) a static and conditional NO TURN ON RED WHEN PEDESTRIANS IN CROSSWALK sign (the pre-existing sign) (not in the existing or proposed MUTCD), and 3) an electronic NO TURN ON RED SIGN that is illuminated only during the phases when right turns are prohibited and a pedestrian has pushed the call button. Each of these signs is shown in Figure 13. The electronic sign used by the Miami study team displayed a "YIELD TO PEDESTRIANS" message during the green phase for right-turners and was dark during the protected right turn phase.
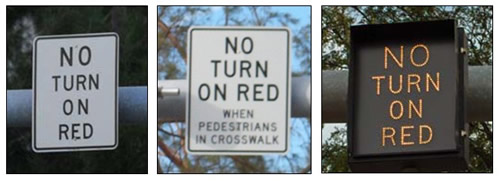
Figure 13. Static and Active NTOR Signs Tested in Miami
NTOR signs were deployed at one site in Miami (Table 13). In Miami, the three different types of NTOR signs mentioned above were deployed in phases at the intersection of 41st and Pine Tree. The intersection was chosen for deployment because it is within a high crash zone. The study team collected data on drivers using a dedicated right turn lane on Pine Tree Drive with a right turn indication that preceded the pedestrian WALK phase. The crosswalk observed for the study was across the south leg of Pine Tree Drive at 41st Street. At the beginning of the study, the data were collected with the conditional NO TURN ON RED WHEN PEDESTRIANS IN CROSSWALK sign installed. In the next phase, the conditional sign was replaced with a NO TURN ON RED sign. For the following phase, the static sign was replaced with the electronic sign. Finally, the electronic sign was removed and the conditional "NO TURN ON RED" sign was used again.
| Location | Study Sites | Site Descriptions |
|---|---|---|
| Miami | 41st & Pine Tree | Intersection of 2-way, four-lane arterials. Primary street is 41st with
an ADT of 39,000 vehicles per day. Location with history of motorist-pedestrian crashes wherein motorist turned right on red into a crossing pedestrian. Prior to study, intersection had a conditional NTOR (when pedestrians in crosswalk). |
Location with history of motorist-pedestrian crashes wherein motorist turned right on red into a crossing pedestrian.
Prior to study, intersection had a conditional NTOR (when pedestrians in crosswalk).
The purpose of NTOR signs is to reduce conflicts between right-turn vehicles and pedestrians by eliminate right turns during the red signal phase. Miami used the following four MOEs for the NTOR countermeasures:
The primary MOE for the NTOR signs was the percent of drivers violating the sign. Miami examined the effects of the sign on driver violations to include the percent of drivers violating the NTOR regardless of pedestrian presence and the percent of drivers violating the NTOR when pedestrians were at the curb. The percent of drivers making a stop before turning and pedestrian-vehicle conflicts was also assessed by the Miami study team.
The results for the primary measure of effectiveness, percentage of drivers violating the NTOR restriction, are shown in Table 14. Driver violations varied somewhat between the three NTOR signs, but violations were lowest with the electronic sign present. Violations were also lowest with the electronic sign for the two subcategories of violations: percent violations when a pedestrian was present at the curb and percent violations when a pedestrian was present in the crosswalk. When a pedestrian was in the crosswalk there was a 34 percent violation rate for the conditional static sign, 11 percent violation rate with the static NTOR sign, and a 6 percent violation rate for the electric or active NTOR sign. When a pedestrian was waiting to start to cross, violation rates were 90 percent and 94 percent for the conditional and static NTOR signs whereas the rate was only 25 percent for the active NTOR sign. Interestingly, the violation rate when pedestrians were present at the curb jumped back up to 92 percent after the electronic sign was replaced with the static NTOR sign.
| MOEs | Baseline Conditional Static |
% Drivers Violating the NTOR | p-value | ||
|---|---|---|---|---|---|
| Static NTOR (Measure 1) |
Active NTOR (Measure 2) |
Static NTOR (Measure 3) |
|||
| % violations—all | 34 | 41 | 32 | 48 | 0.0008 |
| % violations when ped present at curb | 90 | 94 | 25 | 92 | 0.0001 |
| % violations when ped present in crosswalk | 34 | 11 | 6 | 8 | 0.0001 |
Drivers who violated the NTOR sign were observed to be much more likely to make a full stop with the electronic sign present (78 percent) than with either of the static signs (29 percent and 31 percent). Likewise, drivers violating the sign were much less likely to make a rolling stop or not stop at all when the electronic sign was present than when either of the other signs were used. Full results are shown in Table 15 and graphically in Figure 14.
| MOEs | Baseline Conditional Static |
% Driver Violators Stopping Before RTOR | p-value | ||
|---|---|---|---|---|---|
| Static NTOR (Measure 1) |
Active NTOR (Measure 2) |
Static NTOR (Measure 3) |
|||
| % violators that made full stop | 29 | 31 | 78 | 65 | 0.0001 |
| % violators that made rolling stop | 30 | 29 | 9 | 20 | 0.0001 |
| % violators that did not stop | 41 | 40 | 13 | 15 | 0.0001 |
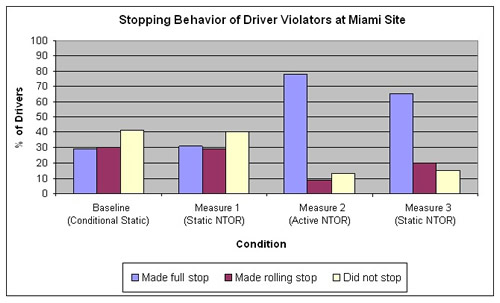
Figure 14. Stopping Behavior of Driver Violators at Miami Site
The results for drivers blocking the crosswalk are shown in Table 16. Interestingly, the percent of motor vehicles blocking the crosswalk rose with the electronic sign. The researchers hypothesize that this is the result of greater compliance with the prohibition (and therefore more people stopped waiting to turn).
| MOEs | Baseline Conditional Static |
% RTOR Drivers Blocking Crosswalk | p-value | ||
|---|---|---|---|---|---|
| Static NTOR (Measure 1) |
Active NTOR (Measure 2) |
Static NTOR (Measure 3) |
|||
| % drivers that blocked crosswalk | 1.7 | 0 | 20.8 | 20.2 | <0.0001 |
The frequency of evasive conflicts was small, but easily the lowest with the electronic sign (1 percent for conditional static sign, 2 percent for the static NTOR sign, and 0.1 percent for the electronic NTOR sign).
The results of this study indicate that the electronic NTOR sign was relatively effective in decreasing unsafe driver behaviors in the presence of pedestrians. Following installation of the electronic sign, there was a moderate reduction in overall turning violations (only 32 percent as compared to 41 percent with the static NTOR sign and 34 percent with the static conditional NTOR sign). Perhaps more importantly, there was a large reduction in turning violations when a pedestrian was present at the curb following installation of the electronic NTOR sign (only 25 percent as compared to over 90 percent with the static signs). There was also an increase in complete stops made prior to violating the turn prohibition and a reduction in conflicts. This sign may be especially effective in visually cluttered areas where motorists are less likely to see and respond to a static sign.
Portable radar speed trailers are used to deter speeding. These devices can be installed along the side of the road — typically in parking areas — and display the speed of each approaching vehicle. Above a user-selected maximum, the signs "blank out" to avoid enticing drivers into exhibitions of speed. A computer within the device records speed data.
Portable speed trailers were installed by all three field teams. In Miami and San Francisco, a speed limit sign was included on the trailer. In Las Vegas, the speed trailer display provided feedback on the fine associated with the speed, if applicable (Figure 15). In Miami, the speed trailers were furnished by the City of Miami Beach. The estimated cost for each trailer was $25 per day. The estimated installation cost was $45 per trailer.
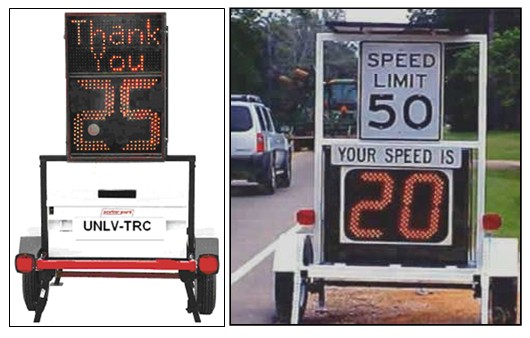
Figure 15. Portable Radar Speed Trailers (Left: Signs used in Las Vegas; Right: Signs used in San Francisco)
In Miami, a speed trailer was tested at a mid-block location in Miami Beach. The speed trailer was parked beside the road on Collins Avenue just beyond 38th Street in advance of an uncontrolled mid-block crosswalk. In Las Vegas, a speed trailer was tested at a mid-block location along Fremont between 6th and 7th Streets. In San Francisco, speed trailers were tested at four different locations. The study sites are described in Table 17.
| Location | Study Sites | Site Descriptions |
|---|---|---|
| Miami | Collins between 38th and 39th | This segment of Collins runs one-way northbound with three lanes and parking on both sides of the road. The posted speed limit is 30 mph. |
| Las Vegas | Fremont between 6th and 7th | Fremont Street is classified as a minor arterial and the posted speed limit is 25 mph. First 15 days was installed on the north side of street. Then speed trailer was installed on south side of street (for eastbound traffic). |
| San Francisco | 16th & Capp1 Mission & France Mission & Admiral1 Geary & 11th |
All intersections carry 2-way traffic on both streets. Side street traffic is controlled by stop signs. Posted speed limit at Mission & France and Geary & 11th is 40 mph. Posted speed limit at Mission & Admiral is 25 mph. |
| 1 Note, speed trailers were towed away during data collection at these sites; therefore, results are not presented for these sites | ||
Application of the speed trailers varied between the three locations. In Miami, the speed trailer was placed just downstream of a signalized intersection in advance of an uncontrolled mid-block crosswalk. At this site, pedestrians were observed crossing mid-block, outside of the designated uncontrolled midblock crosswalk. This site was selected to manage drivers' speeds prior to this mid-block crossing area. In San Francisco, speed trailers were placed along streets in areas where the cross streets were controlled by stops signs only. These sites were selected to manage drivers' speeds along these uncontrolled sections of roadway and to increase driver yielding to pedestrians attempting to cross the major streets in the crosswalks at the unsignalized intersections.
The teams collected a variety of MOEs to test the impacts of the speed trailers on pedestrian safety and mobility, as shown in Table 18. The purpose of portable radar speed trailers is to deter speeding. Therefore, the most critical MOE in assessing the effectiveness of the speed trailers was vehicle speed in the vicinity of the speed trailers. Other MOEs important in the assessment of the speed trailers included driver yielding to pedestrians at mid-block locations, pedestrians trapped in the roadway, pedestrian-vehicle conflicts, and pedestrian delay.
| Measure of Effectiveness | Miami | LV | SF |
|---|---|---|---|
| Vehicle speed | X | X | |
| % of drivers yielding to pedestrians | X | X | X |
| % of cycles where a pedestrian was trapped in the roadway | X | X | |
| % of pedestrian-vehicle conflicts | X | X | |
| Pedestrian delay | X |
Both the Miami and San Francisco teams measured vehicle speeds in the vicinity of the speed trailers. In Miami, speeds were measured for vehicles that were observed during a sample of 30 pedestrians crossing outside of the crosswalk between 38th and 39th Streets. In San Francisco, vehicle speeds were measured in the vicinity of the speed trailers, which were placed upstream of crosswalks at 2-way stopped controlled intersections. These results are presented in Table 19.
| Site | Vehicle Speed | % Change | p-value | |
|---|---|---|---|---|
| Before | After | |||
| Miami: Collins between 38th and 39th | 25.9 (n = 3301) |
26.2 (n = 3001) |
+0.30 | 0.05 |
| San Francisco: Mission & France | 26 (n = 642) |
24 (n = 462) |
-2 | <0.01 |
| San Francisco: 1Geary & 11th | 29 (n = 802) |
25 (n = 492) |
-4 | <0.01 |
| 1 Number of pedestrian crossings observed 2 Number of vehicle-pedestrian interactions |
||||
There was a statistically significant, albeit not practically significant, increase in mean speed measured on Collins Avenue. In San Francisco, there was a small but significant decrease in mean speed measured at both sites.
In addition to measuring vehicle speeds, the teams measured driver yielding. The Miami team measured a surrogate for driver yielding by recording the percentage of drivers who applied the brakes when a pedestrian was crossing outside of the mid-block crosswalk. These results are presented in Table 20. The results show that the average number of drivers braking during mid-block pedestrian crossings increased by about 10 percent while the speed trailer was at the site.
The San Francisco team measured driver yielding to pedestrians in the crosswalks at the 2-way stop controlled intersections just downstream of the portable speed trailers. The Las Vegas team measured driver yielding to pedestrians crossing Fremont midblock between 6th and 7th Streets. The results are shown in Table 21. The results show that driver yielding increased significantly at Geary & 11th, and while there was an increase in yielding at Mission & France, it was not statistically significant. The Las Vegas team measured a large decrease in driver yielding.
| Site | % Driver Breaking | % Change | p-value | |
|---|---|---|---|---|
| Before | After | |||
| Collins between 38th and 39th | 44 (n = 3301) |
54 (n = 3001) |
+10 | 0.05 |
| 1 Number of pedestrian crossings observed | ||||
| Site | % of Drivers Yielding to Pedestrians | % Change | p-value | |
|---|---|---|---|---|
| Before | After | |||
| San Francisco: Mission & France | 78.1 (n = 641) |
89.1 (n = 461) |
+11 | 0.20 |
| San Francisco: Geary & 11th | 37.5 (n = 801) |
59.2 (n = 491) |
+21.7 | 0.01 |
| Las Vegas: Fremont between 6th and 7th | 67 (n = 96) |
43 (n = 28) |
-232 | >0.0522 |
| 1 Vehicle-pedestrian interactions. 2 Counterintuitive result; not significant due to 1-tailed test. |
||||
There were almost no pedestrians trapped in the roadway before or after installation of the speed trailer at the Miami or Las Vegas sites.
The San Francisco team also measured average pedestrian delay. The hypothesis was that if the speed trailers increased driver yielding to pedestrians mid-block that there would be a corresponding decrease in pedestrian delay. The average pedestrian delays before and after installation of the speed trailers are shown in Table 22. The results show that there was a significant decrease in average pedestrian delay at both sites, and these decreases correspond to the increases in driver yielding shown in Table 21. At Geary and 11th, average pedestrian delay decreased by about 4 seconds per pedestrian, which corresponds to the nearly 22 percent increase in the percentage of drivers yielding to pedestrians at this site after installation of the speed trailer. At Mission & France, average pedestrian delay decreased by 1.35 seconds. This smaller decrease corresponds to the 11 percent, albeit not statistically significant, increase in driver yielding at this site after installation of the speed trailer.
| Site | Average Pedestrian Delay (sec) | % Change | p-value | |
|---|---|---|---|---|
| Before | After | |||
| San Francisco: Mission & France | 13.4 (n = 113) |
12 (n = 114) |
-1.4 | 0.01 |
| San Francisco: Geary & 11th | 14.6 (n = 71) |
10.5 (n = 52) |
-4.1 | 0.01 |
Vehicle-pedestrian conflicts were measured by the Miami and San Francisco teams. No vehicle-pedestrian conflicts were observed in Miami either before or after installation of the speed trailers. In San Francisco, there were no significant changes in vehicle-pedestrian conflicts after installation of the speed trailers. There were also no significant impacts on pedestrians trapped in the roadway in Miami as a result of the speed trailer.
Average vehicle speed and driver yielding were the primary MOE for assessing the effectiveness of the speed trailers. The results show only small reductions in average speeds at the San Francisco sites and no measurable changes in average speeds at the Miami sites. There were significant increases in the percentage of drivers yielding / braking during the presence of pedestrians at the Miami site and at one of the San Francisco sites, and this increase in yielding also resulted in significant decreases in pedestrian delay at both sites in San Francisco. There were no significant changes in the other MOEs measured by the teams in the assessment of portable speed trailers. Based on these findings, it appears that the speed trailers can impact drivers' speeds and possibly increase their awareness of the presence of pedestrians at these locations.
Several types of pavement markings were installed and tested for their impact on pedestrian safety. These pavement markings included:
The findings for the site-specific evaluations for each of these pavement markings are presented below.
The objective of the high visibility crosswalk is to enhance visibility of the crossing area in an attempt to indicate to drivers where pedestrians will be crossing the roadway. By increasing the visibility of the crosswalk, this countermeasure could also be expected to encourage more pedestrians to use crosswalks.
High visibility crosswalks were installed in a number of locations in Las Vegas where existing crosswalks had faded or were otherwise inconspicuous to both drivers and pedestrians (Figure 16).
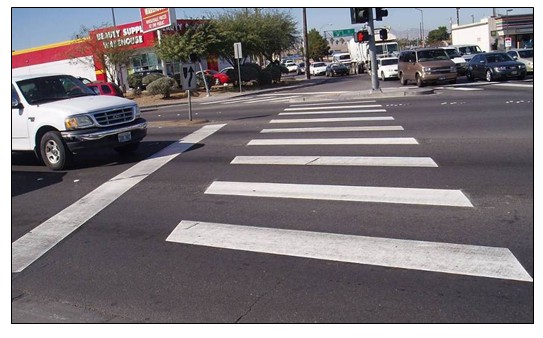
Figure 16. Example of High-visibility Crosswalks Tested in Las Vegas
The Las Vegas team installed a variety of countermeasures at each test site in a staged approach. Therefore, high visibility crosswalks were installed and tested at a number of intersections in Las Vegas. As such, the high visibility crosswalks were sometimes installed in combination with other countermeasures as well as in different stages of installment at the sites. This presentation of the results of the high visibility crosswalks includes only those locations where high visibility crosswalks were installed in Stage 1. These sites are described in Table 23.
At the intersections of Flamingo & Koval and Lake Mead & Las Vegas Boulevards a high visibility crosswalk was installed in Stage 1 and was the only treatment applied to the intersections during this stage. At Maryland Parkway & Sierra Vista, a high visibility crosswalk was installed in stage 1 in combination with relocating the existing pedestrian warning sign and installing a raised pavement marking standard line 100 feet long at the upstream crosswalk.
| Study Sites | Site Descriptions |
|---|---|
| Flamingo & Koval | Installed in Stage 1 (only countermeasure) |
| Lake Mead & Las Vegas Blvds. | Installed in Stage 1 (only countermeasure) |
| Maryland Pkwy & Sierra Vista | Installed in Stage 1 in combination with relocating the existing pedestrian warning sign and installing an RPM standard line from the crosswalk 100 feet upstream on the Maryland Pkwy approaches to the intersection. |
As the purpose of high visibility crosswalks is to enhance the visibility of the crossing area so that drivers are aware of where the pedestrians are crossing, the primary MOEs in assessing the effectiveness of the crosswalks include:
The Las Vegas team measured driver yielding at the test sites both before and after installation of the high visibility crosswalks. Drivers that were observed were those making right turns on green on all four approaches to the intersections at Flamingo & Koval and Lake Mead & Las Vegas Blvds and those drivers making right turns on green and permissive left turns from Maryland Parkway onto Sierra Vista. The results are shown in Table 24. It can be seen that in all three locations there was actually a decrease in driver yielding after installation of the crosswalk treatments.
| Site | % of Drivers Yielding to Pedestrians | % Change | p-value | |
|---|---|---|---|---|
| Before | After | |||
| Maryland Pkwy & Sierra Vista (right turn on green and permissive left turn drivers from Maryland Pkwy onto Sierra Vista) |
63 (n = 30) |
38 (n = 158) |
-25* | >0.05 |
| Flamingo & Koval (right turn on green yielding on all four approaches) |
89 (n = 164) |
7 (n = 278) |
-82* | >0.05 |
| Lake Mead & Las Vegas Blvds. (right turn on green yielding on four approaches) |
35 (n = 68) |
27 (n = 247) |
-8* | >0.05 |
| * Counterintuitive result; results are not significant due to 1-tailed test. | ||||
The before and after measurements of the percentage of drivers blocking the crosswalks at each of the three test sites are shown in Table 25. These results are mixed, with a very large increase in drivers blocking the crosswalk at Maryland Parkway & Sierra Vista. The only significant decrease in the percentage of drivers blocking the crosswalk occurred at Flamingo & Koval, where the percentage dropped from 21 to 3 percent after installation of the high visibility crosswalk treatment.
| Site | % of Drivers Blocking the Crosswalk | % Change | p-value | |
|---|---|---|---|---|
| Before | After | |||
| Maryland Pkwy & Sierra Vista | 1 (n = 89) |
61 (n = 158) |
+60* | >0.05 |
| Flamingo & Koval | 21 (n = 105) |
3 (n = 88) |
-18 | <0.0001 |
| Lake Mead & Las Vegas Blvds. | 21 (n = 68) |
19 (n = 247) |
-2 | >0.05 |
| * Counterintuitive result; results are not significant due to 1-tailed test. | ||||
The Las Vegas team also measured the distance that drivers yielded in advance of the crosswalk during their turns. The before and after distributions of driver yielding are shown in Figure 17 through Figure 19. At Maryland Parkway & Sierra Vista (Figure 17) there was a significant shift in drivers yielding less than 5 feet from the crosswalk to drivers yielding 5 to 10 feet before the crosswalk. At Lake Mead & Las Vegas Boulevards (Figure 18) there was a similar shift, but the change was not statistically significant. At Flamingo & Koval (Figure 19) there was actually a significant increase (14 percent) in drivers yielding less than 5 feet from the crosswalk after the high visibility crosswalk treatment was installed.
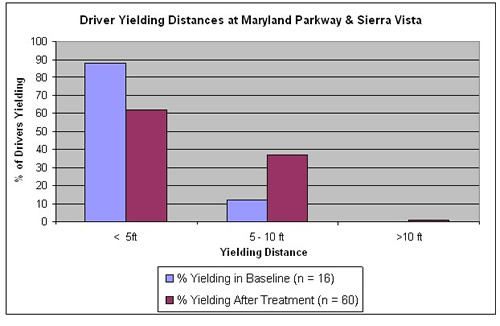
Figure 17. Distribution of Driver Yielding Distances at Maryland Parkway & Sierra Vista
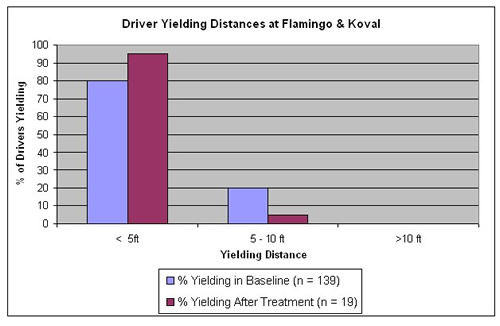
Figure 18. Distribution of Driver Yielding Distances at Flamingo & Koval
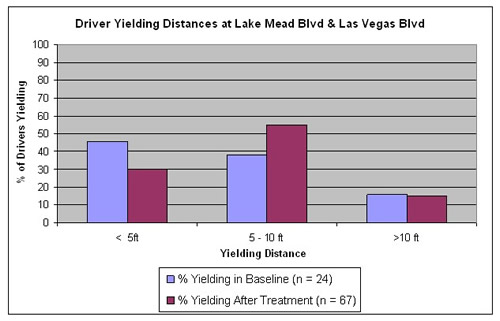
Figure 19. Distribution of Driver Yielding Distances at Lake Mead & Las Vegas Boulevards
Based on these results, high visibility crosswalks do not appear to be effective in changing driver behaviors in a desirable way. This result could be due in part to the fact that the crosswalk markings deteriorated in a matter of weeks as a result of the heat causing a release of oils in the pavement.
Vehicles often encroach into crosswalks while waiting either to make a right turn on red or for the signal to change. This behavior can prevent pedestrians from having a clear path to cross the street in the crosswalk. Advanced stop lines are pavement markings at intersections in advance of the crosswalk that indicate to motorists where they should stop at the intersection. They are intended to reduce the occurrence of motorists blocking the crosswalk and to reduce conflicts between pedestrians and vehicles.
Advance stop lines were installed and tested in San Francisco, as shown in Figure 20. A supplemental countermeasure, red visibility curb zones, was evaluated concurrently. These red lines prohibit on-street parking in the immediate vicinity of the intersection, thereby improving the visibility between pedestrians and motorists.
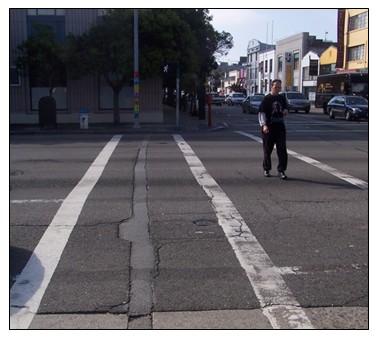
Figure 20. Advance Stop Lines Tested in San Francisco
Advance stop lines were installed and tested at two locations, one signalized intersection and one unsignalized intersection, in San Francisco. These study sites are described in Table 26.
| Study Sites | Site Descriptions |
|---|---|
| Geary & 11th | Stop-controlled, major street with posted speed limit of 30 mph, on-street parking, four legs, mixed residential land use |
| Market & Noe | Signalized, major street with posted speed limit of 25 mph, on-street parking, six legs, residential land use |
There were no significant changes in driver yielding, vehicle stopped position, or pedestrian-vehicle conflicts at either site after installation of the advance stop lines.
Based on these results, it appears that advance stop lines had no impacts on driver behavior.
LOOK pavement stencils are pavement markings designed to remind pedestrians to look for vehicles before crossing, as shown in Figure 21. These markings were tested in San Francisco as an inexpensive alternative to incorporating animated eyes in the countdown pedestrian signal. Originally, the San Francisco study team intended to use the countdown signal with animated eyes but was unable to due to lack of product availability.
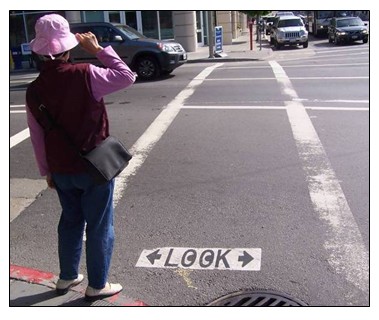
Figure 21. LOOK Pavement Stencils Tested in San Francisco
The pavement markings used in San Francisco were three feet long and one foot wide, and were made using white thermoplastic material. The word LOOK was shown between two arrows pointing toward the directions of cross traffic. Eyeballs were added inside the Os to enhance the message. These pavement markings were applied to the roadbed facing the sidewalk along the gutter line. San Francisco also used bilingual, custom-made LOOK signs with both English words and Chinese characters in certain locations.
The LOOK pavement stencils were studied at four intersections in San Francisco (Table 27). Pedestrian and driver behaviors were observed at Harrison & 4th, Mission & 17th, and Geary & 6th.whereas only customer satisfaction surveys were conducted at the Columbus & Broadway site.
| Study Sites | Site Descriptions |
|---|---|
| Harrison & 4th | 4-leg signalized intersection with low traffic speeds (25-30 mph) and on-street parking. Located in primarily commercial district. Consists of one-way streets and includes turn lanes for a freeway on-ramp. |
| Columbus & Broadway | 4-leg signalized intersection with low traffic speeds (25-30 mph) and on-street parking. Located in primarily commercial district. Skewed intersection |
| Mission & 17th | 4-leg signalized intersection with low traffic speeds (25-30 mph) and on-street parking. Located in primarily residential district. |
| Geary & 6th | 4-leg signalized intersection with low traffic speeds (25-30 mph) and on-street parking. Located in primarily residential district. Raised median present on Geary |
The pavement stencils were expected to increase the number of pedestrians that look for vehicles before entering the crosswalk and to reduce vehicle-pedestrian conflicts. The following MOEs were used by San Francisco to test the effectiveness of the pavement stencils in meeting these objectives:
The results for the primary MOE, pedestrian looking behavior, are shown in Table 28. The results show that the LOOK pavement stencils were not effective in increasing pedestrian looking behavior. The overall incidence of pedestrian looking actually decreased (increases were observed at one site), though the local data collection team cautions that this MOE was difficult to observe given the video data collection methodology.
| Site | % Pedestrians that Look Before Crossing | % Change | p-value | |
|---|---|---|---|---|
| Before | After | |||
| Harrison & 4th | 58.6 (n = 232) |
49.1 (n = 281) |
-9.5* | 0.12 |
| Mission & 17th | 70.6 (n = 506) |
53.3 (n = 1410) |
-17.3* | <0.01 |
| Geary & 6th | 57.4 (n = 418) |
55.3 (n = 331) |
-2.1* | 0.69 |
| * Counterintuitive result; results are not significant due to 1-tailed test. | ||||
| Site | % Pedestrians that Look Toward Intersection | % Change | p-value | |
|---|---|---|---|---|
| Before | After | |||
| Harrison & 4th | 37.9 (n = 136) |
24.6 (n = 138) |
-13.3* | 0.02 |
| Mission & 17th | 37.9 (n = 136) |
43.8 (n = 752) |
-14.1* | <0.01 |
| Geary & 6th | 34.7 (n = 240) |
43.8 (n = 180) |
+9.1 | 0.06 |
| * Counterintuitive result; results are not significant due to 1-tailed test. | ||||
| Site | % Pedestrians that Look Over Shoulder | % Change | p-value | |
|---|---|---|---|---|
| Before | After | |||
| Harrison & 4th | 1.3 (n = 136) |
0 (n = 138) |
22.7 (n = 180) |
0.25 |
| Mission & 17th | 20.6 (n = 357) |
12.3 (n = 752) |
-8.3* | <0.01 |
| Geary & 6th | 4.8 (n = 240) |
22.7 (n = 180) |
+17.9 | <0.01 |
| * Counterintuitive result; results are not significant due to 1-tailed test. | ||||
Regarding the occurrence of pedestrian-vehicle conflicts, there were no significant changes after installation of the pavement stencils.
It is not believed that the stencils were responsible for the changes in pedestrian looking behavior, but rather data collection inconsistencies or some other outside factor. Given the difficulty experienced by the data collection team, it is recommended that video camera angles and placements should be pilot tested to ensure that the MOEs are easily observable. Although the LOOK stencil markings are one of the least expensive countermeasures tested, the results indicate that this may not be an effective countermeasure. Additionally, the San Francisco team noted that they were highly susceptible to fading and blemishes.
A range of signals and signal timing strategies was implemented and tested for their impact on pedestrian safety. These signals and signal timing strategies included:
The findings for the site-specific evaluations for these countermeasures are presented below.
This treatment consisted of a pedestrian countdown signal that displayed a walking person symbol during the WALK indication. It then counted down the seconds in the clearance phase along with the flashing hand display and finally, displayed the solid hand during the DON'T WALK indication which began during the all red phase. The signals were programmed to begin the countdown at the start of the pedestrian clearance (flashing hand) phase and counted down to 0 at the end of the yellow phase.
In Las Vegas, the signal also displayed "animated eyes" to remind pedestrians to look left and right for vehicles before crossing the street (Figure 22).
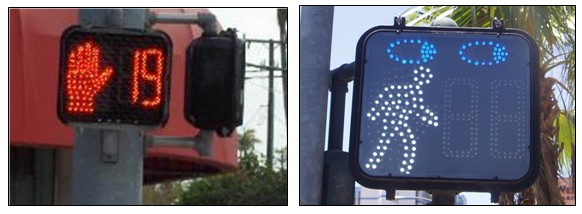
Figure 22. Pedestrian Countdown Signal with Animated Eyes
Pedestrian countdown signal study sites are shown in Table 29. In Miami, pedestrian countdown signals were installed and tested at two sites just four blocks from each other in South Beach. Pedestrians were observed crossing Alton Road, a multi-lane arterial road in Miami Beach at Lincoln in the first site and at 16th at the second site. Pedestrian-vehicle collisions are more likely to occur among older pedestrians in this location than in other parts of Miami.
In Las Vegas, pedestrian countdown signals were installed and tested at the intersection of Flamingo Road and Koval Lane. The countdown signals were deployed at all four crosswalks. At this intersection, there were three stages of pedestrian safety countermeasure deployment. The countdown signals were installed in the second stage following high-visibility crosswalks, which were geared more toward drivers.
| Study Sites | Site Descriptions |
|---|---|
| Miami: Alton & Lincoln | Alton is a multi-lane arterial with ADT of 46,000. |
| Miami: Alton & 16th | Alton is a multi-lane arterial with ADT of 46,000. |
| Las Vegas: Flamingo & Koval | Flamingo Road is a major arterial with an ADT of 40,500 near Koval Lane. |
The Miami and Las Vegas study teams used a variety of measures focused on pedestrian behavior to gauge the effectiveness of the pedestrian countdown signal in increasing pedestrian compliance with the signal and assisting pedestrians in making informed decisions about crossing so that they are less likely to be still be in the crosswalk at the end of the crossing phase. These MOEs are shown in Table 30. Two of the MOEs considered critical for assessing this countermeasure were the percent of pedestrians violating the signal and the percent of pedestrians in the crosswalk at the end of the flashing DON'T WALK. Other important MOEs were used by the teams to look at other aspects of pedestrian signal compliance such as the percent of cycles in which the call button was pressed.
At Alton and Lincoln, there was a long delay between the collection of baseline data and the installation of the countdown signals. At the other Miami site, Alton and 16th, the countdown signals were installed in the second phase of a two phase pedestrian safety countermeasure deployment at that intersection. During the first phase, call buttons that confirm the press were installed and the data collected at this phase were used as the baseline data for the next countermeasure that was installed, countdown pedestrian signals.
| Measure of Effectiveness | Miami | LV |
|---|---|---|
| % of cycles the call button was pressed | X | |
| % of pedestrians in the crosswalk at the end of the flashing DON’T WALK | X | |
| % of pedestrians violating the signal | X | |
| % of pedestrians beginning their crossings during the WALK | X | |
| % of pedestrians in the crosswalk at the end of the all red | X | |
| % of pedestrians who look for vehicles before crossing ? | X |
The Miami study team observed the percent of cycles where a pedestrian was present that the call button was
| Site | % of Cycles the Call Button was Pressed | % Change | p-value | |
|---|---|---|---|---|
| Before | After | |||
| Miami: Alton & Lincoln | 35 (n = 450) |
95 (n = 450) |
+60 | 0.01 |
| Miami Alton & 16th | 62.7 (n = 810) |
79.7 (n = 300) |
+17 | 0.01 |
The Las Vegas team measured a 19 percent increase in pedestrians still in the crosswalk at the end of the flashing DON'T WALK (Table 32), which was a counter-intuitive finding.
| Site | % Pedestrians in the Crosswalk at the End of the Flashing DON'T WALK | % Change | p-value | |
|---|---|---|---|---|
| Before | After | |||
| Las Vegas: Flamingo & Koval | 31 (n = 455) |
50 (n = 544) |
+19* | >0.05* |
| * Counterintuitive result; results are not significant due to 1-tailed test. | ||||
In Las Vegas, the percent of pedestrians violating the signal remained the same at the low level of 5 percent (Table 33). The lack of decrease with the introduction of countdown pedestrian signals may be due to the already low level of violators. Las Vegas' definition of signal violation includes only those pedestrians who step into or near the crosswalk during the solid red hand.
| Site | % Pedestrians Violating the Signal | % Change | p-value | |
|---|---|---|---|---|
| Before | After | |||
| Las Vegas: Flamingo & Koval | 5 (n = 303) |
5 (n = 235) |
0 | NA |
Results from Las Vegas in Table 34 show that there was a large and significant increase in the percent of pedestrians that began their crossing during the WALK phase. This increase corresponds to the increase in the percent of signal cycles that the call button was pushed, but does not seem to align with the increase in pedestrians in the crosswalk at the end of the flashing red hand, presumably because the increase in pedestrians entering the crosswalk earlier in the phase should mean a decrease in pedestrians still in the crosswalk late in the phase.
| Site | % Pedestrians Beginning their Crossings during the WALK | % Change | p-value | |
|---|---|---|---|---|
| Before | After | |||
| Las Vegas: Flamingo & Koval | 51 (n = 455) |
80 (n = 544) |
+29 | <0.001 |
The Las Vegas team measured a significant increase in the percent of pedestrians that looked for vehicles before crossing at the study site (Table 35).
| Site | % Pedestrians who Look for Vehicles Before Crossing | % Change | p-value | |
|---|---|---|---|---|
| Before | After | |||
| Las Vegas: Flamingo & Koval | 63 (n = 380) |
86 (n = 235) |
+23 | <0.001 |
There were no significant impacts of the pedestrian countdown signal countermeasure on the percentage of pedestrians in the crosswalk at the end of the all red in Las Vegas.
The increased use of the call buttons after installation of the countdown signals points to an increase in safe pedestrian behavior as a result of the pedestrian countdown signals. The increase in call button pushing was anticipated because the pedestrians receive more feedback when they press the button.
The results from the Las Vegas study team were mixed. While Las Vegas found a 29 percent increase in pedestrians beginning their crossings during the WALK phase and a consistent low level of pedestrians violating the signal (5 percent), they measured a substantial (19 percent) increase in pedestrians that were still in the crosswalk at the end of the flashing DON'T WALK. Two of the crosswalks at this intersection were very long, requiring pedestrians to cross 10 lanes within 22 seconds. The Las Vegas researchers noted that this was not enough time for some pedestrians to cross which may account for some of the high percent of pedestrians in the crosswalk at the end of the flashing DON'T WALK in the before (31 percent) and after cases (50 percent), but it is still unknown what the reasons were for the combination of shifts seen in pedestrian crossings between the before and after conditions.
The Las Vegas study team also measured pedestrians' looking behavior before crossing and found a large (23 percent) increase in the percent of pedestrians that looked before crossing the street. It is possible that the animated eyes incorporated into the countdown signal deployed by Las Vegas led pedestrians to be more watchful when crossing the street.
In summary, the pedestrian countdown signal appears to be an effective and low cost way to increase safe pedestrian behavior.
Call buttons that confirm the press consist of a pedestrian stainless steel push button with a piezo driven solid state switch that provides two types of feedback when the push button is pressed. First, the button is illuminated with a 1200 millicandela red light emitting diodes (LED) for 0.1 second (Figure 23). Second, a 2.6 kHz tone is sounded simultaneously with the LED flash when the button is pressed and a 2.3kHz tone is sounded when the button is released. The device could also be modified so the light remains on until the onset of the "WALK" indication. The audio and visual feedback helps to ensure that the feedback will be detected by pedestrians even with bright sunlight.
As reported by the Miami team, the cost for each pedestrian push button was $105.00. The installation cost was $40.00 per call button for a total cost of $145.00 per installed button.
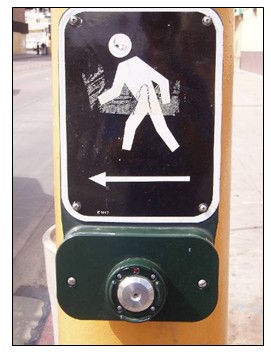
Figure 23. Call Buttons Tested in Miami
The Las Vegas study team deployed the push button that confirms press at all four crosswalks of the intersection of Fremont Street and 7th Street. Fremont Street is a minor arterial where pedestrian safety issues include not using the crosswalks, a high percentage of elderly pedestrians involved in crashes, and pedestrians failing to yield. In Miami, the buttons were installed at 17 intersections but data were collected at only two intersections: 41st Street & Pine Tree Drive and Alton Road & 16th Street. Call buttons that confirm the press were installed only at the crosswalks across 41st Street and Alton Road, whereas in Las Vegas, call buttons that confirm the press were installed for all four crosswalks at the study site. The study sites are summarized in Table 36.
| Study Sites | Site Descriptions |
|---|---|
| Miami: 41st St. and Pine Tree Dr. | Multilane arterial with bi-directional ADT of 39,000. |
| Miami: Alton Road and 16th St. | Multilane arterial with bidirectional ADT of 46,000. |
| Las Vegas: Fremont St and 7th St. | Minor arterial, commercial land use area with hotels and casinos. Speed limit of 25 mph on Freemont. 4-legged intersection. ADT on Fremont Street is 13,800 (2006). |
The teams used a variety of MOEs to assess the effectiveness of the call buttons that confirm the press. Call buttons that confirm the press give pedestrians feedback to let them know that the button is operating and that the signal is responding to their request. This is likely to increase confidence in pedestrians that the signal system is serving their needs as well as the motorists' needs. This is expected to lead to an increase in push button use by pedestrians as well as fewer signal violations by pedestrians. Because pedestrians are waiting for the WALK to cross, there should also be fewer pedestrians trapped in the roadway.
The specific MOEs used to assess the effectiveness of the call buttons that confirm the press are shown in Table 37. MOEs considered to be critical in assessing the effectiveness of the buttons include the frequency of pedestrian signal violations and the percent of cycles in which the button had been pushed. Other important MOEs include the frequency of pedestrians crossing during the WALK and pedestrians trapped.
| Measure of Effectiveness | Miami | LV |
|---|---|---|
| % of cycles in which call button has been pushed | X | |
| Frequency of pedestrian signal violation | X | X |
| Pedestrians crossing during the WALK | X | X |
| Pedestrians trapped | X | X |
The Miami study team measured the percent of signal cycles in which the call button was pressed when there was a pedestrian present with the opportunity to press the button. The results in Table 38 below show a significant increase in the call button presses across both Miami sites.
| Site | % Cycles Call Button Pressed | % Change | p-value | |
|---|---|---|---|---|
| Before | After | |||
| Miami: 41st St. and Pine Tree Dr. | 33.8 (n = 420) |
58.1 (n = 570) |
+24.3 | 0.01 |
| Miami: Alton Road and 16th St. | 41.8 (n = 600) |
54.2 (n = 810) |
+12.4 | 0.01 |
The percent of pedestrian signal violations was defined differently in Miami and Las Vegas. The Miami study team used a stricter definition of pedestrian signal violation such that any crossing that began outside of the WALK phase was considered a violation. In Las Vegas, a violation was recorded only when the pedestrian began crossing when the solid red hand was displayed on the pedestrian head. The before and after results of the pedestrian signal violations are shown in Table 39. The results below show significant decreases in the percentage of pedestrians violating the signal across both definitions of violation in both Miami and Las Vegas.
| Site | % Pedestrians that Began Their Crossing outside of the WALK Phase | % Change | p-value | |
|---|---|---|---|---|
| Before | After | |||
| Miami: 41st St. and Pine Tree Dr. | 70.4 (n = 879) |
52.6 (n = 1044) |
-17.8 | 0.01 |
| Miami: Alton Road and 16th St. | 59.7 (n = 1577) |
51.7 (n = 2490) |
-8 | 0.01 |
| Site | % Pedestrians that Began Their Crossing during the Solid DON'T WALK Phase | % Change | p-value | |
|---|---|---|---|---|
| Before | After | |||
| Las Vegas: Fremont St.: 6th St. to 8th St. | 14 (n = 437) |
9 (n = 275) |
-5 | <0.05 |
The Miami and Las Vegas study teams both looked at the impact that the call buttons that confirm press had on pedestrians beginning to cross during the WALK phase. This is a similar measure to the percent of pedestrians violating the signal, although it is not quite the inverse of this measure in either the Miami or Las Vegas studies. Miami measured the percent of pedestrians who pushed the call button that waited to cross during the WALK phase. This is more restrictive than the measure used by the Las Vegas team where any pedestrian crossing during the WALK phase was counted, not just those that pushed the button. The results are shown in Table 40.
The results from Miami show a significant increase in the percent of pedestrians who press the button that wait to cross until the WALK phase. Las Vegas actually measured an insignificant decrease in the percent of pedestrians that crossed during the WALK phase. The percent of pedestrians beginning to cross during the WALK phase was fairly high (79 percent) before the push button was installed, so it may be that all of the pedestrians that would be persuaded to push the button by this new countermeasure were already doing so.
| Site | % Pedestrians who Pressed Button that Waited for WALK Phase | % Change | p-value | |
|---|---|---|---|---|
| Before | After | |||
| Miami: 41st St. and Pine Tree Dr. | 51.2 (n = 142) |
72.5 (n = 331) |
+21.3 | 0.01 |
| Miami: Alton Road and 16th St. | 82.1 (n = 248) |
85.9 (n = 439) |
+3.8 | 0.05 |
| Site | % Pedestrians that Begin Crossing during the WALK Phase | % Change | p-value | |
|---|---|---|---|---|
| Before | After | |||
| Las Vegas: Fremont St.: 6th St. to 8th St. | 79 (n = 202) |
71 (n = 248) |
-8 | >0.05 |
Both study teams found a small decrease in the percent of signal cycles that pedestrians were trapped in the roadway although that decrease was significant in only two of the three intersections studied (Table 41). Since pedestrians get trapped in the roadway often when they begin crossing late in the cycle, a decrease would be reasonable given the corresponding increase in pedestrians beginning their crossings during the WALK phase.
For this MOE, both the Miami and Las Vegas research teams scored a pedestrian as trapped if the pedestrian had to wait at least 5 seconds before finishing crossing in the middle of the road, at the centerline, or between lanes because of through traffic or a string of turning vehicles. Miami measured the percent of cycles in which a pedestrian crossed that a pedestrian was trapped. In Miami, the percentage of cycles that a pedestrian was trapped was computed by dividing the number of times a pedestrian was trapped in the road by the number of cycles that a pedestrian crossed. Alternatively, Las Vegas looked at the percent of crossing pedestrians that were trapped.
| Site | % Cycles Pedestrians Trapped in the Roadway | % Change | p-value | |
|---|---|---|---|---|
| Before | After | |||
| Miami: 41st St. and Pine Tree Dr. | 3.8 (n = 420) |
3.1 (n = 570) |
-0.7 | >0.05 |
| Miami: Alton Road and 16th St. | 4.7 (n = 600) |
2.4 (n = 810) |
-2.3 | 0.025 |
| Site | % Pedestrians Trapped in the Roadway | % Change | p-value | |
|---|---|---|---|---|
| Before | After | |||
| Las Vegas: Fremont St.: 6th St. to 8th St. | 2 (n = 437) |
0.4 (n = 275) |
-1.6 | <0.05 |
The call button that confirms press shows a fairly strong positive impact on safe pedestrian behaviors in both Miami and Las Vegas. Out of all three intersections tested, the data indicate a significant decrease in pedestrian signal violations. The Miami study team found a significant increase in button pushing behavior and the percent of pedestrians who pushed that call button that waited to cross until the WALK phase. Additionally, two out of three intersections studied showed a significant decrease in pedestrians trapped in the roadway. Given these findings, the call button that confirms press has been demonstrated to be a cost-effective way to increase safe pedestrian behavior. It was difficult to see the LED light in bright Florida sunlight. It appeared that the auditory feedback was more critical to the efficacy of the device. In areas with less bright sunlight the pilot light might be more salient. These buttons might also be useful to visually impaired pedestrians because they confirm the button press. However, accessible call buttons with a locator tone would be preferred when taking into account the needs of visually impaired pedestrians.
Automated pedestrian detection is used to automatically detect pedestrians and put a call into the traffic signal or some other device to warn drivers of the presence of pedestrians. Automated pedestrian detection was deployed in Miami and San Francisco to either activate the pedestrian phase or to adjust signal timing as needed to accommodate pedestrians in the crosswalk. In Miami, video detection technology was deployed to detect pedestrians on the sidewalk approaching the curb at a mid-block traffic signal. Two rectangular zones were set up on the sidewalk approaching the curb, and pedestrians had to cross both zones to trigger the device. The device could determine direction of movement by the order in which the zones were crossed. With this method the pedestrian only put in a call when entering the crosswalk.
In San Francisco, video detection technology was installed to provide additional crossing time for pedestrians in the crosswalk. There were three detection zones, including the south curb zone, the center zone, and the north curb zone. As a pedestrian crossed the street, a video camera mounted on a utility pole detected the pedestrians crossing into each zone (Figure 24). If a pedestrian was detected at a time and location where it was predicted that the pedestrian would not reach the curb before the light turned red, the signal controller extended the solid red hand (Don't Walk), along with the green ball for the parallel motor vehicle traffic, up to 3 seconds. When such an extension was made, a compensating reduction in the Walk phase on the next cycle was made so that the cross street did not lose overall green time at the signal.
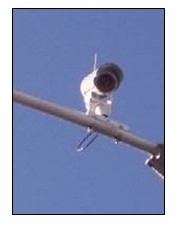
Figure 24. Camera Used for Automated Pedestrian Detection
The video detection system in Miami was installed at one mid-block traffic signal along Alton Road in South Beach. At this mid-block crossing, pedestrians do not always use the push button to activate the traffic signal that provides them a protected crossing. The video detection system in San Francisco was installed at one crosswalk at the intersection of 9th and Howard Streets in the SOMA West District. Table 42 shows the automated pedestrian detection study sites.
| Study Sites | Site Descriptions |
|---|---|
| Miami: Alton Road | Mid-block traffic signal |
| San Francisco: 9th & Howard | Intersection crosswalk |
The field teams collected a variety of MOEs to test the impacts of the pedestrian detection technology on pedestrian safety and mobility, depending on the purpose of the pedestrian detection. These MOES are shown in Table 43. In Miami, the purpose of the pedestrian detection was to detect pedestrians at the curb before they entered the crosswalk, putting a call into the traffic signal controller to provide a WALK for the pedestrians and a red light for the roadway motor vehicle traffic.
In San Francisco, the purpose of the pedestrian detection was to extend the walk time for pedestrians still in the crosswalk late in the clearance phase. MOEs considered to be critical to assessing the automated pedestrian detection in this study were pedestrian clearance and pedestrian-vehicle conflicts.
| Measure of Effectiveness | Miami | LV |
|---|---|---|
| % of cycles where a pedestrian was trapped in the roadway | X | X |
| % of pedestrians crossing entire crosswalk during the WALK | X | |
| % of pedestrians that cleared crosswalk during flashing DON’T WALK | X | |
| % of pedestrians that cleared crosswalk during red hand | X | X |
| % of pedestrians pressing the call button | X | |
| % of pedestrians crossing during the WALK ? | X | |
| % of pedestrians crossing 2nd half of crosswalk during the WALK | X | |
| % of pedestrians crossing none of the crosswalk during the WALK | X | |
| % vehicle-pedestrian interactions | X | |
| % of cycles with pedestrian-vehicle conflicts | X | X |
| Pedestrian delay | X | |
| % of diverted pedestrians | X | |
| Note: Miami broke down those pedestrians not crossing entirely on the WALK into two groups: 1) those that benefited from the WALK call put in by automatic detection for the second half of the crossing (last two lanes), and 2) those that did not benefit at all because they finished the crossing before the WALK (crossed none of the crosswalk during the WALK). | ||
There were no significant impacts on pedestrian clearance at the intersection crosswalk in San Francisco or at the mid-block crosswalk in Miami where pedestrian detection was installed. There were significant reductions in pedestrians being trapped in the roadway in the mid-block crosswalks in Miami, as shown in Table 44, but not in San Francisco (there were no pedestrians trapped in either the baseline or post deployment in San Francisco). After the pedestrian detection was installed, the Miami team measured a 9 percent reduction in the percentage of cycles where a pedestrian was trapped.
| Site | % of Cycles Where Pedestrian is Trapped / % Pedestrians Trapped | % Change | p-value | |
|---|---|---|---|---|
| Before | After | |||
| Miami: Alton Road mid-block crossing (cycles) | 17 | 8 | -9 | 0.0453 |
| San Francisco: 9th & Howard (pedestrians) | 0 | 0 | 0 | NA |
There was a very low incidence of pedestrian-vehicle conflicts both before and after installation of the pedestrian detection in Miami and San Francisco, and there were no significant impacts of the pedestrian detection systems on the other MOEs collected by the teams.
The only significant finding, a 9 percent reduction in the percentage of pedestrians trapped in the roadway at the Miami study intersection, suggests that pedestrians may have been making safer crossings; however, there were no measurable impacts of the pedestrian detection systems on pedestrian clearance or conflicts with motor vehicles. The San Francisco team did note that the technology appeared to be a promising, but needed further testing and refinement.
Activated flashing beacons are used to alert drivers to a pedestrian crossing in the crosswalk ahead and to encourage pedestrians to cross at the crosswalk. This countermeasure consists of flashing yellow lights at a crosswalk that are either activated by the pedestrian pushing a button at the curb or by an automated pedestrian detection device. In Las Vegas, the flashing yellow lights were over the crosswalk on a mast arm and included downward lighting above the crosswalk, as shown in Figure 25. The lights were activated by a pedestrian pushing a button at the curb. The flashing yellow lights used in San Francisco were mounted on poles located on the side of the road at the crosswalk, as shown in Figure 26. A push button was used for activation at one site (16th & Capp) in San Francisco and automated detection with infrared sensors was used for the other site (Mission & Santa Rosa). The infrared sensors were installed on the curb using both an above ground bollard and an in-surface activation device, as shown in Figure 27.
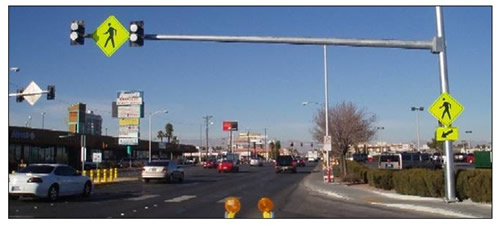
Figure 25. Overhead Flashing Beacons Tested in Las Vegas
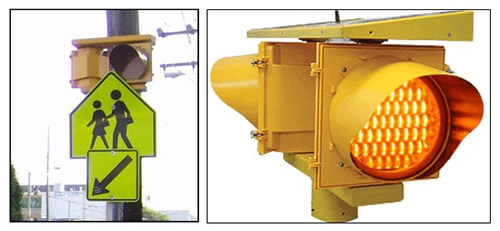
Figure 26. Activated Flashing Beacons Used in Las Vegas (Left) and San Francisco (Right)
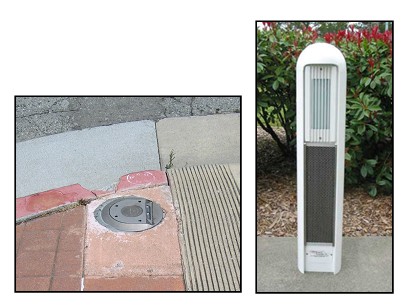
Figure 27. In-surface (Left) and Above Ground Bollard (Right) Sensors Used in San Francicso
The activated flashing beacon study sites are described in Table 45. In Las Vegas, the activated flashing beacon was deployed at the unsignalized intersection of Maryland Parkway and Dumont Street, a primarily commercial area with shopping complexes and a shopping mall. Maryland Parkway is a major arterial with a speed limit of 30 mph and an ADT of 43,000. Dumont Street is a minor arterial with a posted speed limit of 25 mph. The activated flashing beacons and push buttons were installed for pedestrians crossing either direction across Maryland Parkway.
The flashing beacons were installed in the third stage of a three-stage pedestrian safety improvement effort at that intersection. Prior to the installation of flashing beacons, the following countermeasures were deployed: Danish offset, median refuge, high-visibility crosswalk, and advance yield markings with a vehicles-must-yield-to-pedestrians sign.
In San Francisco, the activated flashing beacon was tested at two intersections. Two types of flashing beacons were studied at two intersections. At 16th & Capp, the beacon was push button activated and at Mission & Santa Rosa it was activated by infrared automatic detection.
The countermeasure was deployed at 16th and Capp for pedestrians crossing 16th at a marked intersection on the west side. The second deployment site was Mission and Santa Rosa for the marked crosswalk over Mission on the north side of the intersection. Advanced stop lines were also installed at both sites in San Francisco. The lines were installed on at the Mission and 16th approaches. The intersection of 16th and Capp additionally received an in-street pedestrian yield sign.
| Study Sites | Site Descriptions |
|---|---|
| Las Vegas Maryland Pkwy & Dumont | A 4-legged intersection in a commercial area. Maryland Parkway is a major arterial with a speed limit of 30 mph and an ADT of 43,000. |
| San Francisco: 16th & Capp | A 4-legged intersection in a mixed land use area near a transit station and school. Capp is stop-controlled. There are three through lanes on 16th and 2 through lanes on Capp at the intersection. The speed limit is 25 mph. |
| San Francisco: Mission & Santa Rosa | A 3-legged intersection in a mixed residential and commercial area with a 25 mph speed limit. There are four through lanes on Mission and 2 through lanes on Santa Rosa at the intersection. |
The Las Vegas and San Francisco study teams collected a variety of MOEs to test the impacts of the activated flashing beacons on pedestrian safety and mobility, as well as driver mobility, as shown in Table 46. Activated flashing beacons were expected to reduce vehicle-pedestrian conflicts, to increase the number of drivers that yield to pedestrians, as well as to increase the number of pedestrians that cross within the designated crosswalk. It was also expected that this countermeasure would help reduce pedestrian delay due to increase driver yielding. The countermeasure was not expected to significantly increase driver delays. Measures of effectiveness considered critical for assessing activated flashing beacons were percent of pedestrian-vehicle conflicts, percent of drivers yielding to pedestrians, distance drivers yield before crosswalks, and percent of diverted pedestrians. Other important MOEs are also included in Table 46.
| Measure of Effectiveness | LV | SF |
|---|---|---|
| % of diverted pedestrians | X | X |
| % of pedestrians trapped in the roadway | X | X |
| % of drivers yielding to pedestrians | X | X |
| Distance drivers yield before crosswalk | X | X |
| Average pedestrian delay | X | X |
| Average vehicle delay | X | |
| % pedestrian-vehicle conflicts | X |
To assess the effectiveness of the activated flashing beacons on pedestrian safety, the teams measured the percent of diverted pedestrians, or the percentage of pedestrians that modified their paths to use the crossing with the flashing beacons, and that walked out of their way to do so. The results of this measure are presented in. The only significant result shows a decrease in the percent of diverted pedestrians, a counterintuitive result. Table 47.
| Site | % of Diverted Pedestrians | % Change | p-value | |
|---|---|---|---|---|
| Before | After | |||
| Las Vegas: Maryland Pkwy & Dumont | 11 (n = 198) |
23 (n = 452) |
+12 | >0.05 |
| San Francisco: 16th & Capp | 16.1 (n = 372) |
16.4 (n = 324) |
-0.3 | 0.92 |
| San Francisco: Mission & Santa Rosa | 19.1 (n = 319) |
9.5 (n = 327) |
-9.6* | <0.01 |
| * Counterintuitive result | ||||
The study teams also measured the percent of pedestrians that were trapped in the roadway before and after the flashing beacons were installed. Although all three sites showed a decrease, only one site had a statistically significant decrease in the percent of pedestrians trapped as presented in Table 48.
| Site | % of Pedestrians Trapped in the Roadway | % Change | p-value | |
|---|---|---|---|---|
| Before | After | |||
| Las Vegas: Maryland Pkwy & Dumont | 4 (n = 198) |
1.3 (n = 452) |
-2.7 | >0.05 |
| San Francisco: 16th & Capp | 1.3 (n = 372) |
0 (n = 120) |
-1.3 | 0.34 |
| San Francisco: Mission & Santa Rosa | 4.1 (n = 319) |
0 (n = 327) |
-4.1 | <0.01 |
The study teams also assessed the impact of the activated flashing beacons on driver yielding, and the results are shown in Table 49. The Las Vegas study team measured no change in the percent of drivers yielding to pedestrians; however, this follows several increases in yielding measured in the first two phases of pedestrian safety countermeasure installations at the Maryland Parkway and Dumont intersection. Figure 28 and Figure 29 show the results of the driver yielding measured at the two San Francisco sites. At these sites, the San Francisco team recorded drivers yielding to all pedestrians ("full yield), drivers yielding to some, but not all pedestrians ("partial yield"), and drivers not yielding. At both sites there was a significant increase in the percent of drivers fully yielding to pedestrians and a corresponding drop in drivers that did not yield.
| Site | % of Drivers Yielding to Pedestrians | % Change | p-value | |
|---|---|---|---|---|
| Before | After | |||
| Maryland Pkwy & Dumont | 76 (n = 246) |
77 (n = 840) |
+1 | >0.05 |
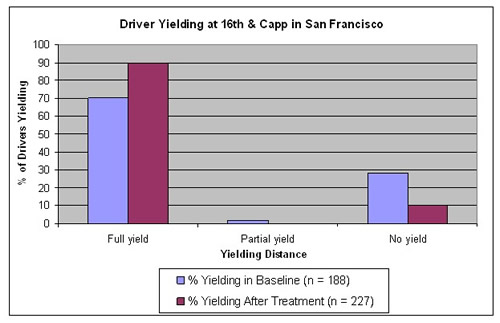
Figure 28. Driver Yielding at 16th & Capp
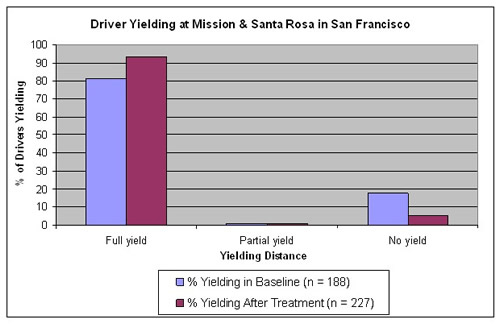
Figure 29. Driver Yielding at Mission & Santa Rosa
The effects of the activated flashing beacon on the distance from the crosswalk that drivers yielded are shown in Figure 30. The Las Vegas team grouped drivers yielding less than 10 feet from the crosswalk, between 10 and 20 feet, and greater than 20 feet from the crosswalk. The Las Vegas results show a substantial decrease in the percentage of drivers yielding closer to the crosswalk (less than 10 feet) (p<0.001). The results also show significant increases in the percentage of drivers yielding 10 to 20 feet away and in drivers yielding more than 20 feet away (p<0.001 and p<0.05, respectively).
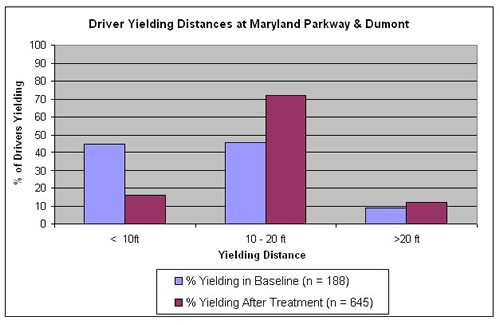
Figure 30. Driver Yielding Distances at Maryland Parkway & Dumont
The San Francisco team looked at drivers yielding less than 5 feet from the crosswalk, between 5 and 10 feet, and greater than 10 feet from the crosswalk. The team's results are presented in Figure 31 and Figure 32. At the intersection of 16th and Capp, there were significant increases in yielding farther from the crosswalk, whereas at Mission and Santa Rosa, there were significant increases in yielding closer to the crosswalk. Data collected at Mission and Santa Rosa may have been impacted by observation errors due to a poor camera angle.
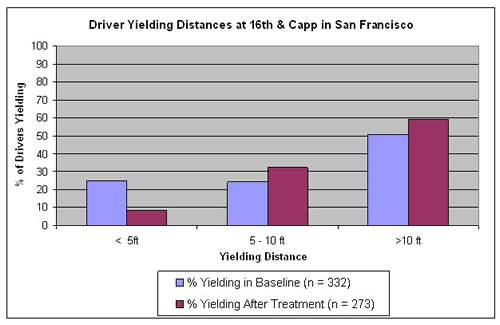
Figure 31. Driver Yielding Distances at 16th & Capp
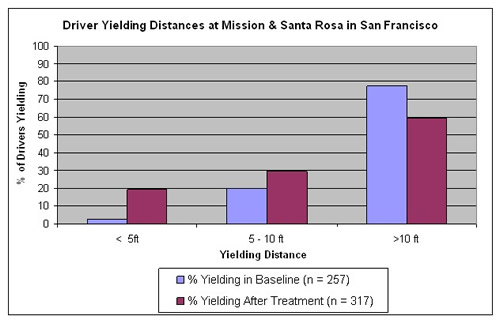
Figure 32. Driver Yielding Distance at Mission & Santa Rosa
Significant decreases were measured in pedestrian delay at both study intersections in San Francisco as shown in Table 50. There was a non-significant increase in pedestrian delay at the Las Vegas site.
| Site | Average Pedestrian Delay (sec) | % Change | p-value | |
|---|---|---|---|---|
| Before | After | |||
| Las Vegas: Maryland Pkwy & Dumont | 7.46 (n = 198) |
8.12 (n = 452) |
+0.66 | >0.05 |
| San Francisco: 16th & Capp | 4.8 (n = 372) |
3.2 (n = 365) |
-1.6 | <0.01 |
| San Francisco: Mission & Santa Rosa | 4.4 (n = 319) |
2.9 (n = 327) |
-1.5 | <0.01 |
The Las Vegas team measured vehicular delay at the activated flashing beacon site. The results are shown in Table 51. Overall, vehicle delay was reduced by almost 3 seconds at the Maryland Parkway and Dumont intersection.
| Site | Average VehicleDelay (sec) | % Change | p-value | |
|---|---|---|---|---|
| Before | After | |||
| Las Vegas: Maryland Pkwy & Dumont | 3.81 (n = 246) |
1.25 (n = 1633) |
-2.56 | <0.001 |
The percent of pedestrian-vehicle conflicts decreased significantly after the activated flashing beacon was implemented at both intersections in San Francisco as shown in Table 52.
| Site | % Pedestrian-Vehicle Conflicts | % Change | p-value | |
|---|---|---|---|---|
| Before | After | |||
| San Francisco: 16th & Capp | 6.7 (n = 372) |
0.8 (n = 120) |
-5.9 | <0.01 |
| San Francisco: Mission & Santa Rosa | 6.1 (n = 312) |
2.9 (n = 335) |
-3.2 | 0.05 |
Results from the San Francisco and Las Vegas study teams show mixed impacts from the deployment of activated flashing beacons. There were some clear improvements in safe driver behaviors in San Francisco. Driver yielding increased significantly at both intersections, and pedestrian-vehicles conflicts decreased. Pedestrian mobility, as measured through pedestrian delay, improved significantly. At Mission and Santa Rosa, there were some counterintuitive results such as a decrease in yielding distance and a decrease in the percentage of pedestrians that walk out of their way to use the crosswalk.
In Las Vegas, the activated flashing beacons generally did not result in significant changes in driver behaviors. Driver yielding decreased by a surprising 62% along with a significant decrease in driver delay. Those drivers that did yield, yielded at a greater distance from the crosswalk.
The rectangular rapid flashing beacon (RRFB) is used to supplement standard pedestrian warning signs. The apparatus tested consisted of two LED flashers placed on either side of the pedestrian warning sign, as shown in Figure 33. The flashers were each 6 inches wide and 2.5 inches high, were placed 9 inches apart, and were visible to both directions of traffic. The two LEDs flashed in a wig-wag (left-right) pattern. The flash pattern consisted of the left LED flashing two times (in a slower type of a rapid flash). Each time the left LED was energized, it was followed by the right LED, which flashed in a very fast rapid three flash volley. There were a total of 190 flashes per 30-second cycle. The device was activated by pedestrians pushing call buttons. Four signs were installed at each crosswalk, and the devices were linked by radio frequency transponders so a depression of any of the pedestrian call buttons activated the flashers on all four signs. A separate LED facing the pedestrian notifies him or her that the device has been activated, and an audible message reinforces the visual cue to the pedestrian.
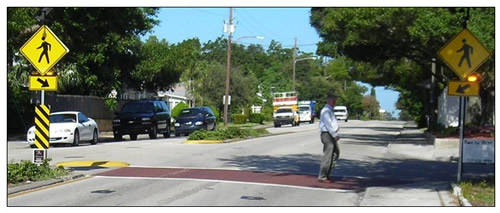
Figure 33. RRFB in Miami
The Miami team evaluated the RRFB at two multilane crosswalks in Miami, Florida under FHWA permission to experiment (Table 53). A reversal design was employed in this experiment to demonstrate experimental control at each site. At the South Bayshore Drive crosswalk a sign was placed on the left side of each approach and on the right side of each approach at the median island. At the NW 67th Street site a sign along with beacons was placed on the left side of each approach and on the right side at a median just after the crosswalk on the northbound approach and before the crosswalk on the southbound approach.
| Study Sites | Site Descriptions |
|---|---|
| Miami: NW 67th St. & Main Street | The crosswalk on NW 67th Street in Miami Lakes traversed two lanes in the southbound direction and two lanes and a turning lane in the northbound direction. There was no median island at this location. The two-way ADT on NW 67th Street was 25,215. The posted speed limit at the crosswalk was 40 mph. |
| Miami: South Bayshore Drive & Darwin | The crosswalk on South Bayshore Drive in Coconut Grove traversed two lanes in the southbound direction and two lanes in the northbound direction. A median island that included a cut for pedestrians separated traffic in both directions at this location. The two-way ADT on South Bayshore Drive was 38,996. The posted speed limit at the crosswalk was 35 mph. |
The Miami study team collected a variety of MOEs to test the impacts of RRFBs on pedestrian safety, as shown in Table 54. RRFBs were expected to reduce vehicle-pedestrian conflicts, to increase the number of drivers that yield to pedestrians, as well as to increase the number of pedestrians that cross within the designated crosswalk. Measures of effectiveness considered critical for assessing RRFBs are percent of pedestrian-vehicle conflicts, percent of drivers yielding to pedestrians, and percent of pedestrians trapped, as shown in Table 54.
| Measure of Effectiveness | Miami |
|---|---|
| % of pedestrians trapped in the roadway | X |
| % of drivers yielding to pedestrians | X |
| % pedestrian-vehicle conflicts | X |
The Miami team observed local resident crossings as well as staged crossings. Staged crossings always followed a specific crossing protocol. First, the pedestrian placed one foot in the crosswalk when an approaching vehicle was just beyond the cone placement distance (this is the measured distance for the vehicle speed, which ensures a safe stopping distance for vehicles traveling at the posted speed). If the vehicle made no attempt to stop, the pedestrian did not proceed to cross and scored the vehicle and any subsequent vehicles as not yielding. If the vehicle clearly began to yield and the next lane was free, the staged pedestrian would begin crossing. The staged pedestrian always stopped at the lane line and make sure the next lane was clear. If a large gap appeared the staged pedestrian finished the crossing. This is essentially the protocol followed by police officers when they conduct pedestrian crossing enforcement sting operations. This protocol insures the safety of the staged pedestrians. Residents were only scored if they initiated a crossing in the same manner as the staged pedestrian by placing at least one foot in the crosswalk. Pedestrians that did not place a foot into the crosswalk were not scored because according to the Florida Statutes, drivers are not required to yield unless the pedestrian is in the crosswalk.
The results showed that the RRFBs produced a marked increase in yielding behavior at both crosswalks and that similar data were collected from staged pedestrians and local residents using the crosswalks (Table 55 through Table 57). Data also indicated that the use of the device produced a reduction in evasive conflicts between drivers and pedestrians at both sites and a reduction in the percentage of pedestrians trapped in the center of the road at the crosswalk without a median island.
| Site | % Drivers Yielding | % Change | |
|---|---|---|---|
| Before | After | ||
| Miami: NW 67th & Main Street | 4.2 (n = 2330) |
55.2 (n = 2131) |
+51 |
| Miami: S Bayshore & Darwin | 4.1 (n = 2075) |
60.1 (n = 1361) |
+56 |
| Site | % Drivers Yielding | % Change | |
|---|---|---|---|
| Before | After | ||
| Miami: NW 67th & Main Street | 4.4 (n = 703) |
69.8 (n = 223) |
+65.4 |
| Miami: S Bayshore & Darwin | 2.5 (n = 139) |
66 (n = 225) |
+63.5 |
Combining the daytime and nighttime measured yielding at NW 67th & Main Street, an analysis of variance showed a p-value of 0.01 (F = 256.12) (a significant increase in driver yielding). Combining the daytime and nighttime measured yielding at S. Bayshore & Darwin, an analysis of variance showed a p-value of 0.01 (F = 467.9) (a significant increase in driver yielding).
| Site | % Drivers Yielding | % Change | p-value | |
|---|---|---|---|---|
| Before | After | |||
| Miami NW 67th & Main Street | 12.5 (n = 137) |
73.7 (n = 259) |
+61.2 | 0.001 |
| Miami S Bayshore & Darwin | 5.4 (n = 200) |
83.4 (n = 111) |
+78 | 0.001 |
An analysis of variance of the resident crossings at NW 67th & Main Street showed a p-value of 0.01 (F = 53.18), a significant increase in driver yielding to local resident crossings. An analysis of variance of the resident crossings S Bayshore & Darwin showed a p-value of 0.01 (F = 148.85), a significant increase in driver yielding to local resident crossings.
The percentage of evasive conflicts at the crosswalk on NW 67th Street averaged 11 percent during the baseline condition and declined to 2.5 percent during the first treatment condition and tended to remain lower for the remainder of the study independent of the condition. The percentage of evasive conflicts at the crosswalk on South Bayshore Drive averaged 5.5 percent at the crosswalk at this site during the baseline condition and declined to 0 percent during the first treatment condition. In general returns to baseline were associated with increased conflicts while returns to the treatment condition were associated with declines in conflicts at this site. An analysis of variance of the conflicts showed a p-value < 0.05 (F = 6.63) and < 0.01 (F = 13.85) for NW 67th & Main and at Bayshore & Darwin, respectively, which indicates a significant decrease in evasive conflicts was observed in the flasher condition at both sites.
Pedestrians were trapped at the centerline at NW 67th Street during 44 percent of the crossing during the baseline condition. The percentage of pedestrians trapped declined to 0.5 percent after the rapid flash beacon treatment was introduced. This change was replicated each time treatment was introduced and removed at this site, with a high percentage of pedestrians trapped when the treatment was absent and few pedestrians trapped when the treatment was present. An analysis of variance shows a p-value of < 0.01, which indicates that a significant decrease in trapped pedestrians was observed in the flasher condition.
The results of this study showed that the use of the RRFBs increased yielding to staged pedestrians and local residents. The similar results for staged and resident pedestrians validated the use of staged pedestrian methodology to determine levels of yielding and to evaluate the efficacy of treatments designed to increase yielding behavior. It was interesting that yielding to local residents was somewhat higher than yielding to staged pedestrians. This may be because staged pedestrians' protocol was somewhat less assertive than the crossing method used by local residents.
The results of the study also showed clear safety benefits associated with the introduction of the pedestrian activated RRFB. One change was a reduction in the number of pedestrians trapped in the middle of the road at the crosswalk on NW 67th Street. Increases in driver yielding should be related to reductions in the number of pedestrians trapped in the center of the road. When drivers are forced to cross busy roads in gaps because of poor yielding behavior they often can only get a gap to cross the first half. Once they are trapped in the roadway with vehicles passing in front and behind them they are likely to become uncomfortable and may as a result be less likely to select as good a gap to finish crossing.
The RRFB treatment reduces the percentage of people trapped by increasing driver yielding. The percentage of pedestrians trapped in the middle of the road was not measured at South Bayshore Drive because there was a wide median island in place. Essentially, crossing the second half of South Bayshore Drive was like beginning a new crossing from a place of relative safety.
The reduction of evasive conflicts at both sites was another safety finding. At the crosswalk on South Bayshore Drive the number of conflicts decreased each time the RRFB treatment was introduced and increased each time it was removed. At NW 67th Street the decrease in conflicts after the RRFB was introduced was maintained each time it was removed. This may have represented some type of learning effect on the part of motorists.
One reason why this device was so effective may be related to the salience of the flashing sequence. Another reason may be related to the direct correlation between the pedestrian sign and the flashing device. The flashing device likely produces driver orientation to the pedestrian sign and making it stand out from the clutter. The correlation between the flashing light and sign with the presence of a pedestrian crossing the street likely helps establish and maintain control of the sign over driver behavior.
While the RRFB treatment did not make it into the MUTCD Notice of Proposed Amendments, it has been given interim approval by FHWA.
The leading pedestrian interval is an exclusive pedestrian phase that gives pedestrians a small head start before vehicular turning movements begin (Figure 34). The pedestrian walk symbol is given a few seconds prior to the green light for parallel vehicle traffic. It is designed to give pedestrians a chance to enter the intersection before turning motorists, thereby increasing pedestrian visibility and correspondingly increasing driver yielding behavior and reducing conflicts. The leading pedestrian interval is thought to be most useful in intersections with high turning volumes and long crossing distances. The countermeasure may offer pedestrians more protection from left-turning vehicles rather than right-turning vehicles if right turn on red is permitted.
Leading pedestrian intervals were tested in both San Francisco and Miami. The length of the head start tested in San Francisco was 4 seconds, and the length of the head start tested in Miami was 3 seconds.
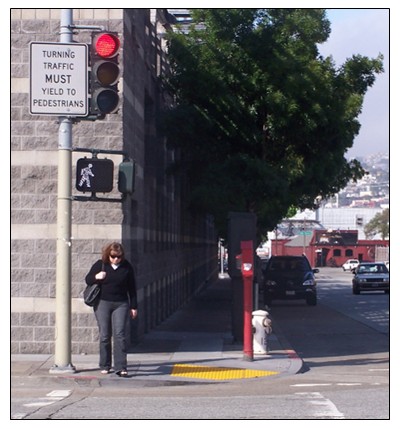
Figure 34. Leading Pedestrian Interval
The leading pedestrian interval study sites are shown in Table 58. San Francisco deployed and tested the leading pedestrian interval at four intersections with the leading interval given to pedestrians crossing a four-lane secondary street at all four intersections. Vehicles observed for the study were turning from the primary street onto the secondary street. In San Francisco, the primary streets that were studied were one-way with the exception of Mission. The Mission & 6th intersection was an intersection between two, two-way streets.
In Miami, the leading pedestrian interval was deployed at one 4-legged intersection, Alton & Lincoln, and one 3-legged intersection, Collins & 16th, in the South Beach area. At Collins & 16th, drivers frequently do not stop on red before turning right. Along Alton Road, turning drivers often do not yield to pedestrians in the crosswalk that have begun crossing at the WALK.
| Study Sites | Site Descriptions |
|---|---|
| Miami: Alton & Lincoln |
4-legged intersection located in South Beach. Alton Rd. is 4-lane, with 35 mph speed limit and has approximately twice the traffic volumes than Collins Ave. Predominantly residential. |
| Miami: Collins & 16th |
3-legged intersection located in the South Beach entertainment district. Collins is 4-lane, with 35 mph speed limit. |
| San Francisco: Howard & 6th, Howard & 8th, Harrison
& 10th, and Mission & 6th |
All sites are located in commercial land use areas at 4-legged signalized intersections on streets with speed limits ranging from 25 – 30 mph on the primary street. |
A variety of MOEs were used by the Miami and San Francisco study teams to assess the impact of the leading pedestrian interval on pedestrian and driver behavior. The primary purpose of the leading pedestrian interval is to increase driver yielding, a critical MOE used by both study teams. The leading pedestrian intervals are expected to have other benefits as well. By allowing pedestrians the opportunity to enter the crosswalk before vehicles begin turning, the leading pedestrian interval is expected to reduce vehicle-pedestrian conflicts, allow pedestrians to clear the crosswalk on time, improve pedestrian compliance with signals, increase the number of drivers that yield to pedestrians, and reduce pedestrian delay. These MOEs are shown in Table 59.
| Measure of Effectiveness | Miami | SF |
|---|---|---|
| % of drivers yielding to pedestrians | X | X |
| % of pedestrians in crosswalk after all-red phase | X | X |
| % of cycles call button pressed | X | |
| % of cycles pedestrian-vehicle conflicts | X | |
| % of pedestrians crossing during first 4 seconds of WALK | X | |
| Pedestrian delay | X | |
| Pedestrian crossing time | X |
The San Francisco and Miami study teams both assessed left-turn driver yielding to pedestrians in the crosswalk although the measure used was slightly different between the two teams. In San Francisco, left turn yielding was measured by examining the percent of vehicles that turned left in front of pedestrians (i.e., non-yielding). In Miami, a driver was scored as yielding on a left-turn if he or she stopped or slowed and allowed the pedestrian to cross before completing his turn.
The results as shown in Table 60 indicate that there was a small, but significant decrease in drivers turning left in front of pedestrians in two of the three intersections in San Francisco. The lack of significant reduction in vehicles making left turns in front of pedestrians at Howard and 8th may be due to a couple of factors. Left-turners at this intersection share a lane with through vehicles which will cause left-turners some delay in making a left turn after the light has turned green if they are not first in line at a red light. This delay may already give pedestrians an advantage in crossing even without the leading pedestrian interval. Additionally, the Howard and 8th intersection experiences a low volume of vehicles allowing traffic queues to clear the intersection before the next phase. This may allow some pedestrians to start to cross before their walk signal.
At both intersections in Miami, significant increases in drivers yielding on left-turns were measured.
| Site | % Vehicles Turning Left in Front of Pedestrians (those not yielding) | % Change | p-value | |
|---|---|---|---|---|
| Before | After | |||
| San Francisco: Howard & 6th | 5.6 (n = 1083) |
1.5 (n = 1310) |
-4.1 | <0.01 |
| San Francisco: Howard & 8th | 16.8 (n = 416) |
15.4 (n = 488) |
-1.4 | 0.59 |
| San Francisco: Howard & 10th | 4.1 (n = 1716) |
2.5 (n = 836) |
-1.6 | 0.05 |
| Site | % of Left-turning Drivers Yielding During WALK | % Change | p-value | |
|---|---|---|---|---|
| Before | After | |||
| Miami: Alton & Lincoln | 40 (n = 46) |
58 (n = 194) |
+18 | 0.01 |
| Miami: Collins & 16th | 22 (n = 59) |
31 (n = 18) |
+9 | 0.05 |
Both the San Francisco and Miami study teams assessed right-turn driver yielding to pedestrians in the crosswalk but in slightly different ways as was done with left turns. These results are shown in Table 61. The San Francisco team measured the percent of vehicles turning right in front of pedestrians at two intersections: Harrison & 10th and Mission & 6th. At Harrison & 10th, drivers on Harrison Street, a one-way street, turned right onto 10th Street, another one-way street. At Mission & 6th, drivers were observed turning right from Mission onto 6th Street. The Miami team measured the percent of right-turning drivers yielding to pedestrians in the crosswalk during the WALK phase at one 4-legged intersection of two-way roads. There was a significant increase in right-turn driver yielding at only one out of three sites observed for that measure.
The Miami and San Francisco teams both measured pedestrian clearance but the San Francisco team recorded pedestrians who were in the crosswalk after 3.5 seconds of all red whereas the Miami team recorded pedestrians who were in the crosswalk at the end of the all red phase. There were no statistically significant differences found between the before and after conditions. A mix of small increases and decreases in pedestrian clearance was measured for all of the intersections scored.
| Site | % Vehicles Turning Right in Front of Pedestrians | % Change | p-value | |
|---|---|---|---|---|
| Before | After | |||
| San Francisco: Harrison & 10th | 3.6 (n = 665) |
6.2 (n = 321) |
+2.6* | 0.07 |
| San Francisco: Mission & 6th | 9.6 (n = 691) |
5.2 (n = 290) |
+2.6* | 0.02 |
| * Counterintuitive result | ||||
| Site | % of Right-turning Drivers Yielding During WALK | % Change | p-value | |
|---|---|---|---|---|
| Before | After | |||
| Miami: Alton & Lincoln | 15 (n = 15) |
15 (n = 45) |
0 | NA |
The Miami study team measured the percent of cycles when a pedestrian was present that the call button was pressed, and the results are shown in Table 62. Significant increases in pedestrian push button pressing were observed within both study corridors, likely because pedestrians had learned that pressing the button would lead to the exclusive pedestrian phase.
| Site | % of Cycles Call Button Pressed | % Change | p-value | |
|---|---|---|---|---|
| Before | After | |||
| Miami: Alton & Lincoln | 69 (n = 169) |
76 (n = 431) |
+7 | 0.05 |
| Miami: Collins & 16th | 36 (n = 781) |
51 (n = 185) |
+15 | 0.01 |
The Miami study team also examined the impact of the leading pedestrian interval on the percent of pedestrians crossing during the first 4 seconds of the WALK phase. The results are shown in Table 63. The results show a large, significant increase in the percent of pedestrians crossing in the beginning of the WALK phase (31 percent at Alton and Lincoln and 21 percent at Collins and 6th). The reason for the increase of pedestrians in the crosswalk at the start of the walk cycle is likely because the leading pedestrian interval eliminates left turning vehicles for the first few seconds of the walk phase reducing the number of pedestrians giving up the right of way to turning vehicles.
| Site | % of Pedestrians Crossing during first 4 sec of WALK | % Change | p-value | |
|---|---|---|---|---|
| Before | After | |||
| Miami: Alton & Lincoln | 45.3 (n = 858) |
76.5 (n = 1121) |
+31.2 | 0.01 |
| Miami: Collins & 16th | 38 (n = 300) |
59 (n = 109) |
+21 | 0.01 |
The incidence of pedestrian and vehicle conflicts in Miami was very rare and there was no significant change in conflicts at the sites studied in San Francisco. There were no significant impacts on pedestrian delay or crossing time in San Francisco.
The data from intersections in both San Francisco and Miami indicate that this is an effective countermeasure for increasing left-turn driver yielding to pedestrians in the crosswalk, although the magnitude of left-turn yielding was smaller in San Francisco than in Miami. This may be because yielding violations appear to be smaller in San Francisco and therefore there was less opportunity for improvement. This effect does not appear to carry over for right-turn driver yielding. The results also show that the leading pedestrian interval increases pedestrian call button pushes and the number of pedestrians that start to cross at the beginning of the cycle.
As noted by the Miami team, it is possible that the lack of increase in right-turn yielding may be due to the high frequency of right-turners who do not stop at a red light before turning in Miami and so the lengthened red time may not impact their yielding.
This treatment involved reconfiguring the signal heads to eliminate permissive left turns. Two new signals were installed to show the additional phases, the signal timing needed to be adjusted, and a static sign indicating LEFT ON GREEN ARROW ONLY (R5-10 2003 MUTCD) (Figure 35) was installed. The approximate cost of deploying this countermeasure in Miami was $4000.
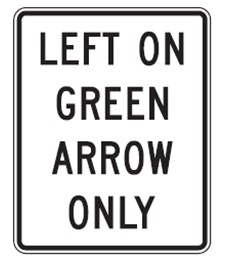
Figure 35. Static Sign Supporting the Prohibition of Permissive Left Turns
One intersection in Miami, 41st and Pine Tree, received the treatment of prohibition of permissive left turns (Table 64). The prohibition was put into effect on the east and west directions of the intersection. The intersection is in a commercial area just west of the oceanfront. This location was chosen because of a history of motorist-pedestrian crashes wherein the motorist turned left into a crossing pedestrian. The primary street, 41st Street, is a two way street with two lanes in each direction and an ADT of 39,000 vehicles per day. Observations of this intersection were restricted to one leg, the westbound motorists turning left/south across the south crosswalk.
| Study Sites | Site Descriptions |
|---|---|
| Miami: 41st & Pine Tree |
Four-legged, signalized intersection in a commercial land use area close to the oceanfront. Primary street, 41st, has an ADT of 39,000 and has four lanes, with parking lanes on both sides of the street. History of motorist-pedestrian crashes wherein the motorist turned left into a crossing pedestrian. |
The Miami study team collected data on the three countermeasures listed below to assess the effectiveness of prohibiting permissive left turns on pedestrian safety. Since the purpose of eliminating the permissive left turn is to reduce pedestrian and vehicle conflicts that occur when vehicles make left turns as pedestrians are crossing, the MOE considered most critical is the percent of cycles in which there are pedestrian-vehicle conflicts.
Pedestrian signal compliance improved slightly following the elimination of the permissive left-turn phase (Table 65). However, the prevalence of left-turning motorists turning during the prohibited phase is a concern. These motorists, 15 percent of all left turners, turned after the left turn indication changed to red. The motorists were presumably more likely to violate the signal because they would have to wait until the next cycle as a result of the elimination of the permissive left turn phase. The researchers suggest that a lagging protected left turn phase may be more effective because it would allow many queued pedestrians to clear the intersection prior to the beginning of the protected left turn movement. One other important consideration regarding this countermeasure, motorist delay, was not measured.
The incidence of motorist-pedestrian conflicts was reduced at a statistically significant level following the elimination of the permissive left-turn phase (7 percent to 2 percent, p=0.014) (Table 67).
| Site | % Pedestrians Crossing during WALK | % Change | p-value | |
|---|---|---|---|---|
| Before | After | |||
| 41st & Pine Tree | 84 (n = 2166) |
86.7 (n = 789) |
+2.7 | <0.001 |
| Site | % of Pedestrians Crossing during Left-turn Phase | % Change | p-value | |
|---|---|---|---|---|
| Before | After | |||
| 41st & Pine Tree | 66 (n = 4644) |
85 (n = 1625) |
+19 | <0.001 |
| Site | % Pedestrian-vehicle Conflicts | % Change | p-value | |
|---|---|---|---|---|
| Before | After | |||
| 41st & Pine Tree | 7.2 (n = 2166) |
2 (n = 789) |
-5.2 | 0.014 |
The data indicate that prohibiting permissive left-turns may be an effective way to improve pedestrian safety at intersections by reducing conflicts between pedestrians and vehicles, however, the researchers also found that there was a substantial portion of left-turners that violated the red signal. While this countermeasure has potential for increasing pedestrian safety, the signal configuration should be taken into consideration in order to mitigate left-turners violating the signal.
Two types of physical separation were installed and tested for their impact on pedestrian safety. These countermeasures included:
The findings for the site-specific evaluations for these physical separation countermeasures are presented below.
Median refuge islands provide a safe, raised area in the center portion of the roadway for pedestrians when crossing wide, multilane streets. They can be provided at mid-block crossings or at intersections (Figure 36). The islands allow pedestrians to cross the first half of the roadway and then to wait before crossing the second half of the roadway, rather than forcing them to find sufficient gaps in both directions of traffic to make their crossing. The islands also act as a traffic calming device by reducing the speed of vehicles at mid-block locations and by forcing left-turning motorists to reduce their speeds to make shorter radius turns at intersections.
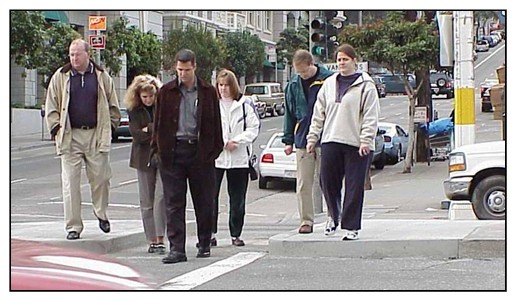
Figure 36. Median Refuge Island at a San Francisco Intersection
In San Francisco, median refuge islands were installed at two signalized intersections along Geary (Figure 36). At Stanyan, the refuge island was installed on the west crosswalk on Geary. At 6th, the refuge island was installed on the east and west crosswalks on Geary. In Las Vegas, a median refuge island was installed at a mid-block crosswalk along Harmon between Paradise Road and Tropicana Boulevard (Figure 37). The refuge island was installed at the same time as a high-visibility crosswalk. The study sites are described in Table 68.
| Study Sites | Site Descriptions |
|---|---|
| San Francisco: Geary & Stanyan Geary & 6th |
Geary & Stanyan: 3-leg intersection. 7 lanes on Geary at intersection. Geary & 6th: 4-leg intersection. 6 lanes on Geary at intersection. Both sites have standard crosswalks, 2-way traffic, signalized intersections, street parking, mixed land use, and 25 mph speed limits. |
| Las Vegas: Harmon: Paradise Rd. to Tropicana Blvd. | Mid-block crosswalk. Installed with a high-visibility crosswalk. |
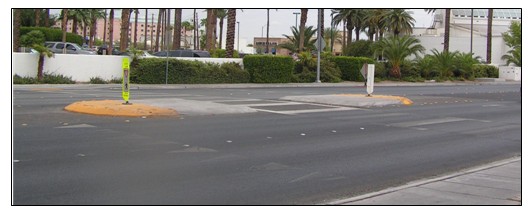
Figure 37. Median Refuge Island at Mid-block Location in Las Vegas
To assess the effectiveness of the refuge islands, the teams collected data associated with a number of MOEs (Table 69). MOEs considered critical to the assessment of the refuge islands included pedestrians trapped in the roadway, pedestrians that diverted to the crosswalk, and pedestrian-vehicle conflicts. Other MOEs considered included driver yielding and pedestrian delay.
| Measure of Effectiveness | LV | SF |
|---|---|---|
| % of pedestrians trapped in the roadway | X | X |
| % of of diverted pedestrians | X | |
| % pedestrian-vehicle conflicts | X | |
| % of drivers yielding to pedestrians | X | X |
| Average pedestrian delay | X | X |
There were no measurable changes in the percentage of pedestrians trapped in the roadway, the percentage of pedestrians that were diverted to the crosswalk, or the percentage of pedestrian-vehicle conflicts at any of the sites where data for these MOEs were collected.
With regards to driver yielding, the San Francisco team found no significant impacts on the percent of turning drivers that yielded to pedestrians at the intersections where the refuge islands were installed (Table 70). This result could be due to the already high percentage of turning drivers that yielded to pedestrians at these sites prior to installation of the refuge islands or the fact that the drivers did not feel inclined to yield to pedestrians who were protected by the raised median. The Las Vegas team did record a significant 24 percent increase in driver yielding at the mid-block crosswalk where the refuge island was installed. Driver yielding increased from 22 percent before the refuge island to 46 percent after installation of the refuge island.
| Site | % of Drivers Yielding to Pedestrians | % Change | p-value | |
|---|---|---|---|---|
| Before | After | |||
| San Francisco: Geary & Stanyan | 80.4 (n = 158) |
86.6 (n = 164) |
+6.2 | 0.18 |
| San Francisco: Geary & 6th | 96.1 (n = 186) |
89.7 (n = 262) |
-6.4 | 0.15 |
| Las Vegas: Harmon: Paradise Rd. to Tropicana Blvd. | 22 (n = 77) |
46 (n = 284) |
+24 | <0.001 |
Both teams measured pedestrian delay in the crosswalks before and after installation of the median refuge islands, and the results are shown in Table 71. While there was no change in average pedestrian delay at Geary & Stanyan, there was a significant increase in average pedestrian delay at Geary & 6th of 4.2 seconds. This increase in pedestrian delay corresponds to a decrease, albeit not significant, in driver yielding at this site. At the mid-block crosswalk in Las Vegas, there was a 12.3 second decrease in pedestrian delay corresponding to the increase in driver yielding at this site.
| Site | Average Pedestrian Delay (sec) | % Change | p-value | |
|---|---|---|---|---|
| Before | After | |||
| San Francisco: Geary & Stanyan | 19.8 (n = 107) |
19.1 (n = 104) |
-0.7 | 0.80 |
| San Francisco: Geary & 6th | 14.3 (n = 350) |
18.5 (n = 595) |
+4.2* | <0.01 |
| Las Vegas: Harmon: Paradise Rd. to Tropicana Blvd. | 19.3 (n = 1951) |
6.98 (n = 388) |
-12.3 | <0.001 |
Based on the results, it appears that the installation of a median refuge island at a mid-block location was effective in increasing driver yielding to pedestrians and reducing pedestrian delay, while the median refuge islands at the signalized intersections in San Francisco appear to be less effective at altering driver and pedestrian behaviors.
The Las Vegas team deployed a Danish offset at two locations. A Danish offset is an offset at the middle of a multilane crossing that provides refuge for pedestrians in terms of physical separation from traffic and ensures they are facing the traffic before crossing the second half of the roadway. The offset is a type of channelization that encourages pedestrians to turn and walk parallel to the traffic they are crossing. At the Maryland Parkway and Dumont Street site (Figure 38), the channelized offset was created using waist-high bollards and raised medians. At the Lake Mead Boulevard site, the offset was developed with median cutouts (Figure 39). At the Maryland and Dumont site, a sign with the words LOOK BEFORE CROSSING and an arrow pointing the direction of oncoming traffic was also installed. At both sites, the Danish offset was combined with other pedestrian safety countermeasures including high-visibility crosswalks, advance yield markings, and YIELD HERE TO PEDESTRIANS (R1-5a 2003 MUTCD) signs, as shown in Figure 40 and Figure 41.
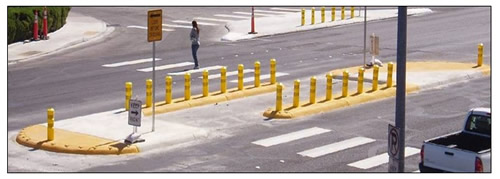
Figure 38. Danish Offset at Maryland Parkway and Dumont Street
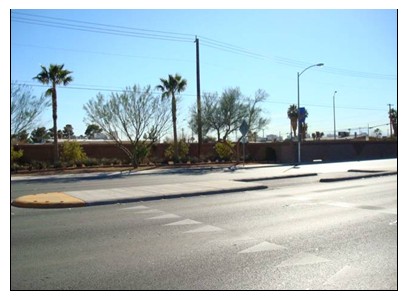
Figure 39. Lake Mead Boulevard: Belmont Street to McCarran Street
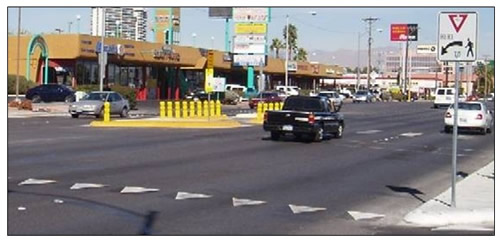
Figure 40. Advance Yield Markings and YIELD HERE TO PEDESTRIANS Sign Before Danish Offset at Maryland Parkway and Dumont Street
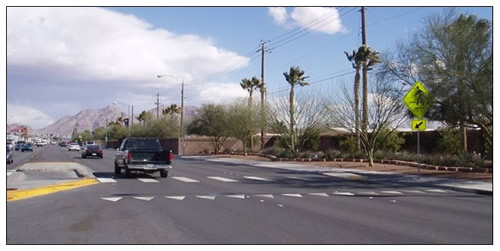
Figure 41. Advanced Yield Markings installed at Lake Mead Boulevard: Belmont Street to McCarran Street
In Las Vegas, the Danish offset and supporting countermeasures were deployed at two sites, one under the jurisdiction of Clark County and the other in the City of North Las Vegas (Table 72). The intersection of Maryland Parkway and Dumont Street in Clark County is primarily a commercial area with shopping complexes and a shopping mall. Maryland Parkway is a major arterial with a speed limit of 30 mph and an ADT of 43,000. Dumont Street is a minor arterial with a posted speed limit of 25 mph. In addition to these countermeasures, the east approach at the Maryland and Dumont intersection was redesigned to permit only right turns.
The second location that received the Danish offset was in the City of North Las Vegas on Lake Mead Boulevard between Belmont Street and McCarran Street. Land use in that area is primarily residential. Lake Mead Boulevard is a major arterial with a speed limit of 45 mph and has an annual average daily traffic (AADT) level of 44,000 vehicles per day. Changes to the site also included relocating bus stops and crosswalks.
| Study Sites | Site Descriptions |
|---|---|
| Las Vegas: Maryland Pkwy & Dumont Street |
A four-legged intersection in a commercial shopping area. The primary street, Maryland Parkway, is a major arterial with a speed limit of 30 mph and an ADT of 43,000. |
| Las Vegas: Lake Mead Boulevard: Belmont Street to McCarran Street | A mid-block location on Lake Mead Boulevard, a major arterial in a primarily residential area. Lake Mead has a speed limit of 45 mph and an AADT of 44,000. |
The Las Vegas study team used a variety of MOEs to assess the impacts of the Danish offset and supporting countermeasures. The percent of diverted pedestrians, percent of pedestrians trapped, and percent of drivers yielding to pedestrians were considered to be critical in determining the effectiveness of these countermeasures in increasing pedestrian safety. Other important MOEs considered by the Las Vegas team are also listed below. It was anticipated that these countermeasures would increase the percent of pedestrians that crossed within the designated crosswalk, increase the percent of pedestrians that looked before crossing, decrease the incidence of pedestrian trapped in the roadway, and increase driver yielding.
At the Maryland and Dumont site, the Las Vegas study team measured significant increases in pedestrians that diverted their paths to use the new countermeasures (Table 73). Because there was no marked crosswalk at the Lake Mead location, there was no baseline data for comparison and so this site was left out of this table.
| Site | % of Diverted Pedestrians | % Change | p-value | |
|---|---|---|---|---|
| Before | After | |||
| Las Vegas Maryland Pkwy & Dumont | 0 (n = 631) |
11 (n = 198) |
+11 | <0.001 |
There was already a very high percentage of pedestrians looking before beginning to cross the street and before crossing the second half of the street and so there was little room to improve, as shown in Table 74. The changes measured by the Las Vegas team were small and mixed.
| Site | % of Pedestrians That Look before Beginning to Cross | % Change | p-value | |
|---|---|---|---|---|
| Before | After | |||
| Las Vegas: Maryland Pkwy & Dumont | 100 (n = 631) |
93 (n = 198) |
-7 | >0.05 |
| Las Vegas: Lake Mead: Belmont to McCarran | 96 (n = 61) |
100 (n = 123) |
+4 | >0.05 |
| Site | % of Pedestrians That Look before Crossing Second Half of Street | % Change | p-value | |
|---|---|---|---|---|
| Before | After | |||
| Las Vegas: Maryland Pkwy & Dumont | 100 (n = 631) |
91 (n = 198) |
-9 | >0.05 |
| Las Vegas: Lake Mead: Belmont to McCarran | 92 (n = 61) |
100 (n = 123) |
+8 | <0.05 |
At both locations the percent of pedestrians trapped in the roadway fell significantly, particularly at the Lake Mead site with a 57 percent decrease (Table 75). The large percentage of pedestrians trapped at the Lake Mead site in the before condition is likely caused by the absence of a crosswalk.
| Site | % of Pedestrians Trapped in the Roadway | % Change | p-value | |
|---|---|---|---|---|
| Before | After | |||
| Las Vegas: Maryland Pkwy & Dumont | 12 (n = 631) |
4 (n = 198) |
-8 | <0.001 |
| Las Vegas: Lake Mead: Belmont to McCarran | 62 (n = 61) |
5 (n = 123) |
-57 | <0.001 |
The Las Vegas study team measured large, significant increases in driver yielding at both sites (Table 76). There was a 37 percent increase in driver yielding at the Lake Mead site, but the resulting prevalence in yielding was still relatively low at just 40 percent.
The increase in yielding was larger at the Maryland Parkway & Dumont location and resulted in a higher frequency of driver yielding in the after condition at 76 percent.
| Site | % of Drivers Yielding to Pedestrians | % Change | p-value | |
|---|---|---|---|---|
| Before | After | |||
| Las Vegas: Maryland Pkwy & Dumont | 32 (n = 432) |
76 (n = 246) |
+44 | <0.001 |
| Las Vegas: Lake Mead: Belmont to McCarran | 3 (n = 296) |
40 (n = 117) |
+37 | <0.001 |
The Las Vegas team also measured the change in yielding distances at the Lake Mead location. The team examined the percent of drivers that yielded less than 10 feet away from the crossing pedestrian, between 10 and 20 feet from the pedestrian, and more than 20 feet away. The before and after distributions of driver yielding distances are shown in Figure 42. There appears to have been a shift from yielding in the mid-range distance category to either the short range yielding or long range yielding. Because the sample size is so small (n = 8) in the baseline condition, it is difficult to make any conclusions based on the data. Yielding in the baseline condition was not measured for the Maryland and Dumont site so results are not available for that site for this MOE.
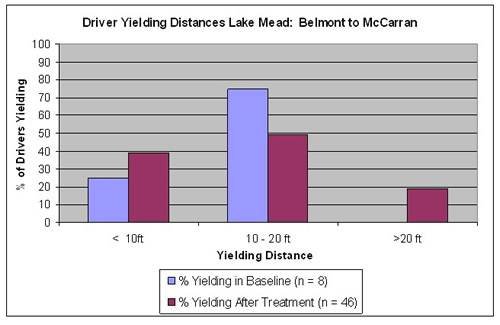
Figure 42. Driver Yielding Distances on Lake Mead: Belmont to McCarran
Average pedestrian delay at Maryland and Dumont increased, while delay measured at Lake Mead decreased by 11.9 percent, a statistically significant difference (Table 77).
| Site | Average Pedestrian Delay (sec) | Change (sec) | p-value | |
|---|---|---|---|---|
| Before | After | |||
| Las Vegas: Maryland Pkwy & Dumont | 3.82 (n = 631) |
7.46 (n = 198) |
+3.64 | >0.05 |
| Las Vegas: Lake Mead: Belmont to McCarran | 21.4 (n = 61) |
9.5 (n = 84) |
-11.9 | 0.001 |
There was not a statistically significant change in average vehicle delay at the Lake Mead location. A change in delay was not assessed at the Maryland and Dumont location.
In summary, the Danish offset and supporting countermeasures appear to have led to an increase in safe pedestrian and driver behaviors. The Las Vegas team measured significant increases in driver yielding and diverted pedestrians as well as significant decreases in trapped pedestrians. Pedestrian looking behavior was high in the baseline and so the lack of increase there may be due to the ceiling effect. Yielding distance measurements were inconclusive and this was likely caused by the very low number of measurements made in the before condition. Pedestrian delay was significantly reduced at the Lake Mead location where a designated crossing area had not previously existed while it rose slightly at Maryland and Dumont. Vehicle delay at Lake Mead rose likely due to an increase in yielding and more cautious driving allowing pedestrians to have the right of way. The yielding only rose to 40 percent at Lake Mead whereas it reached 76 percent at Maryland and Dumont. This may be due to the difference in speed limits along the two roads. Lake Mead has a 45 mph speed limit while Maryland and Dumont is at 30 mph. With such a high speed limit, drivers on Lake Mead are possibly less likely to slow down or stop for pedestrians. In general, though, the suite of countermeasures appears to have made pedestrian crossings safer.
Only one type of lighting, dynamic lighting, was installed to test its impact on pedestrian safety; however, the application of the dynamic lighting was different in each deployment location. The findings from the site-specific evaluations are discussed below.
Dynamic lighting is the increased illumination of the crosswalk while a pedestrian is present. The implementation of this countermeasure was slightly different in the two locations where it was installed.
In Miami, dynamic lighting consisted of an LED white lighting pad that illuminated the departure portion of the curb face and the first 4 feet of the crosswalk. This dynamic pad lighting consisted of four 2.5 by 1.25 inch housings each containing 3 LEDs. The lighting was deployed in Miami at a location where rectangular LED rapid flashing beacons had been previously installed. The Miami study team was interested in finding out if additional dynamic lighting increased pedestrian safety. When a pedestrian pressed the call button to activate the beacon at night, the rapid flashing beacon and LED white lighting was activated.
In Las Vegas, increased lighting of the crosswalk came from one or more lights attached to the top of poles on the side of the road, as shown in Figure 43. Automatic pedestrian detection was installed along with the lighting to detect pedestrians crossing and trigger an increase in the intensity of the lighting at the crosswalk. The high intensity lighting was in effect only when pedestrians were present in the crosswalk.
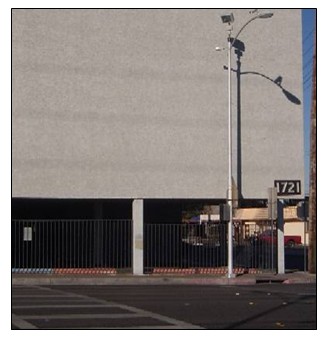
Figure 43. Dynamic Lighting on Pole in Las Vegas
The deployment locations are presented in Table 78. The Las Vegas team deployed the dynamic lighting countermeasure along Charleston Boulevard at a mid-block location between Spencer Street and 17th Street. Land use in that area is mixed and includes office complexes, several small commercial activity units, restaurants, and apartments. The posted speed limit is 35 mph and the ADT is 37,500. A review of pedestrian safety issues in the area shows a high proportion of nighttime crashes involving pedestrians. The dynamic lighting was installed in conjunction with automatic pedestrian detection in the last phase of a two-phase effort to install pedestrian safety countermeasures at the mid-block location. During the first phase a high-visibility crosswalk was installed.
Dynamic lighting in Miami was installed at a crosswalk that traversed four lanes on South Bayshore Drive at Darwin. The crosswalk has a median refuge island for pedestrians between the two directions of travel. The average daily traffic on South Bayshore Drive was 38,996 and the speed limit was 35 mph.
| Study Sites | Site Descriptions |
|---|---|
| Miami: South Bayshore Drive & Darwin |
Crosswalk over a 4-lane road with pedestrian refuge island cut in the median. At intersection of South Bayshore and Darwin. The ADT for South Bayshore was 38,996 with speed limit of 35 mph. Deployed at location containing rapid flash beacon. |
| Las Vegas: Charleston: Spencer to 17th | Crosswalk over approximately a 4-lane road in a mixed commercial/residential area. The speed limit on Charleston was 35 mph and the ADT was 37,500. Deployed at a location that had a high-visibility crosswalk. |
The Las Vegas and Miami study teams assessed the impact of dynamic lighting on pedestrian safety and mobility using a variety of measures of effectiveness. Two MOEs considered critical to evaluating the effectiveness of dynamic lighting were the percent of drivers yielding to pedestrians and the frequency of pedestrian-vehicle conflicts. Dynamic lighting was expected to increase driver yielding, decrease pedestrian-vehicle conflicts, reduce pedestrian delay, and not significantly impact driver delay. Table 79 contains a list of MOEs used by the Las Vegas and Miami teams.
| Measure of Effectiveness | Miami | LV |
|---|---|---|
| % of drivers yielding to pedestrians | X | X |
| % diverted pedestrians | X | |
| Distance drivers yielded to pedestrians | X | |
| Pedestrian-vehicle conflicts | X | X |
| % of pedestrians trapped in the roadway | X | |
| Average pedestrian delay | X | |
| Average vehicle delay | X |
There was a low instance of pedestrian-vehicle conflicts in Miami during both the before and after conditions. There was one recorded conflict for each condition. The low prevalence of conflicts may be due to the presence of the RRFD at that site, which was installed prior to the dynamic lighting.
The Miami and Las Vegas study teams both measured the percent of drivers yielding to pedestrians with and without dynamic lighting, and the results are shown in Table 80. In Las Vegas, there was a 29 percent increase in yielding after dynamic lighting was installed, although the prevalence of yielding (35 percent) in the after condition was still small. In Miami, the introduction of dynamic lighting to a crosswalk with a RRFB did not have much impact on driver yielding.
| Site | % of Drivers Yielding to Pedestrians | % Change | p-value | |
|---|---|---|---|---|
| Before | After | |||
| Miami: South Bayshore Drive & Darwin | 53.8 (n = 238) |
55.1 (n = 263) |
+1.3 | 0.73 |
| Las Vegas: Charleston: Spencer to 17th | 6 (n = 50) |
35 (n = 116) |
+29 | < 0.05 |
The Las Vegas team measured the percentage of pedestrians who diverted to use the crosswalk, and the results are shown in Table 81. The percent of pedestrians that walked out of their way to use the crosswalk significantly increased after the installation of dynamic lighting although only 17 percent of pedestrians walked out of their way to use the crosswalk. This may be because a pedestrian would not realize that intense lighting would come on until the pedestrian was close enough to trigger the lighting.
| Site | % of Diverted Pedestrians | % Change | p-value | |
|---|---|---|---|---|
| Before | After | |||
| Las Vegas: Charleston: Spencer to 17th | 0 (n = 44) |
17 (n = 84) |
+17 | <0.001 |
The Las Vegas study team measured a 16 percent reduction in the portion of pedestrians trapped in the middle of the roadway or between lanes while attempting to cross (Table 82).
| Site | % Pedestrians Trapped in Roadway | % Change | p-value | |
|---|---|---|---|---|
| Before | After | |||
| Las Vegas: Charleston: Spencer to 17th | 30 (n = 44) |
14 (n = 84) |
-16 | <0.05 |
There were no significant impacts on average pedestrian delay or average vehicle delay measured in Las Vegas.
The findings from the Las Vegas team that tested the impacts of dynamic lighting at a high-visibility crosswalk location suggest that dynamic lighting used with automatic pedestrian detection resulted in an increase in safe driver and pedestrian behaviors. Driver yielding and pedestrian diversion increased significantly while the percent of trapped pedestrians significantly decreased. While driver yielding increased, its prevalence was still low at 35 percent. In Miami, the addition of dynamic lighting to a crosswalk that had a RRFB did not appear to further improve driver yielding or pedestrian-vehicle conflicts. The Miami researchers suggested that this may have occurred because the dynamic lighting is not very noticeable in the presence of highly intense flashing beacons.
| < Previous | Table of Content | Next > |

