Appendix D. Regression to the Mean
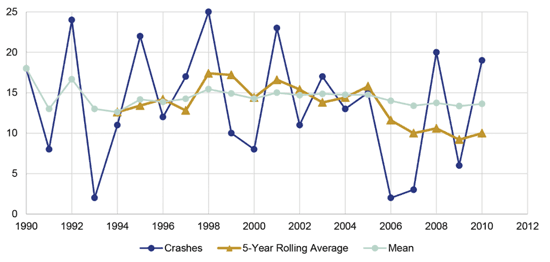
From year to year, the number of crashes at a site will randomly fluctuate up and down. Overtime, however, this random fluctuation will balance out to what can be considered the long-term expected average number of crashes at the site. Figure D.1 demonstrates regression to the mean and the effects of average crash frequency across multiple years. The ‘Crashes’ line shows hypothetical 1990 to 2010 annual crash frequency at a site. The crash frequency varies up and down from year to year. The ‘Mean’ line represents the long-term average crash frequency at the same hypothetical site. As shown, the five-year rolling average stabilizes at approximately 14 crashes per year. For example, the first five-year average is from 1990 to 1994 and is plotted in 1994, the second is from 1991 to 1995 and plotted on 1995. The five-year rolling average more closely approximates the long-term average then the annual crash frequency alone.
Figure D.1 Chart. Example of Regression to the Mean
Source: Federal Highway Administration. Improving Safety on Rural Local and Tribal Roads: Safety Toolkit. August 2014.
If regression to the mean is not accounted for, a site might be selected for study because the annual number of crashes that occurred was higher than “usual” due to a random fluctuation in the data. Conversely, a site that should be selected for study might be overlooked because an unusually low number of annual crashes occurred there.
To reduce the influence of regression to the mean, the agency should calculate the average of the most recent three to five years of crash data to determine the average crash frequencies. This minimizes year-to-year fluctuations in data and is appropriate if site conditions (e.g., traffic volume, land use, driveway access, and roadway configuration) have not changed. However, if site conditions have changed significantly during the analysis period, it may be more appropriate to monitor the site and evaluate safety after conditions have stabilized.


