U.S. Department of Transportation
Federal Highway Administration
1200 New Jersey Avenue, SE
Washington, DC 20590
202-366-4000
| < Previous | Table of Contents | Next > |
MAP-21 increased attention to performance measures and target setting. The Safety PM NPRM provided an indication of potential Federal guidance on target setting implementation and presented the option for urbanized and nonurbanized area target setting. As with any management framework, understanding the semantics of the elements of the framework is important to effectively implement the approach. This section presents an approach to evidence-based target setting for FHWA as the state of the practice is moving in this direction. For example, the NHTSA Interim Final Rule states:14
“State HSPs must now provide for performance measures and targets that are evidence-based…. The State process for setting targets in the HSP must be based on an analysis of data trends and a resource allocation assessment.”
Therefore, it is important to define the meaning of “evidence-based” target setting. There are two basic ways to think about target setting, one of which is evidence based:
In the context of MAP-21, Highway Safety Improvement Program (HSIP15) annual reports will have to include targets and explain how fatalities and serious injuries will be reduced. This is evidence-based target setting, examining how a specific set of actions contributes to improved performance over the time horizon of the plan. In addition, when a performance measure, such as the number of rural fatalities, is used by multiple agencies (e.g., State DOT and SHSO) the targets will need to be aligned.
While these two approaches are distinct, they are not necessarily in conflict. A zero-based vision or target is useful for galvanizing support around a planning effort and for ensuring successful strategies are considered and/or implemented while keeping the focus on a clear goal.
Evidence-based targets, in contrast, promote accountability and encourage agencies to consider the tradeoffs of their investments across different program areas. Being able to demonstrate the benefits of different levels of investment in safety (and other programs) helps decision-makers better understand the implications of investment in various program areas. Target setting with this approach is derived from considering the tradeoffs among investment levels.
The basic concept for evidence-based target setting is to link investments and policy decisions to performance. Typically this is done by reviewing the achievements resulting from previous investments and applying that knowledge to estimate the expected improvement in safety outcomes likely to be achieved given varying levels of investment in the future.
As agencies begin setting evidence-based targets, the approaches outlined below should be considered. The steps for using countermeasure data in target setting are relatively simple, although implementation may be complex:
Use trend analysis;
Consider exogenous factors, i.e., population, distribution between urbanized and nonurbanized areas, anticipated policies; and
Forecast fatality reductions based on planned implementation of proven countermeasures;
Identify potential for application of countermeasures (through SHSP, HSP, HSIP, or other planning processes);
Identify data on expected countermeasure impact;
Develop constrained list of countermeasures based on expected effectiveness and available resources (i.e., expected lives saved per dollar of investment); and
Estimate system, region, or State benefits based on the aggregation of expected countermeasures, discounting for potential overlap among emphasis areas.
Once the trend line forecast is developed, consideration of exogenous factors and forecasted fatality reductions will help quantitatively estimate how aggressive the target can be. Agencies may wish to include countermeasures not previously implemented. For those projects or programs without known effectiveness data, evaluation should be included as a component of the project. Figure 5.1 shows how these steps can be used to develop an evidence-based fatality target and what questions are being answered at each phase.
Figure 5.1 Target Setting Steps
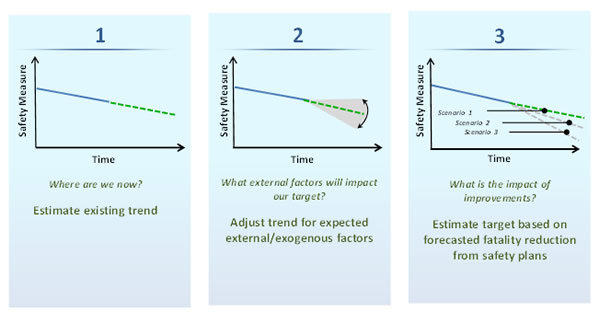
Source: Cambridge Systematics, Inc.
The appropriate combination of the steps described above will depend on the factors and issues in each State or region. While these steps are quite general, they point to a direction agencies can pursue, and some illustrative examples are provided in this report. In the short term, agencies will have to consider multiple pieces of information to set a meaningful, evidence-based target. Safety analysis tools currently available are described below, as well as an overview of each of the analytical approaches. Details on data and methodologies are provided in Sections 6 and 7.
Examining fatality trends is a simple approach. It is generally the first step States take in understanding safety performance and potential future safety gains. Given the potential variation in crashes and severity each year, it is common for States to look at a rolling average of multiple years, as well as single-year results. AASHTO’s Standing Committee on Performance Management (SCOPM) recommends in its SCOPM Task Force Findings on MAP-21 Performance Measure Target-Setting16 States use five-year moving averages to evaluate trends.
Figure 5.2 is a graphical example of trend analysis showing both a multiyear average and individual year data. As shown, multiyear averages smooth the variation in the data year to year. More detail on calculating trends and projections is provided in Section 7.2 on Projection Methods.
Figure 5.2 Pennsylvania Roadway Fatality Trend
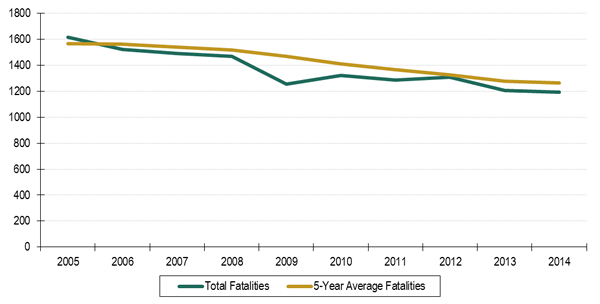
Source: Pennsylvania Highway Safety Plan, Cambridge Systematics, Inc.
Agencies will likely want to consider the impact of exogenous factors, those which are outside the safety field but affect safety, in defining their targets. Because demographic and technological factors play a significant role in safety, it is important to consider how these trends impact target setting.
Technology is likely to play a major role in helping the U.S. and other nations reduce fatalities, serious injuries, and crashes. Recently, in-vehicle technology, such as curtain airbags or rearview cameras, has been one of the largest contributors to improved roadway safety. New technologies such as vehicles that “read the road” (e.g., can identify lane markings and help reduce lane departure), and self-driving vehicles will have major safety implications. Because many of these technologies are immature, the task in the short term is to determine how much can be achieved with currently available technologies and other nontechnology-oriented strategies.
At present, demographics are the biggest driver of variation in fatalities. Population is increasingly shifting into urban areas. The nation's urban population increased by 12.1 percent from 2000 to 2010, outpacing the nation's overall growth rate of 9.7 percent for the same period, according to the U.S. Census Bureau17.
Another consideration is how involvement in fatal crashes varies greatly based on age and gender. For example, the crash rate for drivers age 16 to 19 is 4.6 crashes per 100 million VMT (100MVMT) compared to 1.2 crashes per 100MVMT for ages 30 to 69.18 Within these age groups crash rates are higher for males than females. Taking into account forecasted demographic trends can help States develop better targets.
It is often useful to leverage the experience of other States when evaluating the impact of exogenous factors. States or regions that have undergone similar transitions can provide helpful insights about expected safety impacts.
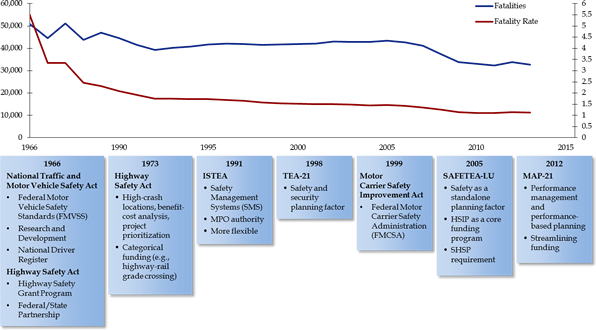
Implementation of key safety legislation can have a significant impact on traffic safety. As shown in Figure 5.3, at a national level, legislative changes resulting from Federal transportation bills are correlated with reductions in the number of fatalities and the fatality rate.
Evidence at the State level suggests enacting legislation such as primary seatbelt laws, motorcycle helmet laws, and strengthened graduated driver licensing (GDL) requirements reduces fatalities19. However, the degree of fatality reduction is tied to the level of resources applied to implementation and enforcement. Information about calculating performance of planned improvements is provided in Section 6.7.
Figure 5.3 National Legislative History and Fatality Trends
Agencies can use performance analysis to understand what is likely to be achieved by a planned safety program, which then can then inform the evidence-based target setting process. This approach builds on existing efforts by State DOTs to understand effectiveness of countermeasures implemented in their State. State DOTs, FHWA, and other national research organizations examine countermeasure effectiveness on an ongoing basis.
Particularly for infrastructure improvements, forecasts of safety impacts resulting from implementation of proven countermeasures can be made using crash modification factors (CMFs). Agencies can draw upon nationally developed CMFs, such as those provided in the Highway Safety Manual or the CMF Clearinghouse, as well as the knowledge they already have about the effectiveness of projects implemented in their State or region. Results from implemented projects that address the unique conditions of the State or region are likely the most useful. A target is evidence-based if it incorporates the expected results of a set of improvements in a plan.
Traditional benefit-cost analysis estimates the value of potential crash reduction based on CMFs for a given treatment. States can also look at the impact of a broader set of investments on fatalities by comparing historical investment trends against the associated impact on targeted crashes to determine what types of investments are most effective in reducing fatalities. This will help provide a sense of the level of investment required to reduce fatalities in one emphasis area compared to another.
Under MAP-21, States are required to report to the U.S. DOT Secretary on progress made implementing highway safety improvements, the effectiveness of those improvements, and the extent to which fatalities and serious injuries on all public roads have been reduced, including a breakdown by functional classification and ownership to the maximum extent practicable.20 As part of this reporting process, States have to describe the effectiveness of HSIP-funded projects. States should also determine the benefits and costs of not only infrastructure programs but also behavioral, enforcement, EMS and other programs. This type of evaluation should be incorporated into as many projects as possible for which good effectiveness data do not yet exist to develop new CMFs.
Behavioral programs are impacted by the manner of implementation and a State’s culture and effectiveness data are less likely to be available; therefore, it is even more beneficial for States to study program effectiveness on behavioral countermeasures. This will enable States to know which programs are delivering results and are most cost effective. Moving forward, this State-specific safety effectiveness information will help determine which programs to replicate and expand and which to modify or discontinue. The results can be used to forecast the outcomes of a safety plan and support the target setting process.
14 http://www.gpo.gov/fdsys/pkg/FR-2013-01-23/html/2013-00682.htm.
15The Highway Safety Improvement Program is the safety program through which infrastructure-oriented safety projects are prioritized and programmed?. The projects identified in the HSIP are also included in the State Transportation Improvement Program (STIP).
16SCOPM Task Force Findings on MAP-21 Performance Measure Target-Setting http://scopm.transportation.org/Documents/SCOPM%20Task%20Force%20Findings%20on%20Performance%20Measure%20Target-Setting%20FINAL%20v2%20(3-25-2013).pdf, p. 13.
17https://www.census.gov/newsroom/releases/archives/2010_census/cb12-50.html
http://www.iihs.org/iihs/topics/t/teenagers/fatalityfacts/teenagers.
19Countermeasures that Work, 2013, NHTSA
20https://www.fhwa.dot.gov/map21/factsheets/hsip.cfm
| < Previous | Table of Contents | Next > |

