U.S. Department of Transportation
Federal Highway Administration
1200 New Jersey Avenue, SE
Washington, DC 20590
202-366-4000
| < Previous | Table of Contents | Next > |
Safety analysis is a data-driven process. For performance measures to be useful, relevant data must exist. Realistic targets also require the existence of appropriate data. This section outlines the core data needed for fatality and serious injury target setting and identifies other data useful for further refining safety targets. The information is grouped into three categories: trend data, data on exogenous factors, and countermeasure impact data.
The following sections walk through the technical analysis aspects of methods and data requirements for setting urbanized and nonurbanized safety targets.
A core data element States must collect for trend analysis is fatalities. Fatal crash data are high quality as they are standardized among States and available in the national FARS database. Each State has one or more FARS analysts who review crash reports and correct errors. All fatal crashes include detailed location data and can be mapped in GIS, which is necessary to enable analysis of data and target setting for urbanized or nonurbanized areas. FARS contains comprehensive information on factors involved in each crash, which enables understanding the distribution of crash types between urbanized and nonurbanized areas. Therefore, analyzing trends for fatalities and fatality rates by urbanized versus nonurbanized areas is feasible for all States. It is useful to observe actual annual data trends as well as five-year moving average trends, as will be required for Federal safety performance monitoring.
Serious injury data is less straightforward. The primary challenge for setting serious injury targets is the quality of injury data, which are maintained individually by States in their own crash databases. The quality of injury data varies greatly. Key aspects of injury data that affect the ability to set urbanized and nonurbanized area targets are crash location, injury severity, years of data available, and data completeness, which are described in more detail below.
To categorize crashes as urbanized or nonurbanized, accurate information on crash location is needed. Ideally, datasets include latitude and longitude coordinates so the exact point location of a crash can be identified. Many States use Geographic Positioning System (GPS) data as part of the crash reporting process, so latitude and longitude are part of each crash record. With point location data such as these, crashes can easily be mapped in GIS and determined to be inside or outside the FHWA adjusted urbanized area boundary. One concern related to the use of GPS coordinate data is that the law enforcement officer must take the GPS reading at the exact crash location, which is not always possible. Map-based location methods are becoming increasingly common, which should improve the accuracy of crash location data. With this approach, the law enforcement officer locates the crash on an electronic map, clicks on the map, and coordinates and other location information are automatically entered into the crash record.
Another approach to location of crashes is the use of a State's linear referencing system. Linear referencing is used by many State DOTs to associate features (e.g., signs, guardrail, etc.) or events with the roadway network. The LRS is associated with the State's roadway infrastructure file so crashes can be located with respect to mileposts or other roadway location information. This approach to locating crashes is generally quite good, although location information may have a margin of error. For example if a state has mileposts only every mile, a responder to the crash scene will note the closest milepost on the crash report but the actual crash location could be some distance of less than a mile away from that milepost. Most States are working toward development of a high quality linear referencing system but currently do not have a fully functional system in operation.
A number of States are missing crash location for crashes occurring on non-State owned facilities. A common scenario is for States to have location data only for crashes on the State highway system. This is frequently the case because State law enforcement agencies usually have the ability to input crash reports electronically in their vehicles, possibly with the assistance of GPS for crash locations, and are more experienced at completing crash reports.
In the absence of precise location data described above, some location data for serious injury crashes may be available, such as an address, zip code or the jurisdiction in which a crash occurred (e.g., city name). These data can be useful in determining whether injuries have occurred within or outside the FHWA adjusted urbanized area, especially if entire zones (i.e., city or zip code) are known to be contained within a boundary. Some assumptions would need to be made, however, in the event the FHWA urbanized area boundary bisects one or more zones.
A second facet of working with data to calculate serious injury numbers or rates is knowing the severity of injury crashes. To calculate a serious injury number or rate, it is necessary to separate severe injury crashes from other injury crashes.
The Safety PM NPRM proposes to define serious injuries in a manner that would provide for a uniform definition for national reporting in this performance area. The FHWA proposes States adopt the latest edition Model Minimum Uniform Crash Criteria(MMUCC) definition and attribute for "Suspected Serious Injury (A)." The DOT also recommends that, by 2020, States prepare to determine serious injuries using a hospital records injury outcome reporting system that links injury outcomes from medical records to crash reports.
The MMUCC is a voluntary and collaborative effort to generate uniform, accurate, reliable, and credible crash data for data-driven highway safety decisions within a State, between States, and at the national level. These guidelines suggest a manner for classifying all data associated with a crash in a State's crash database including injury severity. Each State, however, maintains its own crash form and only periodically modifies/updates the crash form because doing so requires financial and staff resources, is expensive, and makes it difficult to compare data across years. Over time, States are modifying crash data and increasingly following the MMUCC; however, significant variation still occurs among terms used in each State. The NPRM proposes a requirement to use the latest version of the MMUCC (currently version 4), which means some States need to change the crash report forms. Injury severity classification often varies by State; States may use the KABCO scale shown in Table 6.1 or record injury severity using other categories. Category A is the code used for calculating numbers or rates of suspected serious injuries.
Table 6.1 KABCO Injury Classification
| Classification | Definition |
|---|---|
| O | Property Damage Only |
| C | Possible Injury |
| B | Suspected Minor Injury |
| A | Suspected Serious Injury |
| K | Fatal Injury |
| U | Unknown |
Source: MMUCC, Version 4.
To calculate the number of serious injuries or a serious injury rate, the data required is the number of people experiencing injuries. In some cases, crash databases are oriented around the crash and do not reliably report the number of persons injured and the level of injury severity sustained by each person. For the purpose of developing a serious injury target it must be possible to isolate only those people sustaining serious injuries and information about those crashes. In the event information is available only for the crash severity but not for the number of injuries or severity of injuries, it is possible to make assumptions about the number of severe injuries resulting from each crash type, but this will not be as accurate as if the data were reported directly. For example, States could use the information in Table 6.2 to apply to all injuries for which the severity is unknown (column 7) or nonfatal crashes (column 8) to determine the number of incapacitating injuries occurring.
6.2 KABCO/Unknown AIS Data Conversion Matrix
| O No injury |
C Possible Injury |
B Nonincapac. Injury |
A Incapac. Injury |
K Killed |
U Injured Severity Unknown |
Non Fatal Accidents Unknown if Injured | |
|---|---|---|---|---|---|---|---|
| 0 | 0.92534 | 0.23437 | 0.08347 | 0.03437 | 0.00000 | 0.21538 | 0.43676 |
| 1 | 0.074257 | 0.68946 | 0.76843 | 0.55449 | 0.00000 | 0.62728 | 0.41739 |
| 2 | 0.00198 | 0.06391 | 0.10898 | 0.20908 | 0.00000 | 0.10400 | 0.08872 |
| 3 | 0.00008 | 0.01071 | 0.03191 | 0.14437 | 0.00000 | 0.03858 | 0.04817 |
| 4 | 0.00000 | 0.00142 | 0.00620 | 0.03986 | 0.0000 | 0.00442 | 0.00617 |
| 5 | 0.00003 | 0.000013 | 0.00101 | 0.01783 | 0.00000 | 0.01034 | 0.00279 |
| Fatality | 0.00000 | 0.00000 | 0.00000 | 0.00000 | 1.00000 | 0.00000 | 0.00000 |
| Sum (Prob) | 1.00 | 1.00 | 1.00 | 1.00 | 1.00 | 1.00 | 1.00 |
Source: NHTSA, July 2011, as published in the TIGER Benefit-Cost Analysis Resource Guide updated 5/3/13.
Table 6.3 shows how the KABCO scale compares to the Abbreviated Injury Scale (AIS) scale.
Table 6.3 Comparison of Injury Severity Scales (KABCO and AIS)
| Reported Accidents (KABCO or # Accidents Reported) | |
|---|---|
| O | No injury |
| C | Possible Injury |
| B | Nonincapacitating |
| A | Incapacitating |
| K | Killed |
| U | Injured (Severity Unknown) |
| Number of Accidents Reported | Unknown if injured |
| Reported Accidents (AIS) | |
|---|---|
| 0 | No injury |
| 1 | Minor |
| 2 | Moderate |
| 3 | Serious |
| 4 | Severe |
| 5 | Critical |
| 6 | Unsurvivable |
Source: NHTSA, July 2011, as published in the TIGER Benefit-Cost Analysis Resource Guide updated 5/3/13.
The second core set of safety performance measures are fatality and serious rate (the number of fatalities or serious injuries as a function of VMT). Historical data from FHWA, State and regional sources, as well as forecasts from a travel demand model are needed to calculate fatality rate trends and forecast future fatality rates. VMT data are needed for the geographic area for which the fatality rate is being calculated. They are needed to understand underlying travel demand (total fatalities may be decreasing simply due to less travel) and to normalize fatalities into fatality rates. At a State level this is fairly straightforward, because each State reports VMT annually via the Highway Performance Monitoring System (HPMS).
To calculate urbanized and nonurbanized crash rates, VMT data must be available for urbanized and nonurbanized areas. Safety analysts will need to know whether the State has formally approved its adjusted urbanized area boundaries and reported them to FHWA, and obtain VMT for that same geographic area. Given the typical lag time between the decennial Census and State definition of adjusted urbanized area boundaries, and that the adjustment of boundaries is not mandatory, it will be important to obtain clarity on the State's policies and process for establishing and finalizing these boundaries. The State should be submitting VMT data to FHWA for the urbanized area geography so these data should be readily available via the Highway Statistics Series published by U.S. DOT21 (Tables HM-71 and HM-72). FHWA will be refining these data to provide VMT by urbanized area by State in the future so these data will be more easily accessible in future years.
The VMT data used in the rate calculations should be from the same years as the data used to calculate the fatality or serious injury number performance measures. Additionally, when establishing targets, it will be useful to understand forecasted VMT growth rates in urbanized and nonurbanized areas.
Figure 6.1 shows the linear relationship between statewide annual average VMT and the number of fatalities in 2013 at the aggregate level–the more exposure to risk in terms of more miles traveled, the higher the number of fatalities. However, each State should consider evaluating its own trends as significant variation exists across States. For example, several States, such as Utah and Washington, have experienced increasing population and VMT concurrent with decreasing fatalities, due at least in part to effective safety programs. In addition, given other trends such as declining vehicle licensure among younger drivers, it is useful to carefully monitor VMT trends and the relationship to safety results.
Figure 6.1 Relationship between VMT and Fatalities
by State
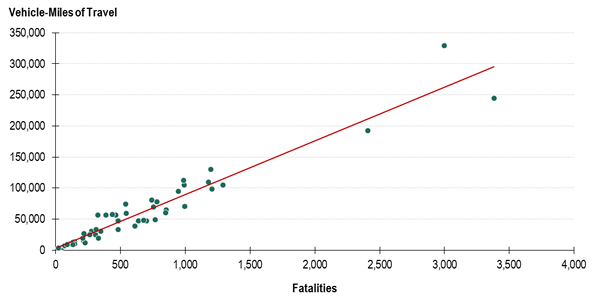
Source: Cambridge Systematics, FARS 2013.
The first step in setting urbanized and nonurbanized targets is to evaluate statewide fatality and serious injury trends broken down by urbanized and nonurbanized areas. A good practice is to use a five-year moving average for ten years of data, resulting in six data points. States will need to take into account the target set for statewide fatalities or serious injuries and ensure targets for urbanized and nonurbanized areas ultimately add up to the total reduction target.
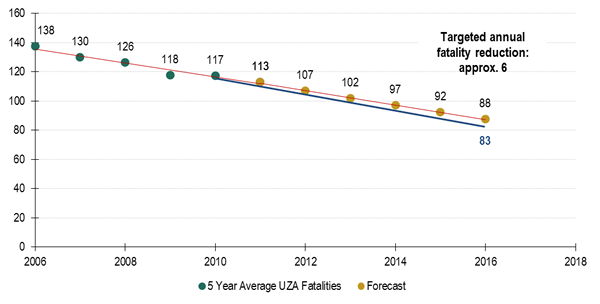
Figures 6.2, 6.3, and 6.4 show sample State trend data for total, urbanized, and nonurbanized area fatalities using five-year moving averages, which are also forecast out five years into the future using linear regression. The green circles represent historical sample data and the gold circles are forecasted data based on the historical data. Therefore, if the State anticipated continuing this trend, it could set a target of 411 fatalities by 2012-2016, which represents a statewide reduction of approximately 35 fatalities per year.
Figure 6.2 Sample State Total Fatality Trend
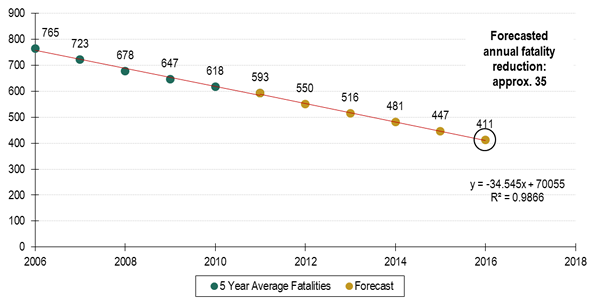
Source: Cambridge Systematics, Inc.
Figure 6.3, shows sample historical trend data for fatality reduction in urbanized areas (green circles) and a forecast if that same rate of reduction were to continue into the future (gold circles). The urbanized area fatality target could be set for an average of 88 fatalities in 2012-2016 based on continuing the existing trend.
Figure 6.3 Urbanized Area Fatalities
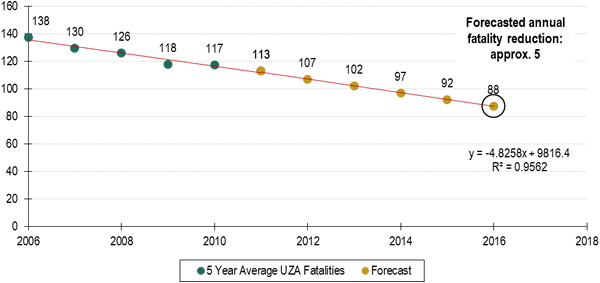
Source: Cambridge Systematics, Inc.
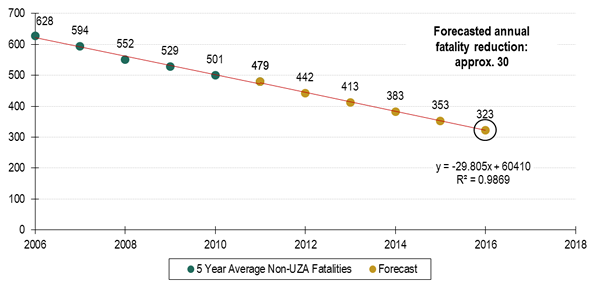
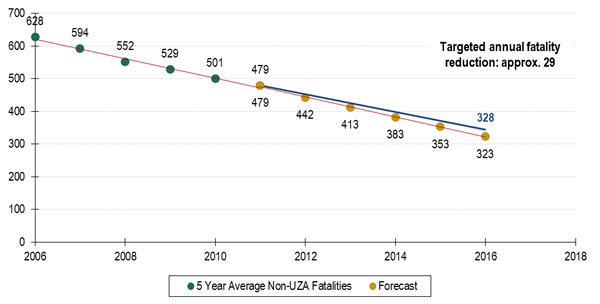
Similarly, a linear regression was calculated in nonurbanized areas (Figure 6.4) to forecast a target if the existing trend were to continue. For nonurbanized areas, a reduction of 30 fatalities per year and a target of 323 fatalities in nonurbanized areas could be set for 2012-2016 based on the historical trend. Of course the urbanized and nonurbanized area forecasts need to add up to the total statewide fatality forecast.
Figure 6.4 Nonurbanized Fatality Trend
Source: Cambridge Systematics, Inc.
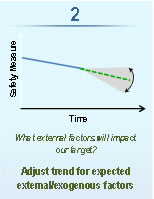
Changes in population are outside the control of safety planners, yet impact the number of fatalities as population growth typically results in VMT increases and increased exposure to safety risk. Historical and forecasted population data can help with target setting.
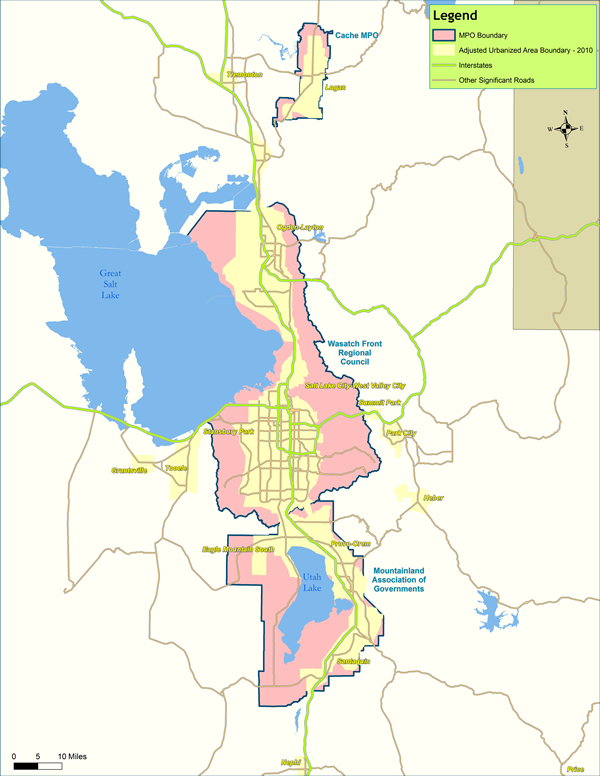
When considering either an aggregated urbanized area target for the State, or individual urbanized area targets, it is important to consider development trends in urbanized and nonurbanized areas. A State may want to consider the extent to which policies are in place encouraging infill development within urbanized areas or whether development is occurring mostly in nonurbanized areas. To understand recent development trends, a State can obtain Census data on population density trends over the past decade. MPO planning areas are nearly always larger than adjusted urbanized areas as shown in Figure 6.5 so MPO data can also inform decisions about urbanized area target setting.
Figure 6.5 Adjusted Urbanized Areas and MPO Areas for Three Utah MPOs
Additionally, MPOs regularly develop forecasts of future population and employment and distribution throughout the planning area. While data are prepared for long-term forecasts (i.e., 30 years in the future), interim forecasts (i.e., 5 years) should also be available to inform near-term target setting. Understanding where growth is anticipated related to the urbanized area boundaries will provide additional insight into where VMT growth is expected and how that may impact safety in urbanized or nonurbanized areas.
States may also isolate the proportion of the current population under age 25 and those over age 65 in urbanized and nonurbanized areas. These age groups tend to have higher fatality rates and are disproportionately affected by certain contributing crash factors; therefore, certain strategies are more effective if targeted to these groups. Given the high incidence of crashes and fatalities among younger drivers, analysts should break them down into smaller age groups (such as 16 to 17, 18 to 20, and 21 to 24) for greater precision. States and regions should review recent demographic trends and available forecasts for population distribution by age for the target year. The change in proportions among these age groups over time can impact changes in fatalities over time, even without implementing any safety strategies. As shown in Figure 6.6, the rate of fatalities among drivers ages 16 to 24 is higher per 100,000 population than the rate overall, although it has declined significantly over the last 15 years. Therefore, if a State anticipates a larger cohort of younger or older drivers in its target year, the State may choose to adjust its target accordingly.
State records on licensed drivers may help an agency understand the proportion of at-risk drivers. Changes in automobile ownership and driving rates may impact future safety targets as much as countermeasure selection. In 2011, the percentage of 16 to 24 year olds with driver's licenses dipped to 67 percent–the lowest percentage since at least 1963.22 This seems to indicate that younger drivers may be choosing to delay or not pursue licensure, which reduces their in-vehicle crash exposure. However, they are likely taking transit, which has almost zero risk, or they may be walking or riding a bicycle more often and therefore be more exposed to the risks associated with those modes.
Figure 6.6 National Fatalities per 100,000 Population
Young Drivers versus Total
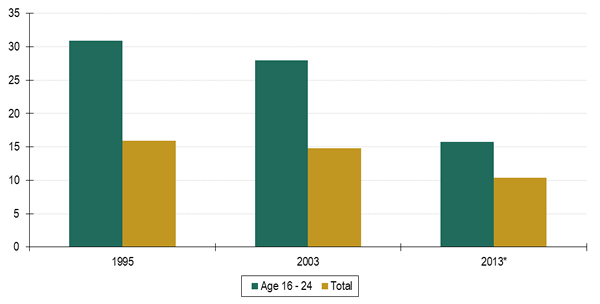
Source: Cambridge Systematics, Inc., FARS; U.S. Bureau of the Census
Note: 2013 data are preliminary.
Another facet of understanding potential future safety performance is considering the transportation landscape where growth is anticipated. A major consideration is whether transit is available and trends in transit use. If transit is available, the State will want to understand the transit mode share in a State's urbanized areas. MPOs will be an important resource as they can provide this information for both current conditions and future forecasts from their travel demand models. These forecasts should take into account anticipated investments in transit, pedestrian and bicycle transportation and the extent to which mode shift is anticipated. In general transit is very safe, so a shift from auto trips to transit will benefit safety. If more people are biking and walking, they will be reducing their risk for crashes in a vehicle, but they may be more vulnerable to crashes depending on the state of bicycle and pedestrian infrastructure (i.e., existence of continuous sidewalks or protected bicycle lanes). It will be important to consider mode shift but if the result of lower VMT growth is more serious crashes involving nonauto modes, safety may not improve overall. It is important to make sure that any changes to the mode share also take into account the share of crashes by mode.
An important question to consider for the urbanized areas in a State is the extent to which they have a strong transportation safety culture. To assess this it is useful to understand the extent to which the MPOs are conducting proactive safety planning, which will have an influence on how safety is considered in regional transportation investments and how aggressive targets should be. A resource for understanding how to consider the extent of safety integration into planning is the Framework for Institutionalizing Safety in the Transportation Planning Process.23 Questions the State can ask regarding MPO safety planning include:
If regions are fairly proactive on safety, then it might make more sense to set a more aggressive urbanized area target.
Now we will carry the example into the second step of the framework. In Step 1 the statewide target for urbanized areas was 88 fatalities and 323 fatalities for nonurbanized areas. The example State's analysis shows it should expect more future development in nonurbanized areas than in urbanized areas and therefore more nonurbanized VMT, as well as an increasing proportion of drivers over age 65 in nonurbanized areas. As a result, it may be more difficult to make progress on reducing severe crashes in nonurbanized areas. As a result, the State might want to adjust the target so it is more aggressive in urbanized areas and less aggressive in nonurbanized areas. In this example it was shifted from a reduction in fatalities of about five per year to a reduction of about six fatalities per year so the target is now 83 fatalities by 2012-2016 in urbanized areas as shown in Figure 6.7.
Figure 6.7 Sample Step 2 Consideration of Exogenous Factors – Urbanized Areas
The target in nonurbanized areas would then be less aggressive, e.g., increased from 323 to 328 fatalities by 2016, as shown in Figure 6.8.
Figure 6.8 Sample Step 2 Consideration of Exogenous factors – Nonurbanized Areas
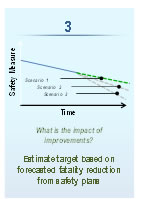
States should use the safety analysis tools listed in Section 5 to adjust targets. Program and project evaluations help agencies determine which countermeasures are most effective in saving lives and reducing injuries. Agencies should determine which countermeasures have not demonstrated the expected effectiveness and reconsider or modify them in the future. The results of all such evaluations should be captured in a knowledge base to improve future estimates of effectiveness and for consideration in future decision-making and planning. This information is a critical input into evidence-based safety target setting. When a State sets or updates a safety target, it should draw upon its body of knowledge of project effectiveness for use in forecasting future fatality reductions given a set level of resources. This information will help the State develop the most effective safety program possible and also ensure its fatality targets are realistic.
To understand the extent to which a particular measure is working, the State should conduct an evaluation. A range of methods are available for evaluating countermeasures depending on the available data and resources. Section 6 of the Highway Safety Improvement Program Manual describes options for conducting project and program evaluation including before/after analysis. It is critical for the purpose of target setting to continue to improve this information and use it to forecast fatality reductions anticipated from planned safety programs.
Both individual State DOT and FHWA research have examined countermeasure effectiveness for many years. The Crash Modification Factors Clearinghouse database is a continually updated source for effectiveness data for infrastructure-oriented safety countermeasures. For certain projects, a State may pursue high quality evaluation that is of the caliber to develop a CMF about the countermeasure. FHWA's A Guide to Developing Quality Crash Modification Factors is a useful resource. Given the limited number of CMFs currently available, States are encouraged to develop CMFs to contribute to this knowledge base so that fatality reduction forecasts can be continuously improved. This will help States improve the accuracy of target setting. Understanding the urban or rural context of countermeasure implementation is also important.
Data on the effectiveness of behavioral programs is limited and varies according to the scale and type of implementation. For these programs the best resource is a State's own evaluation of how the project or program worked on its roadway system. Therefore, States should evaluate projects without known effectiveness data to ensure they are implementing effective programs and they are getting the most safety improvement possible with the resources available. In-house evaluation generates confidence in the validity of the results and fosters their use in future fatality forecasts and target setting.
Through the use of efficacy data (either national CMFs or State-developed information) for multiple projects, a State can develop a detailed emphasis area plan and create reasonable fatality reduction forecasts provided all countermeasures are implemented. The combination of evidence-based data with a State's planned safety program will help generate a realistic fatality target given anticipated resources. Understanding the share of investment planned in urbanized areas will help with targets for these geographies.
Emphasis area plans should use CMFs or other data on anticipated fatality reductions to forecast the safety benefits of the investment and inform target setting. Two approaches for incorporating CMFs into target setting are: 1) CMFs can be used in individual locations to calculate the forecasted fatality or injury reduction of a specific improvement. 2) On a systemic level, improvements can be identified throughout a State or area with a history of or high potential for crashes based on identified characteristics. CMFs can be used to forecast the overall reduction in severe crashes within the countermeasure implementation area. The Oregon DOT, in cooperation with the FHWA Resource Center, recently conducted a study that shows how an emphasis area plan can estimate the expected fatality reduction that can be used in target setting, which is described in the following example.
In its Roadway Departure Safety Implementation Plan, Oregon established a roadway departure goal to reduce the 7-year average (2002-2008) of 307 roadway departure fatalities by approximately 20 percent by 2016. Achieving this goal will prevent approximately 65 roadway departure deaths from occurring each year.
Oregon combined traditional location specific strategies with systemic application of large numbers of cost-effective, low-cost countermeasures at locations experiencing specific crash types above a specified frequency level. On some corridors targeted education and enforcement initiatives were implemented.
Table 6.4 shows a sample of the calculations in the plan, including the number of crashes as well as the number of annual severe injuries and fatalities the countermeasure was expected to reduce. By dividing the cost of the project by the number of fatalities it is expected to reduce, an estimate is developed of the cost required to save one life per year. This type of analysis is useful in prioritizing projects to ensure the greatest number of fatalities is reduced given a fixed level of safety investment and in setting targets.
Table 6.4 Oregon Roadway Departure Safety Implementation Plan Countermeasures (Sample)
| Countermeasure | Approach | Number of Sections | Associated Costs ($ Million) | Annual Targeted Crash Reduction | Annual Estimated Incapacitating Injury Reduction | Annual Estimated Fatality Reduction | $ (Million) Required to Save One Annual Life |
|---|---|---|---|---|---|---|---|
| State Roads | |||||||
| Enhanced Curve Sign and Marking Countermeasures – State Rural Roads | Systematic | 750 | $3.7 | 112 | 14.71 | 7.56 | 0.49 |
| Enhanced Curve Sign and Marking Countermeasures Plus Flashing Beacons – State Rural Roads | Systematic | 20 | $0.14 | 6 | 0.78 | 0.41 | 0.34 |
| Enhanced Curve Sign and Marking Countermeasures – State Urban Roads | Systematic | 19 | $0.09 | 8 | 0.66 | 0.34 | 0.26 |
| Enforcement and Education: Alcohol Related – State Roads | Education and Enforcement |
36 | $1.3a | 5 | 1.11 | 1.04 | 6.25 |
| Local Roads | |||||||
| Enhanced Curve Sign and Marking Countermeasures – Local Rural Roads | Systematic | 442 | $4.42 | 143 | 15.29 | 7.39 | 0.60 |
| Centerline Rumble Stripes – Local Rural Roads | Systematic | 88 | $3.52 | 28 | 1.39 | 3.17 | 1.11 |
| Edge Line Rumble Stripes – Local Rural Roads | Systematic | 38 | $2.30 | 46 | 4.63 | 2.12 | 1.08 |
a Annual costs.
Benefit-cost analysis is a useful approach for providing a relative sense of the fatality reduction results expected for a specific investment. Development of project specific benefit-cost ratios will help prioritize safety investments for an emphasis area plan. If the projects with the best benefit-cost ratio in a specific emphasis area are chosen for implementation, a State will know it has developed the most effective program possible with defined resources. Once emphasis area plans including fatality reduction forecasts are developed, they can be used to inform development of a fatality target. The use of benefit-cost analysis in combination with emphasis area plan development will help a State know how aggressive the target can be while ensuring it is realistic. Guidance on how to conduct benefit-cost analysis is available in the HSIP Manual.
An important facet of understanding crash trends and identifying countermeasures to reduce fatalities is knowledge of the most prevalent emphasis areas in urbanized and nonurbanized areas. A few States conduct analysis of the share of the safety problem within an emphasis area in urban and rural areas. This can inform the extent to which countermeasures addressing crashes in that emphasis area are targeted to urbanized versus nonurbanized areas. If States decide to set urbanized or nonurbanized targets, they will likely want to pay even closer attention to this distribution as they set targets and implement programs.
The study team analyzed FARS data for 2007 to 2011 to determine the proportion of fatalities in each geography by key emphasis areas, which are summarized in Table 6.5. At a national level, some emphasis areas for which fatalities occur primarily in urbanized areas include: pedestrians (71 percent), bicycles (68 percent), and intersections (68 percent). Emphasis areas dominant in nonurbanized areas include: animal involved (91 percent), unlicensed driver (76 percent), fatigued/asleep (82 percent), and roadway departure (68 percent).
Table 6.5 Fatalities by Crash Type in Urbanized and Nonurbanized Areas
| National Fatalities (Annual Average 2007-2011) | Urbanized Area Fatalities | Percent Urbanized Area Fatalities | Nonurbanized Area Fatalities | Percent Nonurbanized Area Fatalities | |
|---|---|---|---|---|---|
| Total | 35,371 | 14,402 | 41% | 20,969 | 59% |
| Alcohol/Drug Impaired | 11,461 | 4,616 | 40% | 6,846 | 60% |
| Seatbelt/Helmet Not Used/Misused | 18,472 | 7,137 | 39% | 11,335 | 61% |
| Distracted/Inattentive Driver | 4,886 | 1,769 | 36% | 3,117 | 64% |
| Fatigued/Asleep | 870 | 159 | 18% | 711 | 82% |
| Aggressive | 225 | 103 | 46% | 122 | 54% |
| Speed Related | 10,316 | 4,162 | 40% | 6,154 | 60% |
| Pedestrian Killed | 4,373 | 3,109 | 71% | 1,265 | 29% |
| Bicyclist Killed | 668 | 455 | 68% | 213 | 32% |
| Motorcyclist Killed | 4,840 | 2,349 | 49% | 2,492 | 51% |
| Large Truck Involved | 1,306 | 489 | 37% | 817 | 63% |
| Train Involved | 178 | 59 | 33% | 119 | 67% |
| Intersection | 8,412 | 4,930 | 59% | 3,481 | 41% |
| Roadway Departure | 20,710 | 6,726 | 32% | 13,984 | 68% |
| Work Zone Location | 678 | 319 | 47% | 358 | 53% |
| Animal Involved | 218 | 19 | 9% | 199 | 91% |
| Unlicensed Driver | 12,429 | 3,044 | 24% | 9,385 | 76% |
| Young Driver | 5,896 | 2,309 | 39% | 3,587 | 61% |
| Older Driver | 6,496 | 2,727 | 42% | 3,769 | 58% |
Source: FARS, Cambridge Systematics
To forecast the extent of anticipated safety progress in urbanized as compared with nonurbanized areas, it is necessary to estimate the level of investment in the two geographies. One way to do this at a broad level is to review the share of fatalities and serious injuries in urbanized and nonurbanized areas within each of the emphasis areas as defined in the SHSP. If future investments are required to align with SHSP emphasis areas, progress should be anticipated in those areas. The State will want to understand whether the future investments are likely to provide more benefit to urbanized or nonurbanized area crashes.
Table 6.6 shows an example State's fatalities by emphasis area and the breakdown by urbanized and nonurbanized areas. The total exceeds the actual total of fatalities as each crash may have multiple factors and be represented in multiple emphasis areas. As shown in Table 6.6, two thirds of the fatalities addressed by the emphasis areas are located in nonurbanized areas. Therefore, planned expenditures should have a greater impact on nonurbanized fatality reduction and the target for the nonurbanized areas should be more aggressive.
Table 6.6 Example State Fatalities and Serious Injuries by SHSP Emphasis Area
| Emphasis Area | Number of Fatalities in Urbanized Area | Number of Fatalities in Nonurbanized Area | Emphasis Area in SHSP |
|---|---|---|---|
| Alcohol/Drug-Related | 45 | 55 | ✓ |
| Occupant Protection (safety belts, helmets) | 53 | 75 | |
| Distracted/Inattentive Driving Related | 11 | 7 | |
| Fatigued/asleep | 4 | 17 | |
| Aggressive | 8 | 23 | |
| Speed-Related | 12 | 55 | ✓ |
| Pedestrian Involved | 5 | 0 | |
| Bicycle Involved | 6 | 1 | |
| Motorcycle Involved | 5 | 10 | |
| Large Truck Involved | 9 | 9 | |
| Train Involved | 1 | 0 | |
| Intersection/Intersection-Related (signalized and unsignalized) |
62 | 29 | ✓ |
| Roadway Departure: head-on, roadside objects (trees, utility poles), horizontal curves | 20 | 205 | ✓ |
| Work Zone | 2 | 4 | |
| Animal Related | 2 | 0 | |
| Unlicensed/Suspended/Revoked License | 1 | 8 | |
| Young Driver Involved | 30 | 86 | ✓ |
| Older Driver Involved | 38 | 16 | |
| Share of total fatalities and serious injuries by urbanized/nonurbanized area | 370 (34%) | 542 (66%) | |
| Share of Emphasis Area fatalities and serious injuries addressed by urbanized/nonurbanized area | 296 (31%) | 431 (69%) |
Resource allocation is a key element of the performance-based planning process. As progress toward achieving targets is made, agencies should engage in a continuous process of reevaluation and reallocation of resources based on where progress is being made and where problems still exist. To understand how investments are affecting progress in urbanized and nonurbanized areas, States should continuously track the level of investment in each of these geographies as well as fatality and serious injury trends in each geography. Historically States have not allocated resources to urbanized or nonurbanized areas strictly based on crash trends in these geographies. They have been more likely to invest based on the scale of a safety problem as compared to the rest of the State or the benefit-cost analysis for an improvement. However by tracking trends in urbanized and nonurbanized areas, States may learn that they need to reallocate resources to the geography where numbers or rates are experiencing lower levels of progress or modify how they apply countermeasures in urbanized and nonurbanized areas. For example, if a State determines the majority of its unbelted fatalities and serious injuries are in nonurbanized areas, it will need to ensure that its education and enforcement programs are targeting drivers outside of the urbanized area.
Funding sources have traditionally been limited in their use and organizational structures have been siloed with infrastructure-oriented funding and countermeasures handled by the State DOT and behavioral funding and countermeasures handled by the SHSO. This arrangement has made it challenging to shift funding between programs. However, State DOTs now have the flexibility to shift significant amounts of HSIP funds to noninfrastructure purposes. Therefore, resource allocation analysis may be even more useful in the future.
In the example, because the SHSP analysis to understand anticipated impact of future investments showed more benefit to nonurbanized areas, the State decides to readjust the nonurbanized target once again to make it more aggressive. Therefore, the end result is to go back to the original trend line shown in Step 1 with a target of 88 fatalities in urbanized areas and 323 fatalities in nonurbanized areas by 2012-2016.
21 https://www.fhwa.dot.gov/policyinformation/statistics.cfm.
22http://www.uspirg.org/sites/pirg/files/reports/A%20New%20Direction%20vUS.pdf.
23http://onlinepubs.trb.org/onlinepubs/nchrp/docs/NCHRP08-76_PhaseI-FR.pdf.
24Under MAP-21 States are required to coordinate with MPOs on development of State targets. MPOs will be required to set safety targets or adopt the State safety target.
| < Previous | Table of Contents | Next > |

