U.S. Department of Transportation
Federal Highway Administration
1200 New Jersey Avenue, SE
Washington, DC 20590
202-366-4000
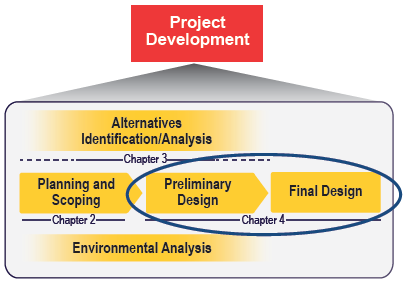
The preliminary and final design phases are clearly defined for most jurisdictions, yet key elements of these two phases can differ for each transportation agency. This Guide, therefore, combines the preliminary and final design into a single chapter.
During the design phase, design decisions must be refined and finalized prior to construction. In general, safety assessments in the design phase focus on documenting design decisions, including those that require exceptions to the design standards, and calculating the estimated number of crashes that can be anticipated for the final facility design.
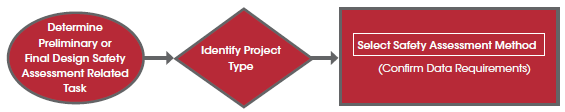
This chapter provides information to help select safety assessment methods suitable for addressing questions about safety performance that arise during these preliminary and final design activities based upon the related task and project type. This Guide describes the design tasks in four general categories:
Selecting specific design elements and their dimensions is a critical design activity for all elements of the project. The objective of the safety assessment in this task is to compare the estimated safety performance for the alternative dimensions or elements. This safety assessment information can then be used to help inform the final facility design process.
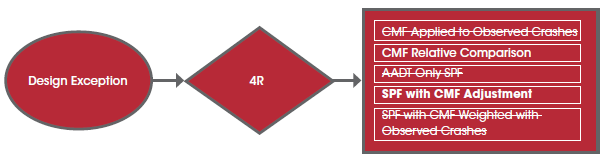
Design exceptions are needed on National Highway System roadways when controlling criteria are not met. States may also require documentation of deviations from their own design criteria on or off the National Highway System. The objective of safety assessment in this task is to estimate how the design exception impacts safety performance and to identify and evaluate potential strategies for mitigating the impact. The goal of this task is to quantify the design exception and potential mitigation strategies so that corridor safety performance is not adversely affected.
On certain projects, value engineering provides recommendations for providing needed functions, optimizing value and quality, and reducing the time to develop and deliver the project (23 CFR 627). The objective of safety assessment in this task is to quantify safety performance so that it can be weighed with other project considerations.
Establishing the work zone transportation management plan enables efficient construction of a project without compromising safety or operations. The objective of safety assessment in this task, as it relates to safety performance, is to compare the safety impacts of the various traffic control strategies considered during development of the transportation management plan.
Table 8 identifies the seven assessment methods applicable to the preliminary and final design tasks and their safety performance related analysis objective. The check marks in Table 8 suggest suitable safety assessment methods for each related task and objective and, in some cases, are distinguished by project type. In this context, the term "suitable" means that the method generally has the capability to address the safety performance related analysis objective with the data typically available for the related task and project type.
The following example questions demonstrate the type of questions the analyst may develop at the beginning of the safety assessment. These questions are based on the example problems included in this chapter.
Table 9 highlights that the level of predictive reliability generally increases moving from basic to advanced methods. At the same time, the required resources for the analysis also will increase. In some cases, it may not be feasible to fully implement the preferred safety assessment method due to limitations in site information, crash data, traffic volume, or similar information. As an example, the basic safety assessment method for a CMF Applied to Observed Crashes cannot be executed if historic crash data is not available. Consequently, the approach for selecting a safety assessment method for alternatives evaluation and identification is graphically depicted as follows.
| Safety Assessment-Related Tasks* | Objective | Project Type | Basic | Intermediate | Advanced | |||||
|---|---|---|---|---|---|---|---|---|---|---|
| Site Evaluation or Audit (Observed Crashes) | Historical Crash Data Evaluation (Observed Crashes) | CMF Applied to Observed Crashes (Observed Crashes) |
CMF Relative Comparison | AADT-Only SPF (Predicted Crashes) | SPF with CMF Adjustment (Predicted Crashes) | SPF with CMF Weighted with Observed Crashes (Expected Crashes) | ||||
| Selecting specific design elements and their dimensions | To compare safety impacts of alternative dimensions | 2R | ✓ | ✓ | ✓ | ✓ | ||||
| 3R, 4R | ✓ | ✓ | ✓ | ✓8 | ✓ | ✓ | ✓ | |||
| NL | ✓ | ✓ | ✓5 | |||||||
| Design Exception | To estimate design exception impacts on safety performance and to identify and evaluate strategies for mitigation | 3R, 4R | ✓ | ✓ | ✓ | ✓7 | ✓ | |||
| NL | ✓ | ✓ | ||||||||
| Value Engineering | To quantify safety performance so that it can be weighed with other project considerations | 4R | ✓ | ✓ | ✓6 | ✓ | ✓ | |||
| NL | ✓ | ✓ | ||||||||
| Establishing the Work Zone Transportation Management Plan | To compare safety impacts of traffic control strategies | 2R | ✓ | ✓ | ||||||
| 3R, 4R | ||||||||||
| NL | ||||||||||
| Data Requirements** | Basic | Intermediate | Advanced | |||||
|---|---|---|---|---|---|---|---|---|
| Site Evaluation or Audit (observed crashes) | Historical Crash Data Evaluation (observed crashes) | CMF Applied to Observed Crashes | CMF Relative Comparison | AADT- Only SPF (predict-ed crashes) | SPF with CMF Adjustment (predicted crashes) | SPF with CMF Weighted with Observed Crashes (expected crashes) | ||
| Road Type1 | ✓ | ✓ | ✓ | ✓ | ✓ | ✓ | ||
| Road Characteristics2 | ✓ | ✓ | ✓ | ✓ | ✓ | |||
| Traffic Volume (vpd)3 | ✓ | ✓ | ✓ | |||||
| Observed Crash Data4 | ✓ | ✓ | ✓ | |||||
* Predictive reliability increases as the complexity of assessment progresses from basic through advanced.
* The level of resources seeded (staff, analysis, time, etc.) increases as the complexity of assessment progresses from basic through advanced.
1Road Type refers to rural two-lane highway, rural multi-lane highway, urban freeway, etc.
2 Road Characteristics includes physical features such as lane widths, access density, etc.
3 Traffic Volume is the ADT or AADT in vehicles per day.
4 Observed Crash Data represents the historic crash data at the study site for a period of more than 1 year (preferably 3 to 5 years).
5See Example Problem 4.1.
6 See Example Problem 4.2.
7 See Example Problem 4.3.
8 See Example Problem 5.3.
Note: Project type definitions are as follows: R2 = resurfacing existing facilities. R3 = major rehabilitation of an existing facility. R4 = major retrofit construction efforts. NL = highway construction at a new location. See Table 3 for a full definition of each Project Type. ü = suitable safety assessment method. ADT = average daily traffic. AADT = annual average daily traffic. CMF = crash modification factor. SPF = safety performance function. vpd = vehicles per day.
This chapter provides examples that demonstrate the selection process for the preliminary and final design safety assessment methods. These examples are simplified, hypothetical problems intended to illustrate the thorough process for selecting a method and demonstrate how to apply the method to answer the associated safety-based question.
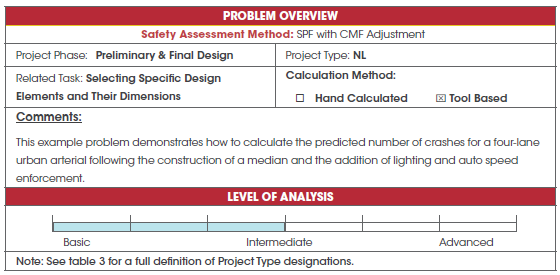
As part of an expansion effort, a city will be constructing a new four-lane urban arterial. The analyst has been asked to estimate the number of crashes that could occur annually on this facility. The new corridor will be 1-mile long and will only have four minor residential driveways. Other characteristics of the road include a 20-ft. wide median, street lighting, and automated speed enforcement. The Project Type is NL and the Related Task is Selecting Specific Design Elements and Their Dimensions. How can the analyst estimate the annual number of crashes for this new facility?
The predicted AADT (for the major approach) is 28,000 vpd, and there are four minor residential driveways. Additional road information is as follows:
The analyst can review the applicable safety assessment methods summarized in Table 9. The Selecting Specific Design Elements and Their Dimensions project task for a NL project type is associated with three safety assessment methods (one basic and two intermediate). The CMF-based methods are needed to evaluate the influence of unique geometric characteristics, so the analyst eliminates the AADT-Only SPF option. The CMF Relative Comparison method can help the analyst better understand the influence of each individual design feature (for which a CMF is available), but does not provide a way to estimate the overall predicted corridor number of crashes and so this method is also eliminated from consideration. The selected safety assessment method, therefore, is the SPF with CMF Adjustment.
The HSM can be used to estimate the number of predicted crashes for an urban or suburban arterial by applying the procedures introduced in HSM Chapter 12 (pp. 12-1 to 12-122). By determining predicted crashes, the analyst can estimate how many crashes are anticipated for a specific road type with varying road conditions.

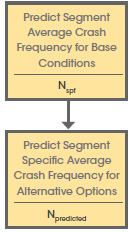
For the SPF with CMF Adjustment safety assessment method, the analyst can use the SPF from the HSM for a divided segment. This evaluation can be performed using hand calculations (see Appendix A-4.1) or by using the free self-calculating spreadsheets or FHWA IHSDM tool. For a single location, the spreadsheets can be easily applied. For more complex corridors, IHSDM is the recommended method.
The following steps provide the calculations based on using the HSM "Smart Spreadsheets" available for download at: http://www.highwaysafetymanual.org/Pages/tools_sub.aspx#4. For this example problem, the analyst should use the "HSM prediction urban and suburban arterial" spreadsheet tool. As noted in the "Summary of Available Data" section, the SPFs from the HSM have been previously calibrated to the region and have a calibration value of 1.05.
STEP 1: Input the known data for the proposed design.
The analyst should input the data for the study segment.
For segment analysis, input data in the top section (Worksheet 1A) of the "Segment 1" tab. The proposed design input data is shown as follows:
| General Information | Location Information | ||
|---|---|---|---|
| Analyst, Agency, or Company Date Performed: |
ABC City 05/10/16 | Roadway Roadway Section Jurisdiction Analysis Year: |
2015 |
| Input Data | Base Conditions | Site Conditions |
|---|---|---|
| Roadway type (2U, 3T, 4U, 4D, ST) | -- | 4D |
| Length of segment, L (mi) | -- | 1 |
| AADT (veh/day), AADTMAX=66,000 (veh/day) | -- | 28,000 |
| Type of on-street parking (none/parallel/angle) | None | None |
| Proportion of curb length with on-street parking | -- | 0 |
| Median width (ft) – for divided only | 15 | 20 |
| Lighting (present / not present) | Not present | Present |
| Auto speed enforcement (present / not present) | Not present | Present |
| Major commercial driveways (number) | -- | 0 |
| Minor commercial driveways (number) | -- | 0 |
| Major industrial / institutional driveways (number) | -- | 0 |
| Minor industrial / institutional driveways (number) | -- | 0 |
| Major residential driveways (number) | -- | 0 |
| Minor residential driveways (number) | -- | 4 |
| Other driveways (number) | -- | 0 |
| Speed Category | -- | Posted Speed Greater than 30 mph |
| Roadside fixed object density (fixed objects / mi) | 0 | 0 |
| Offset to roadside fixed objects (ft) [If greater than 30 or Not Present, input 30] | 30 | 30 |
| Calibration Factor, Cr | 1.00 | 1.05 |
STEP 2: Following input in Step 1, review the predicted number of crashes automatically calculated by the spreadsheet tool see Worksheet 1L below).
| (1) Crash Severity Level |
(2) Predicted average crash frequency, Npredicted rs (crashes/year) (Total) from Worksheet 1K |
(3) Roadway Segment Length, L (mi) | (4) Crash Rate (crashes/mil/ year) (2)/(3) |
|---|---|---|---|
| Total | 5.3 | 1 | 5.3 |
| Fatal and injury (FI) | 1.5 | 1 | 1.5 |
| Property damage only (PDO) | 3.8 | 1 | 3.8 |
Additional information related to crash type by severity is also calculated and can be reviewed in the spreadsheet tool.
STEP 3: Summarize Findings.
The analyst's ultimate goal is to calculate the estimated number of crashes predicted for the road constructed on the new location. In addition to the total number of crashes, crash severity information is important to note. The following table summarizes these results.
| Roadway Improvement Scenario | Predicted Number Fatal and Injury Crashes | Predicted Number of Total Crashes | Predicted Number of Property Damage Only Crashes |
|---|---|---|---|
| Urban Arterial with median, lighting, and automated enforcement | 1.5 (say 2) |
5.3 (say 6) |
5.3 – 1.5 = 3.8 (say 4) |
Based on an evaluation of the predicted number of crashes, an urban four-lane arterial with a 30-ft. median, four minor driveways, street lighting, and automated enforcement is estimated to have approximately six total crashes per year, of which 2 crashes are fatal and injury crashes, for a 1-mile segment of road.
The city may want to consider alternative configurations (e.g., wider versus narrower medians, the effects of on-street parking, etc.) to ultimately identify the optimal design that meets the needs of the corridor, fulfills access requirements for adjacent properties, and minimizes crashes while also considering cost effective roadway elements.
The HSM procedures require the analyst to understand how all SPFs and CMFs equate to the base conditions associated with the procedure. Incorrect use of these values can introduce erroneous results.
While the SPF with CMF Adjustment safety assessment method provides predicted crash information for the total length of road segment, selection of individual road features could be incrementally considered using the CMF Relative Comparison approach. For example, a preliminary analysis to evaluate varying the median width by a simple comparison of the CMF values can enable the analyst to narrow down the design options prior to applying the more complex (i.e., more data intensive) SPF method.
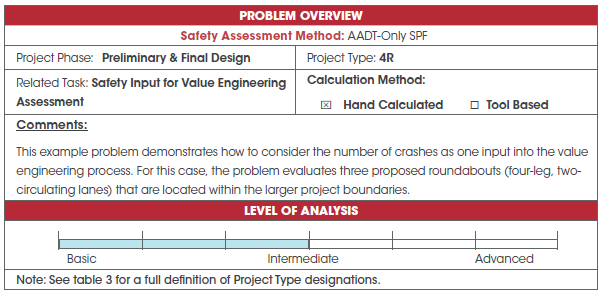
A city is reconstructing a corridor that includes several at-grade intersections. As part of the larger project, the city is documenting value engineering decisions related to the improvements. Within the corridor are three at-grade intersections that the city is designing to be converted to multilane roundabouts. Their analyst has been asked to calculate the estimated number of crashes for each roundabout so that this information can be used as input into the overall value engineering decisions. The Project Type is 4R and the Related Task is Value Engineering. How does the analyst calculate the estimated number of crashes for each roundabout?
The following table shows the predicted AADT values for the design year. For design consistency purposes, the geometric design will be similar for each proposed roundabout.
| Roundabout | Average Annual Daily Traffic (vehicles per day) |
|---|---|
| 1 | 12,700 |
| 2 | 33,150 |
| 3 | 26,000 |
Other information includes:
The analyst can review Table 9 to identify potential safety assessment methods for this effort. For a 4R project and the Safety Assessment for Value Engineering Analysis related task, five candidate safety assessment methods are available: two basic methods, two intermediate, and one advanced. The analyst notes that the crash conditions prior to corridor reconstruction represent a substantially different configuration than those shown in the design plans and so concludes that safety assessment methods based on historical (observed) crashes can be eliminated. The evaluation of a CMF Relative Comparison option would potentially provide valuable information if there were geometric differences between the three proposed roundabouts, but all three have consistent designs, and so the analyst eliminates this assessment method from consideration.
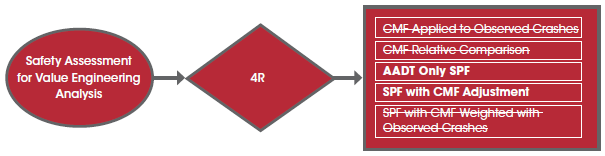
The final two candidate safety assessment methods are the AADT-Only SPF and the SPF with CMF Adjustment options. The analyst reviews candidate SPFs for these two prospective procedures and discovers that the 2010 HSM did not yet include an SPF for roundabouts; however, NCHRP Report 672 does have SPFs for roundabouts and, as previously indicated, the city has already calibrated these to local conditions. As a result, the analyst selects the AADT-Only SPF option. Linkage to the HSM:
The application of an SPF is similar to predictive methods presented in Volume 2 (Part C) of the HSM; however, the roundabout SPFs provided in NCHRP Report 672 (p. 5-23) are not included in the HSM. Detailed Analysis:
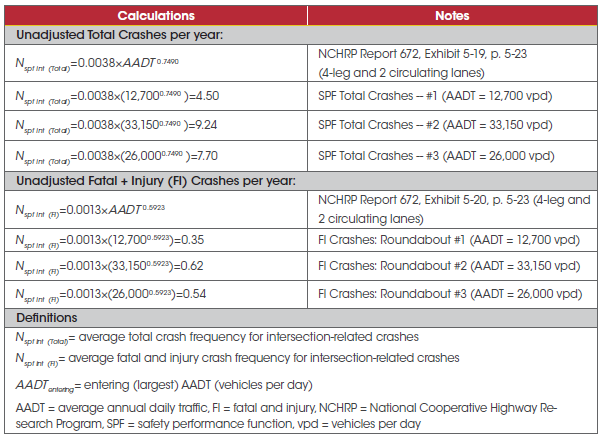
The crash prediction models in the NCHRP Report 672 only require the use of entering AADT and geometric configuration (number of legs and circulating lanes) to calculate the estimated total number of crashes at the roundabout. As previously indicated, the city uses the SPFs from NCHRP Report 672 – Roundabouts: An Informational Guide, which have been calibrated for local conditions (CTotal = 0.89, CFI = 0.93). The following steps summarize the calculations for estimating the number of crashes for each roundabout.
STEP 1: Calculate the predicted average total crash frequency and fatal and injury (FI) frequency for the roundabout (NSPF).
The NCHRP Report 672 equations for a roundabout with four legs and two circulating lanes are used for this calculation. The base conditions associated with the SPF require entering AADT values from 2000 to 35,000 vpd for the "Total Crash" equation and AADT values from 2000 to 37,000 for the "FI Crash" equation. All three of the study roundabouts meet these criteria. Note: KAB and FI crashes are assumed to be equivalent terms for the purpose of this analysis.
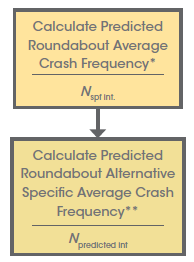
STEP 2: Calculate the predicted average crash frequency for each roundabout (Npredicted).
The predicted average crash frequency for each option can be calculated using HSM Equation C-1, p. C-4 of HSM Volume 2:
Npredicted=Nspf × (CMF1x × CMF2x ×...×CMFyx ) × Cx
Where: CMF = crash modification factor/function and C = calibration factor for SPF
For the NCHRP Report 672 equations, companion CMFs are not available, so this equation is reduced to the following (effectively assigning a value of 1.0 to each CMF value):
Npredicted=Nspf × Cx
As previously indicated, the SPF calibration factor for the local region has a total crash value of CTotal = 0.89 and a fatal and injury value of CFI = 0.93.
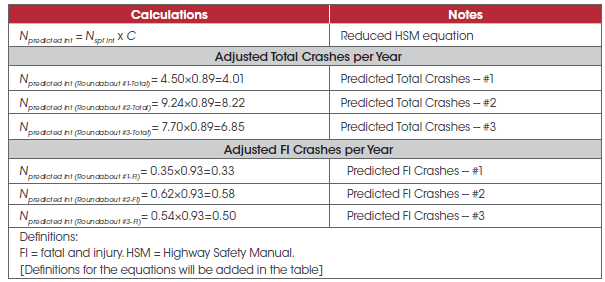
STEP 3: Summarize the findings.
| Location | Predicted FI Crashes per Year | Predicted Total Crashes per Year |
|---|---|---|
| Roundabout #1 | 0.3 (say 1) | 4.0 (say 5) |
| Roundabout #2 | 0.6 (say 1) | 8.2 (say 9) |
| Roundabout #3 | 0.5 (say 1) | 6.9 (say 7) |
Based on the results calculated using the model found in NCHRP Report 672 – Roundabouts: An Informational Guide, the analyst noted that the predicted number of crashes is substantially based on the entering traffic volume at the roundabout location. For all three roundabouts, however, the predicted number of FI crash per year is less than one. These estimates are an important input into the overall value engineering assessment. The city has elected to maintain consistent roundabout geometry for all three intersection locations and so the higher volume roundabout (in this case #2) is predicted to have more total crashes each year than the other two locations. An important aspect of value engineering is the incremental improvement of features.
It is important to confirm that, when selecting a model to predict crashes, the SPF and its associated base conditions are appropriate for the studied transportation facility. For this example, the AADT values should be consistent with those used to develop the NCHRP Report 672 (Section 5-4). Another potential error is the expectation that using the more advanced method will provide better results. For this analysis, the corridor prior to redesign is not similar to the modified corridor and intersection configuration. Consequently, the historical (observed) crashes should not be used in the evaluation for a completely different "after" intersection configuration.
The HSM also has CMFs that can be used to predict crashes for converting a two-way, stop-controlled intersection or signalized intersection to a roundabout. As noted previously, Part C (Volume 2) of the HSM does not contain an SPF for roundabouts. If the installation of a roundabout is being considered as one of the alternatives, however, the predicted number of crashes can be calculated by using the SPF for the existing conditions and then applying the appropriate CMF from HSM Part D (Volume 3).
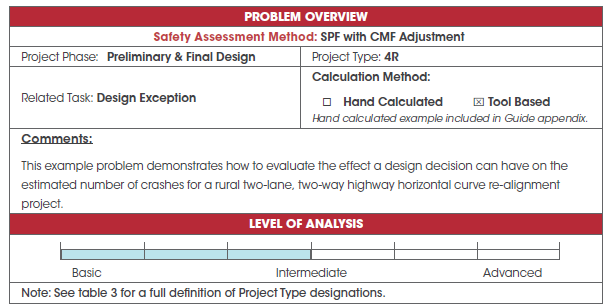
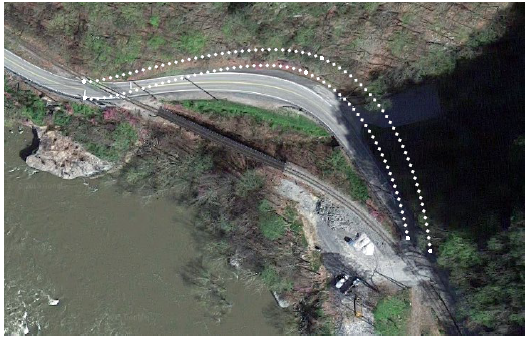
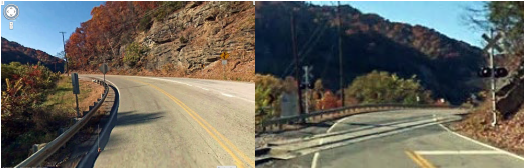
A two-lane highway that runs parallel to a river is experiencing failure of the embankment on the south side of the road. To avoid a complete failure due to a landslide, designers are planning to shift the roadway to the north. This will cause a sharper curvature along the section just prior to an at-grade rail crossing. The proposed new design results in a horizontal curve, with a 250 ft. radius, which is shorter than the minimum recommended curve radius (for e=6 percent, curve radius= 340 ft.) for its existing design speed of 35 mph, as set forth by A Policy on Geometric Design of Highways and Streets by the American Association of State Highway and Transportation Officials (AASHTO). Over the most recent 5-year period, there have been approximately 30 crashes in the vicinity of this 0.5-mile segment.
The Project Type is 4R and the Related Task is to evaluate a Design Exception. How can the analyst estimate how the change in roadway geometry may affect the number of crashes (Total and FI)?
To perform this evaluation, the analyst must know the existing and proposed roadway geometry. The roadway curve geometry is summarized as follows:
| Geometric Element (ft.) | Existing | Proposed |
|---|---|---|
| Curve Length | 200 | 230 |
| Curve Radius | 380 | 250 |
In addition, the corridor has the following characteristics:
The existing configuration with the proposed curve superimposed is shown in the following graphic.
The analyst can review Table 9 to identify suitable safety assessment methods for evaluating a 4R project type that requires a design exception. There are five candidate safety assessment methods: two basic, two intermediate, and one advanced. The specific goal of the analyst is to assess whether the alternative curve design will result in a larger number of total or fatal injury crashes based on a change in the horizontal curve geometry. This design-based evaluation requires the use of a CMF-based procedure, so the AADT-Only SPF method can be eliminated. In addition, the historical (observed) crash detailed information is not available and so the two methods that rely on observed crashes can also be eliminated (i.e. CMF Applied to Observed Crashes and SPF with CMF Weighted with Observed Crashes).
The two remaining safety assessment methods are the CMF Relative Comparison method and the SPF with CMF Adjustment method. Either of these two methods will provide useful information, but the analyst would like to estimate the number of additional crashes, and the relative comparison approach provides the percentage of additional crashes. For this reason, the analyst ultimately selects the SPF with CMF Adjustment for the subsequent evaluation.
The HSM can be used to estimate the number of predicted crashes for a rural, two-lane highway by applying the procedures introduced in HSM Chapter 10 (pp. 10-1 to 10-74). By determining predicted crashes, the analyst can estimate how many crashes may be expected for a specific road type with varying road conditions (in this case the curve radii and curve length). The HSM provides manual calculations, but a spreadsheet tool is available and can be used to simplify this analysis.
This example demonstrates how to use the HSM to estimate the likely effect of designing curves with radii less than the recommended minimum values in AASHTO's A Policy on Geometric Design of Highways and Streets.
The rural two-lane predictive method is located in Chapter 10 of the HSM. The following steps provide the calculations based on using the HSM "Smart Spreadsheets" available for download at: http://www.highwaysafetymanual.org/Pages/tools_sub.aspx#4. For this example problem, the analyst should use the "HSM prediction rural two lane" spreadsheet tool. Example hand calculations are included in the Guide Appendix (see A-4.3).
STEP 1: Input the known data for the roadway segment.
For segment analysis, input data in the top section (Worksheet 1A) of the "Segment 1" tab. The Existing Condition input data is shown as follows:
| General Information | Location Information | ||
|---|---|---|---|
| Analyst, Agency, or Company Date Performed: |
Analyst | Roadway Roadway Section Jurisdiction Analysis Year: |
SH 111 MP 0.0 to MP 0.5 Study Site 2015 |
| Input Data | Base Conditions | Site Conditions |
|---|---|---|
| Length of segment, L (mi) | -- | 0.5 |
| AADT (veh/day), AADTMAX=17,800 (veh/day) | -- | 11,000 |
| Lane width (ft) | 12 | 12 |
| Shoulder width (ft) | 6 | Right Shld: 6 |
| Shoulder type | Paved | Right Shld: paved Left Shld:paved |
| Length of horizontal curve (mi) | 0 | 0.038 |
| Radius of curvature (ft) | 0 | 380 |
| Spiral transition curve (present/not present) | Not Present | Not Present |
| Superelevation variance (ft/ft) | <0.01 | 0 |
| Grade (%) | 0 | 0 |
| Driveway density (driveways/mile) | 5 | 5 |
| Centerline rumble strips (present/not present) | Not Present | Not Present |
| Passing lanes [present (1 lane)/present (2 lane)/not present)] | Not Present | Not Present |
| Two-way left-turn lane (present/not present) | Not Present | Not Present |
| Roadside hazard rating (1-7 scale) | 3 | 3 |
| Segment lighting (present/not present) | Not Present | Not Present |
| Auto speed enforcement (present/not present) | Not Present | Not Present |
| Calibration Factor, Cr | 1 | 0.97 |
The applicable input data for the segment of the proposed alternative curve section is demonstrated in the following graphic.
| General Information | Location Information | ||
|---|---|---|---|
| Analyst, Agency, or Company Date Performed: |
Analyst | Roadway Roadway Section Jurisdiction Analysis Year: |
SH 111 MP 0.0 to MP 0.5 Study Site 2015 |
| Input Data | Base Conditions | Site Conditions |
|---|---|---|
| Length of segment, L (mi) | -- | 0.5 |
| AADT (veh/day), AADTMAX=17,800 (veh/day) | -- | 11,000 |
| Lane width (ft) | 12 | 12 |
| Shoulder width (ft) | 6 | Right Shld: 6 |
| Shoulder type | Paved | Right Shld: paved Left Shld:paved |
| Length of horizontal curve (mi) | 0 | 0.044 |
| Radius of curvature (ft) | 0 | 250 |
| Spiral transition curve (present/not present) | Not Present | Not Present |
| Superelevation variance (ft/ft) | <0.01 | 0 |
| Grade (%) | 0 | 0 |
| Driveway density (driveways/mile) | 5 | 5 |
| Centerline rumble strips (present/not present) | Not Present | Not Present |
| Passing lanes [present (1 lane)/present (2 lane)/not present)] | Not Present | Not Present |
| Two-way left-turn lane (present/not present) | Not Present | Not Present |
| Roadside hazard rating (1-7 scale) | 3 | 3 |
| Segment lighting (present/not present) | Not Present | Not Present |
| Auto speed enforcement (present/not present) | Not Present | Not Present |
| Calibration Factor, Cr | 1 | 0.97 |
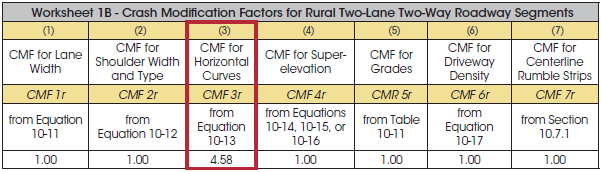
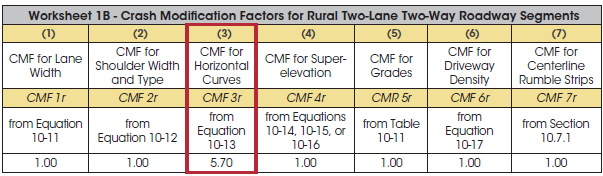
STEP 2: Following input in Step 1, the spreadsheet tools automatically calculate the predicted number of crashes. The following tables show the results for the exiting condition and the proposed alternative.
Existing:
| (1) Crash Severity Level | (2) Crash Severity Distribution (proportion) (4) from Worksheet 1C |
(3) Predicted Average Crash Frequency (crashes/year) (8) from Worksheet 1C |
(4) Roadway Segment Length (mi) | (5) Crash Rate (crashes/mi/ year) (3)/(4) |
|---|---|---|---|---|
| Total | 1.000 | 6.53 | 0.5 | 13.1 |
| Fatal and Injury (FI) | 0.321 | 2.1 | 0.5 | 4.2 |
| Property Damage Only (PDO) | 0.679 | 4.44 | 0.5 | 8.9 |
Proposed:
| (1)Crash Severity Level | (2) Crash Severity Distribution (proportion) (4) from Worksheet 1C |
(3) Predicted Average Crash Frequency (crashes/year) (8) from Worksheet 1C |
(4) Roadway Segment Length (mi) | (5) Crash Rate (crashes/mi/ year) (3)/(4) |
|---|---|---|---|---|
| Total | 1.000 | 8.13 | 0.5 | 16.3 |
| Fatal and Injury (FI) | 0.321 | 2.61 | 0.5 | 5.2 |
| Property Damage Only (PDO) | 0.679 | 5.52 | 0.5 | 11.0 |
STEP 3: Summarize the results for predicted crashes.
| Configurations | Total Predicted Crashes per Year | Fatal and Injury Crashes per Year |
|---|---|---|
| Existing Horizontal Curve Section (R = 380 ft) | 6.53 (say 7) |
2.1 (say 3) |
| Alternative Horizontal Curve Section (R = 250 ft) | 8.13 (say 9) |
2.61 (say 3) |
| Increase in Predicted Number of Crashes due to Design Exception | 8.13 – 6.53 = 1.60 (say 2) |
2.61 – 2.10 = 0.51 (say 1 FI crash every 2 years) |
| Percent Increase in Predicted Number of Crashes due to Design Exception | 1.60/6.53×100%=24.5% (say 25%) |
0.51/2.10×100%=24.3% (say 25%) |
The construction of a sharper horizontal curve at this location will result in approximately two more crashes per year with an additional fatal or injury crash predicted to occur approximately once every 2 years. These changes correspond to an increase in crashes of approximately 25 percent at the 0.5- mile section. The large percentage relative to the very small frequency can lead to an overstatement of the site conditions. The actual total number of crashes is expected to increase from 7 to 9 crashes per year. If deemed necessary, it may be feasible to "offset" this increase in crashes. The DOT may elect to acquire detailed crash data and evaluate whether additional safety treatments may help mitigate this increase in crashes. These treatments could include, for example, additional signing and marking.
The HSM recommends using engineering judgment to assess whether combined CMFs reasonably represent an estimated crash frequency. Analysts should be cautious to only multiply CMFs that correspond to the correct baseline conditions and appropriate crash types and severity. The CMF Clearinghouse FAQ titled "How can I apply multiple CMFs" provides additional information and clarification (see http://www.cmfclearinghouse.org/faqs.cfm#q4).
If data are available, a detailed evaluation of observed crash severity could help to offer additional insights regarding corridor operations. In addition, the use of the CMF Relative Comparison approach, as noted during the safety assessment method selection, may be a convenient tool for quickly considering how varying site features may ultimately influence the percent increase or decrease in crashes for a candidate safety treatment.

