U.S. Department of Transportation
Federal Highway Administration
1200 New Jersey Avenue, SE
Washington, DC 20590
202-366-4000
Sign up to have Safety Compass delivered right to your inbox!
Best for printing: PDF Version (1.7 MB)
To view PDF files, you can use the Acrobat® Reader®.
In this issue:
A Message from the FHWA Associate Administrator for Safety, Beth Alicandri
BY THE NUMBERS: SAFETY DATA AND ANALYSIS
The Calibrator – Calibrate, Critique, CURE
MIRE FDE and 2.0: What You Need to Know
Safety in Numbers – Get Up to Speed on Key Safety Data and Analysis Methods
SUPPORTING THE STATES AND TRIBES: FEDERAL AID PROGRAMS
ASAP Update: Eight States Awarded Funding for Safety Projects in FY 2018
SAFETY FOCUS AREA: VULNERABLE ROAD USERS
Two Safety Innovations Take the Stage in EDC-5
Interim Approval of RRFB Brings Updated Pedestrian Resources...and a Few New Ones, Too!
FHWA Works To Establish New Test Bed for Vehicle to Pedestrian Technology
STATE OF THE PRACTICE: UPDATES FROM STATES AND LOCALITIES
NEW RESOURCE ROUNDUPVariable Speed Limits, Ramp Metering, & Part-Time Shoulder Use in Maine
New Guide Helps Local, Regional Practitioners Achieve Zero Deaths Vision
LEARNING TOGETHER
FHWA Offers New Web-Based Training for Roadway Lighting
National Peer Exchange Focuses on Sharing Notable State DDSA Practices
New! FHWA Launches Introduction to Safety Data Analysis for Tribes
AWARDS NEWS
ANNOUNCEMENTS AND EVENTS
This Fall, "Bridge the Gap" in Rural Road Safety
New! Interactive Highway Safety Design Model (IHSDM) User Group

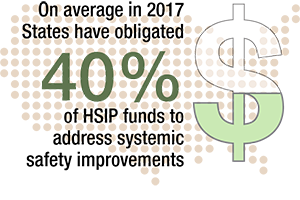
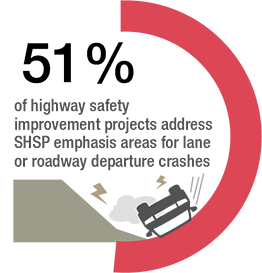
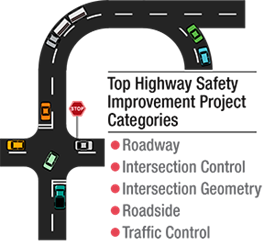
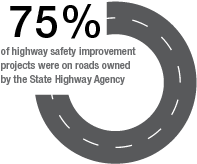
Did you know that States obligated a total of $4.3 billion on over 4,600 highway safety improvement projects in 2017 as part of the Highway Safety Improvement Program (HSIP)? The States receive about $2.5 billion annually to help them implement life-saving highway safety improvement projects through a strategic, performance-driven process designed to reduce the number of fatalities and serious injuries on all public roads, including local and Tribal roadways—a unique feature of the HSIP, as most other Federal-aid Highway Programs cannot be used on local roads.
The HSIP establishes the foundation for a successful safety management program in each State, beginning with the Strategic Highway Safety Plan (SHSP), a coordinated statewide safety plan that identifies a State's key safety needs and guides investment decisions. A State's HSIP primarily addresses the infrastructure needs identified in the SHSP and uses data-driven safety analysis to identify highway safety improvement projects. Through Safety Performance Management, States are held accountable, ensuring that their program of highway safety improvement projects meets the safety performance targets established as part of their HSIPs.
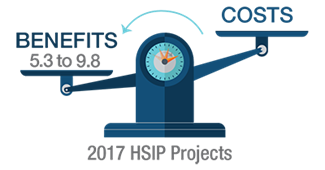
HSIP projects come in all shapes and sizes. Some are high-value reconstruction projects, while others consist of low-cost countermeasure installations across multiple sites. Speaking of which, did you know that there are fewer urban projects than rural projects, but the average total cost per project among urban projects is greater than the average total cost per project of the rural projects? This is just a sample of the many interesting pieces of information that we've discovered that improve our understanding of the safety challenge, and others are scattered throughout the issue—a treasure hunt, of sorts. If you want to learn more about how your peers and colleagues across the Nation are using this valuable funding tool to improve road safety, the 2017 HSIP National Summary Report is now available.
While you hunt for the additional fun facts, take a moment to learn about some other treasures in this issue, all of which support the HSIP. For example, the NHI's new Safety Data and Analysis Fundamentals course (p. 6) supports the data-driven requirements of the States HSIP. The two safety innovations adopted in Round 5 of the Every Day Counts Initiative (p. 10) address two of the primary infrastructure-related emphasis areas in many States' SHSPs, and the Turner-Fairbank Highway Research Center's newest test bed for vehicle-to-pedestrian technology (p. 14) will identify some of the Highway Safety Improvement Program projects of the future. As always, we encourage you to review our extensive online tools and resources at the Office of Safety web page and leverage these tools to save lives.
IN MEMORIAM
Ray Krammes
 It is with great sadness that we report the passing of our dear colleague and friend, Dr. Ray Krammes, who served as Team Leader of the Safety Data and Analysis Tools Team in the Office of Safety and Technical Director for the Office of Safety R&D. Ray passed away on July 30, 2018, after retiring from a storied 20-year career at FHWA. The recipient of dozens of achievement awards, Ray led the way in developing, managing, and evaluating programs to improve State and local agencies' safety data systems and analysis capabilities. He was passionate about using data and analysis to save lives.
Among his many accomplishments, Ray contributed significantly to the development and implementation of the Highway Safety Manual, including participating in AASHTO and TRB Highway Safety Manual Task Forces; leading the TRB HSM Task Force Software Work Group; and coordinating with AASHTO, NCHRP, and TRB. In addition, it was Ray's vision and commitment to finding innovative solutions for improving safety that led to the development of the Interactive Highway Safety Design Model.
In addition to his technical and leadership roles, Ray served as a mentor and coach to many safety engineers, specialist and advocates, inside and outside FHWA. "Ray's brilliant mind was surpassed only by his giant heart," said Associate Administrator for Safety Beth Alicandri. "He made us all smarter, made everyone feel special and valued, and convinced one and all that we can save lives. He will be sorely missed."
By: Frank Gross (VHB), Craig Lyon (Persaud & Lyon), and Stuart Thompson (FHWA)
Safety performance functions (SPFs) are integral to the roadway safety management process and Highway Safety Manual (HSM) predictive method because they project crash frequency for a given set of site conditions. SPFs are fundamental in several activities:
These activities are critical components of the roadway safety management process, the purpose of which is to reduce fatalities and serious injuries on all public roads. Given the nature of these decisions, and the value of information from SPFs, it is important to understand the reliability of an SPF. To help agencies gauge this, the FHWA has developed The Calibrator, a spreadsheet-based tool to help analysts calibrate and assess the performance of SPFs.
Calibration is important, because SPFs are produced using data from specific locations and times. The Calibrator can update (i.e., calibrate) SPFs to reflect local and temporal conditions.
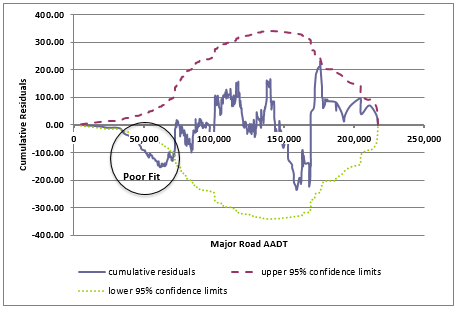
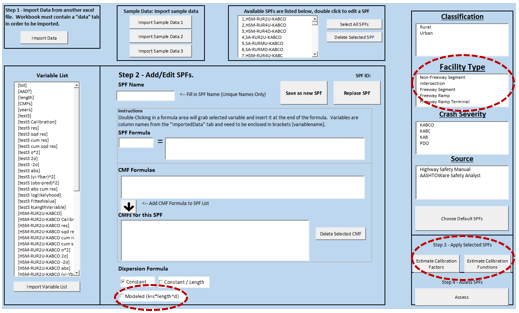
SPFs are produced using different functional forms, which relates to the shape of the SPF. The Calibrator generates cumulative residual (CURE) plots and provides goodness-of-fit measures to determine how well the SPF performs over the range of data.
The target audience for The Calibrator includes those responsible for developing new SPFs or calibrating existing SPFs. Specifically, the tool will help these users:
Version 3.0 of The Calibrator will add functionality to allow users to estimate and assess calibration functions. A calibration function provides a calibration factor specific to each location. Version 3.0 will also include new SPFs that will be included in the HSM second edition, which is currently under development. The new SPFs are not yet available, but will be added as the research is finalized; stay tuned for SPF updates in fall 2018. The table below summarizes the enhancements (in bold text).
| Version 2.0 | Version 3.0 |
|---|---|
| Calculates and provides a single calibration factor for each SPF | Calculates and provides a single calibration factor or a calibration function for each SPF |
| Calibrates the dispersion parameter as a constant or inverse linear function of segment length | Calibrates the dispersion parameter as a constant, inverse linear function of segment length, or nonlinear function of segment length |
| Provides goodness-of-fit measures to assess and compare calibration factors between two or more SPFs | Provides goodness-of-fit measures to assess and compare calibration factors and/or functions between two or more SPFs |
Provides default SPFs for the following facility types:
|
Will provide default SPFs for the following facility types (fall 2018):
|
If you are an analyst interested in getting started with The Calibrator, you can visit The Calibrator information page—where you can download the software and access a training webinar and a user guide—in the FHWA Roadway Safety Data and Analysis Toolbox. If you have additional questions about using the tool, please contact Stuart Thompson at stuart.thompson@dot.gov
By: Robert Pollack, FHWA Office of Safety
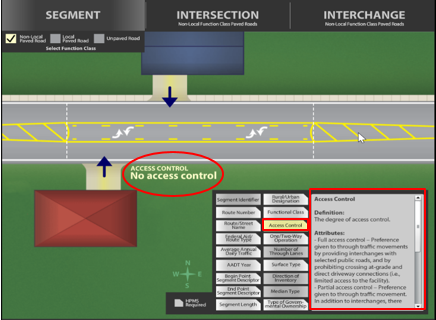
If you're curious about the Model Inventory of Roadway Elements Version 2.0 (MIRE 2.0) and the MIRE Fundamental Data Elements (MIRE FDEs), you're not alone. The FHWA Office of Safety and Office of Safety Research and Development recently conducted a webinar to provide information about the release of the MIRE 2.0 and to provide an update on the MIRE FDEs. Entitled "MIRE FDE and 2.0: What You Need to Know," the webinar was presented on June 5, 2018, to over 220 participants representing an array of data collectors, database managers, and data users from Federal, State, and local agencies.
The webinar presented information about MIRE 2.0, which was released in January 2018. The updated version is now more consistent with databases such as the Highway Performance Monitoring System (HPMS), Long-Term Pavement Performance (LTPP) program, and Second Strategic Highway Research Program Roadway Information Database (SHRP2 RID). The webinar highlighted changes to MIRE 2.0 from MIRE 1.0 including:
The MIRE FDE portion of the webinar covered key information pertaining to meeting the MIRE FDE regulation and how States appear to be progressing towards compliance with the MIRE FDE regulation. This included:
For those unable to participate in the "MIRE FDE and 2.0: What You Need to Know" webinar, FHWA has posted a link to the webinar so that individuals can view and hear the webinar. For more information on the webinar or any questions pertaining to MIRE 2.0 or MIRE FDEs, contact Bob Pollack at robert.pollack@dot.gov.
One agency is using MIRE to look at its systems of record (namely, the linear referencing system, or LRS) with the goal of finding ways to "make things once, then use them a bunch." To learn more, visit "DDOT Using Centerlines for Safety and Beyond," by James Graham, GIS and Applications Manager at District Department of Transportation, in FHWA's GIS in Transportation newsletter.
The author notes that "The [MIRE 1.0] report states unequivocally: simply having high-quality crash data is not enough. Detailed GIS roadway and traffic data are essential elements, enabling a more comprehensive safety data analysis and providing more context and understanding to the entire safety picture."
By: Mary Burke, Marketing Strategist, CHIEF, Inc.
A new web-based course from the Office of Safety, available from the National Highway Institute (NHI), equips transportation professionals with the knowledge they need to effectively interpret safety data and use it to support critical decision-making efforts.
By taking part in this innovative online training, participants will learn key safety data types and terms and will walk away with strategies for both identifying data weaknesses and strengthening the way safety data is used in their programs, projects, and communities.
"Data-driven safety analysis has been shown to quantitatively measure and even predict reductions in fatal and serious injury crashes," said the Office of Safety's Esther Strawder, who developed the course. "As such, FHWA recently put safety data system requirements in place for States to develop performance-based targets and measures. This course will help States better understand why and how data-driven safety analysis leads to safer roadways for everyone."
In explaining the course's unique curriculum model, Strawder noted that, "to help safety professionals get the most from this training, we developed an interactive curriculum that serves targeted content based on participant goals and the role they play in transportation safety." The NHI's Safety Data and Analysis Fundamentals (FHWA-NHI-380122A-D) course offers four tracks based on the student's professional goals and responsibilities:
Data Analysts – For professionals in charge of integrating and analyzing datasets—including highway safety engineers, specialists, traffic engineers, highway designers, and technical analysts. This track emphasizes the applicability, uses, strengths, limitations, and requirements of safety data and collection methods, and is a must-make for anyone whose responsibility it is to analyze safety data to identify causes and potential patterns that contribute to crashes and other systemic safety issues.
Data Collectors – For professionals responsible for collecting, coding, and managing data to support analysis and decision making. This track emphasizes the ways data collectors support the needs of data analysts and helps managers use data to make strategic, informed decisions about safety priorities. Recommended for law enforcement officers, emergency medical service providers, trauma registrars, driver and vehicle service clerks, roadway data collectors, and anyone responsible for collecting crash, traffic, roadway, behavioral, injury, or other safety data.
Project/Program Managers – For transportation professionals responsible for using safety analytics to identify and prioritize safety issues, develop and implement safety countermeasures, and evaluate project/program effectiveness. This track emphasizes the tradeoffs of project alternatives in terms of costs and benefits, including safety impacts of the project/program, as well as the individual components. Recommended for transportation planners, traffic records coordinating committee members, highway safety online directors, and State and local mid-level managers (such as division and district program managers in highway safety, design, traffic, engineering, enforcement, and public health).
Senior Managers/Safety Advocates – For anyone looking to bridge the gap between the public and practitioners and who is responsible for developing or influencing policies and practices, setting budgets, allocating resources, and making safety investments. This track emphasizes understanding the needs of data collectors, data managers, and data analysts in terms of equipment, human resources, and organizational structure. Recommended for State and local senior managers, such as division heads/chiefs of transportation, planning, civil engineering, and public health.
From safety advocates to data analysts, make sure the numbers are on your side by registering to learn how safety data can be better leveraged for the public good.
For more information about this course or the Office of Safety's Safety Data and Analysis program, please contact Esther Strawder at esther.strawder@dot.gov.
By: Frank Gross, VHB, and Stuart Thompson, FHWA Office of Safety
How much do you know about safety performance functions, or SPFs? Did you know you can use SPFs to screen roadways for sites with potential for safety improvement? Did you know you can employ SPFs to estimate and compare the safety performance of design alternatives? SPFs are also critical in using more reliable methods to estimate the safety effects of completed projects.
If you want to brush up on your knowledge of these versatile functions and learn how you can use them to enhance safety-related decisions, view FHWA's new training video, Safety Performance Functions—Application, Calibration, and Development. This free, interactive training video is designed to improve your knowledge of SPFs. New to SPFs? The video will provide all the information you need to get started. Familiar with SPFs? This video is still for you, because it will help you to understand the quality of SPFs and decide if it is more appropriate to calibrate existing SPFs or develop new agency-specific SPFs. No matter your level of knowledge, after completing the training, you will be able use SPFs more effectively in the roadway safety management process.
From start to finish, you can complete the entire training in approximately 60 minutes, covering SPF application, calibration, development, and decision making. The video starts with a brief quiz to find out how much you already know about SPFs and to help you decide which training topics to focus on. The material is conveniently divided into four modules, allowing you to skip around and focus on the desired content.
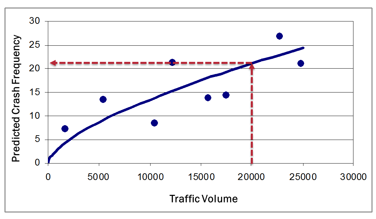
The first module covers the basics of SPFs and SPF application. It answers questions such as:
Do you know how to interpret the SPF in the image below? If not, complete Module 1 to learn more, including how to use the results in network screening, project-level design decisions, and safety effectiveness evaluation.
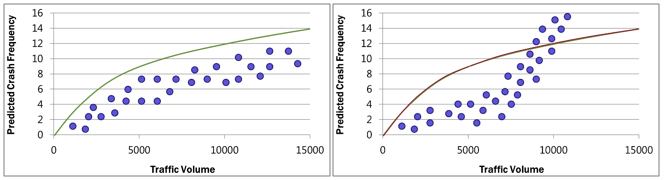
The second module covers SPF calibration, answering questions such as:
If the solid curve in the images below represents the SPF, and the individual points represent your local data, do you know which scenario would be most conducive to calibration? If not, complete Module 2 to learn more, including how to calibrate SPFs and determine if the calibration is satisfactory. This module features an Excel-based tool, The Calibrator (see related story on page 2), that will help you calibrate and assess the reliability of SPFs.
The third module covers SPF development, answering questions such as:
Do you know if you can use an SPF for total crashes to estimate the number of crashes by type or severity? Can you use the SPF for one facility type (e.g., rural, four-legged, signalized intersections) to estimate crashes on another facility type (e.g., urban, three-legged, stop-controlled intersections)? What about using the same SPF for network screening and safety effectiveness evaluation? Complete module 3 to learn more, including why the answers to these questions are "yes," "no," and "maybe."
The final module covers the SPF decision process, answering the following question:
Do you know what it would take in terms of time and resources to calibrate or develop an SPF? Complete Module 4 to learn how to compare these options in terms of reliability and the typical required resources as shown in the following table.
| Intended Use | Process | Sample Needed | Staff Hours per SPF | |
|---|---|---|---|---|
| Data Collection and Preparation | Statistical Analysis | |||
| Network screening | Calibrate | Must use entire network to be screened. No minimum sample specified. | 24 to 40 | n/a |
| Network screening | Develop | Must use entire network to be screened. Minimum sample 100-200 intersections or 100-200 miles; at least 300 crashes per year for total group. | 24 to 40 | 8 to 24 |
| Design decisions | Calibrate | 30-50 sites; at least 100 crashes per year for total group. | 150 to 350 | n/a |
| Design decisions | Develop | 100-200 intersections or 100-200 miles; at least 300 crashes per year for total group. | 450 to 1050 | 16 to 40 |
Throughout the modules, you will learn about several related resources, including guides, software, and websites. Primary resources include the SPF Calibration Guide, The Calibrator, the SPF Decision Guide, and the SPF Development Guide.
Given the nature of roadway safety management decisions, and the value of information from SPFs, we hope that you will complete this one-hour training to enhance your knowledge and understanding of SPFs. The video will help you identify opportunities to use SPFs throughout the roadway safety management process, hopefully improving decisions and more effectively reducing fatalities and serious injuries on all public roads.
For more information, training, and technical assistance on SPFs, you can:
By: Esther Strawder, FHWA Office of Safety
The Accelerating Safety Activities Program (ASAP) specifically supports the goal of promoting safety innovation through training, outreach, and education focusing on roadway departure, intersection, pedestrian, and bicycle safety. The program also promotes partnerships between the FHWA, State and local transportation agencies, and Local and Tribal Technical Assistance Programs. Currently, ASAP funding is limited to the 23 States that are eligible to participate in the Focused Approach to Safety.
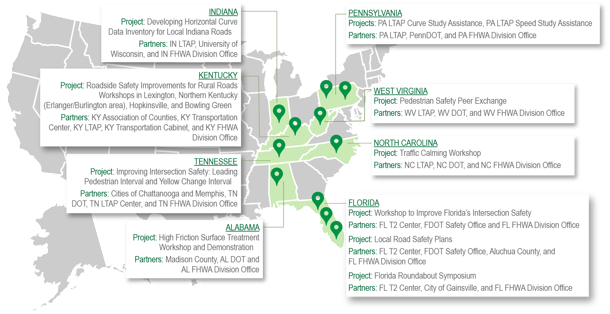
The Office of Safety awarded ASAP funding in the amount of $164,103 to 11 projects from 8 States for FY 2018. FHWA received a total of 13 proposals, which were evaluated by a technical panel and ranked based on their merit. The recipient States also contributed at least 20 percent of their own funds, bringing the total investmentor the projects up to $244,248. This is the twelfth consecutive year in which ASAP is assisting States with implementing innovations in safety.
An announcement for the FY 2019 round of ASAP will be sent out in February. For more information on the ASAP program, please contact Esther Strawder at esther.strawder@dot.gov.
By: Cate Satterfield and Becky Crowe, FHWA Office of Safety
According to national traffic data from the U.S. Department of Transportation, severe and fatal crashes are on the rise across the country, increasing 5.6 percent from 2015 to 2016.
Two crash types in particular pose a significant challenge – those resulting from roadway lane departures and pedestrian-involved incidents. In fact, these two crash types combined account for more than 65 percent of roadway fatalities nationwide.
To help reduce these crashes, the fifth round of the FHWA Every Day Counts (EDC-5) program includes innovations dedicated to helping State and local agencies address these crash types.
The Reducing Rural Roadway Departures innovation is new for EDC-5 and the Safe Transportation for Every Pedestrian (STEP) effort was so successful in EDC-4 that it was selected to continue in round 5. The deployment teams that support these innovations will spend the next 2 years promoting proven safety countermeasures and best practices to help reduce these crash types through technical assistance, outreach, training, and more.
In 2016, 18,590 lives were lost on rural roads—more than half of all traffic deaths—even though only 19 percent of the U.S. population lived in rural areas. However, substantial safety improvements can be difficult to make because of the sheer size of the rural road network. There are almost three million miles of rural roadway in America, accounting for approximately 70 percent of public road mileage. That network is most often operated by local agencies with limited resources in safety analysis or planning.
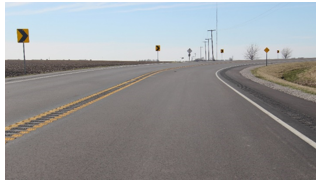
Two-thirds of all rural roadway fatalities involve a roadway departure, where a vehicle crosses a center line, an edge line, or leaves the traveled way where there are no pavement markings. But with so many miles of rural roadways, it can be difficult to select the locations where applying roadway departure countermeasures will do the most good.
The Reducing Rural Roadway Departures innovation includes multiple analysis, diagnostic, and countermeasure selection tools that can help agencies identify areas on their network that are at highest risk for rural roadway departures. Practitioners can then systemically apply safety treatments that mitigate these crashes and are in sync with their State's Strategic Highway Safety Plan (SHSP).
For example, no agency can afford to widen or pave shoulders on its entire roadway network, but a rural district of a State department of transportation (DOT) may find that widening shoulders at the highest risk curves results in an extremely high benefit-cost ratio. Edge lines have shown crash reductions on roads with traffic volumes as low as 400 vehicles per day, but a rural County may only be able to maintain edge lines on a small portion of its roads. In this case, the agency can still expect to see improved safety if edge lines are systemically applied to areas of high risk for roadway departure.
Roadway departure countermeasures that can be applied systemically include:
This initiative seeks to help rural districts in State DOTs as well as regional planning organizations and rural local agencies to analyze which countermeasures will be most effective in improving the safety of their roadways, where to apply those countermeasures, and how to apply them effectively.
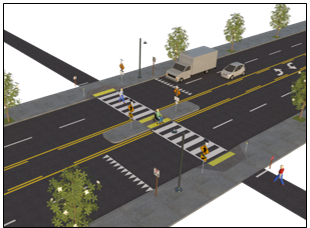
In 2016, the Nation witnessed the most pedestrian fatalities since 1990, with pedestrians accounting for approximately 16 percent of all roadway fatalities (5,987). The vast majority of these deaths (72 percent) occurred while people crossed a roadway at mid-block (or other locations away from intersections), while 18 percent of these fatalities occurred at intersections.
By focusing on both urban and rural pedestrian crossing locations, agencies can comprehensively address a significant national safety problem and improve the quality of life for pedestrians of all ages and abilities. The STEP innovation deployment team will promote and help agencies implement the following cost-effective countermeasures. These countermeasures can also be applied using a systemic approach to reduce these crashes and bring measured safety benefits at uncontrolled and signalized pedestrian crossing locations.
For more information about the Reducing Rural Roadway Departures innovation, please contact Cate Satterfield at cathy.satterfield@dot.gov. For more information about the STEP innovation, please contact Becky Crowe at rebecca.crowe@dot.gov. To learn about the full series of EDC-5 innovations, please visit the EDC-5 web page.
By: Becky Crowe, FHWA Office of Safety
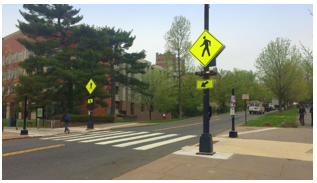
Transportation and safety professionals now have access to updated guidance to improve pedestrian safety at uncontrolled crossings. FHWA recently updated the Guide for Improving Pedestrian Safety at Uncontrolled Crossing Locations and posted additional resources through the Safe Transportation for Every Pedestrian (STEP) program. The newest resources include guidance for considering the Rectangular Rapid-Flashing Beacon (RRFB), since FHWA issued a new Interim Approval (IA-21) for the device in March 2018. Research has shown that the RRFB can increase instances of motorists yielding to pedestrians at marked crosswalks by rates as high as 98 percent, and may reduce pedestrian crashes by 47 percent.
Transportation planners and designers began consulting the FHWA Guide for Improving Pedestrian Safety at Uncontrolled Crossing Locations when it was first released in January 2018. The Guide is a tool for selecting countermeasure options based on roadway conditions and noted safety issues, and it is an important supplement to previous pedestrian safety research. The updated version incorporates the RRFB into tables that assist with countermeasure selection and text that further explains special considerations for installation. The Guide explains that State and local agencies must request and receive permission from FHWA, through IA-21, before installing the RRFB.
The Guide for Improving Pedestrian Safety at Uncontrolled Crossing Locations also clarifies the conditions where certain countermeasures (such as high-visibility crosswalk markings) should be installed in conjunction with other pedestrian safety improvements. For example, at multi-lane roadway crossings with high traffic volumes (i.e., >10,000), a marked crosswalk is supplemented with more substantial improvements like a PHB or pedestrian refuge island to improve pedestrian safety.
In addition to updates to the Guide, the STEP "tech sheets" now include the RRFB. These tech sheets, which also describe considerations for installing crosswalk visibility enhancements, pedestrian refuge islands, raised crosswalks, and Road Diets, provide information to transportation planners, traffic safety engineers, and other decisionmakers about the safety benefits and design considerations for the STEP countermeasures. Each tech sheet is a two-page, full-color summary that includes example illustrations, cost estimates, and safety statistics.
FHWA has also prepared a series of case studies and videos to describe how the STEP counterÂmeasures have been installed nationwide. The case studies highlight policies and installation examples by 10 local and State agencies. For example, one case study describes the safety benefits noted from Pedestrian Hybrid Beacons (PHBs) installed in Tampa, Florida. The five videos illustrate the importance of installing countermeasures, such as raised crosswalks and Road Diets, along roadways with uncontrolled crossing locations. The videos showcase local experts and community champions involved in improving pedestrian safety.
In addition, FHWA is releasing new complementary guidance for when and where to consider marking crosswalks—a decision that is the foundation for installing other countermeasures. This guidance emphasizes the role that crosswalks play in completing pedestrian networks, establishing visible crossings, and supporting other pedestrian crossing improvements. The document also corrects crosswalk marking "myths" and helps transportation and safety professionals plan for, design, and improve crosswalks.
For more information, visit the FHWA Office of Safety's STEP web page or contact Becky Crowe at rebecca.crowe@dot.gov.
By: Karen Timpone, FHWA Office of Safety, and Mafruhatul Jannat, Stephanie Roldan, and Stacy Balk, Leidos
Incidents involving pedestrians and bicyclists comprise a large proportion of traffic fatalities. In 2016, pedestrian and bicyclist fatalities accounted for 18 percent of total traffic fatalities with nearly 7000 deaths occurring that year. Based on the data available to us, we know that dangerous vehicle-pedestrian conflicts tend to occur more frequently under conditions in which the pedestrian is difficult to detect, such as in crowded urban settings and under low visibility.
One possible means of mitigating the risk associated with these conflicts is the use of external sensors and communication devices capable of detecting and communicating the presence of at-risk pedestrians or bicyclists to vehicles and drivers. The recent surge of connected vehicle technology has led to the development of vehicle-to-pedestrian (V2P) systems that show great potential for improving the safety of vulnerable road users through augmented sensors and communications. These systems take many forms and include a variety of methods such as radar and LIDAR sensors, optical cameras, and direct wireless communications.
In an attempt to leverage this proliferation of new technologies to improve pedestrian safety, FHWA initiated a project to conceptualize the first phase of a two-phase effort: to identify V2P systems currently available on the consumer market and to assess their capabilities with a focus on real-world implementation. Now that phase one is completed, a V2P test bed at Turner-Fairbank Highway Research Center (TFHRC) is under development to execute phase two; the expected completion date for this next phase is early 2019.
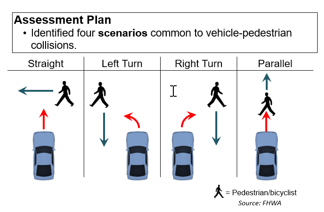
Pedestrian incident reports indicate that pedestrian and bicyclist incidents frequently occur in one of four scenarios: pedestrian making a perpendicular crossing as the vehicle travels straight, turns left, or turns right, and pedestrian traveling adjacent to the vehicle (as in the case of bicyclists passing along the side of the vehicle). These test cases were included in the assessment plan to evaluate system safety effectiveness.
As part of phase one, the study team performed a technology scan to identify all known V2P technologies, resulting in a detailed database of a wide variety of systems. The technology scan revealed that, out of 80 V2P products identified, very few were market-ready and accessible to the public. Based on the common features of available products, a general assessment plan was developed to target key system functionalities, including accuracy and reliability of detection, user interface, and response selection following detection. Factors related to user accessibility such as market readiness and institutional and infrastructure requirements were also included in the assessment plan, as these components were thought to be essential for achieving potential safety benefits.
The study team decided that each of the three to five systems to be evaluated would be tested in multiple trials over a selection of various speeds, with specific measurements tailored to each system's functionality. Systems eligible for testing would be required to perform in at least one of the four defined test case scenarios, provide some measurable communication output delivered to the driver/vehicle or pedestrian/bicyclist, and function within the environment provided. Using these criteria, and due to funding restrictions, a single V2P system was selected and procured for testing at TFHRC to develop an assessment approach and determine the capabilities of the test bed. Preliminary results will be presented that support the feasibility of the assessment approach and reveal several limitations of current V2P technology; for example, known situations in which V2P technologies are non-functional will include low-light or nighttime conditions, periods of low visibility (e.g., fog), when vehicles are traveling more than 31 mph, or when cameras are in direct sunlight. Three more market-ready V2P systems have been identified and will be tested using this assessment approach to evaluate their safety effectiveness. FHWA anticipates that using the new test bed to assess multiple systems will be helpful in identifying the strengths and weaknesses of existing V2P technologies and may be used to guide the development of future V2P systems that maximize road user safety.
By: Guan Xu, FHWA Office of Safety
Per vehicle miles traveled in 2016, motorcyclist fatalities occurred nearly 28 times more frequently than passenger car occupant fatalities in traffic crashes.
Source: NHTSA, Traffic Safety Facts, 2016 Data: Motorcycles. DOT HS 812 492. February 2018.Over the last 20 years, the number of motorcycle-related fatalities has increased significantly, from 2,116 in 1997 to 4,576 in 2005 and rising to 5,286 in 2016, an overall increase of 250 percent. To address this safety issue, Congress, through Section 1426 of the Federal Advisory Committee Act (FACA), authorized the Secretary of Transportation to establish a Motorcyclist Advisory Council (MAC) to provide advice and make recommendations concerning infrastructure issues related to motorcyclist safety including barrier design; road design, construction, and maintenance practices; and the architecture and implementation of intelligent transportation system technologies. The MAC is administered through FHWA.
Following the requirements provided in FACA and with the approval of the Secretary, the MAC Charter was created, and a 10-member MAC was established on July 28, 2017. Since then, MAC has held two meetings, both of which were announced in advance in the Federal Register and were open to the public. The most recent MAC meeting was held on Thursday, June 7, 2018 via web conferencing, and a total of 36 people attended the meeting, including 10 MAC members.
During the 4-hour meeting, the attendees first heard three presentations that delivered information covering the latest research on infrastructure-based motorcycle crash countermeasures, an investigation of roadside barrier concepts to mitigate motorcycle injuries to riders who are vertical upon impact, and the results of a review of State Strategic Highway Safety Plans that outlined actions that States are planning to improve motorcycle safety. Following each of these presentations, MAC members and other attendees discussed the information presented and exchanged ideas for actions MAC members should research for follow up. MAC members also discussed goals and next steps as to how the MAC would proceed with developing final recommendations on infrastructure-based safety solutions to USDOT. Meeting minutes with detailed information from this second MAC meeting will be posted on the FHWA MAC webpage.
Members tentatively agreed to hold the third MAC meeting, which will be held in-person in approximately 6 months, likely in December 2018, in the Washington, DC area. An announcement for the meeting will be posted in the Federal Register around mid-November 2018.
For more information about the MAC or its activities, please contact Guan Xu at guan.xu@dot.gov.
By: Wayne R. Emington P.E., FHWA Maine Division
In 2010, MaineDOT published the I-295 Corridor Study to evaluate the long-term needs of the I-295 corridor between Scarborough and Brunswick and make recommendations for safe and reliable transportation. Eight years later, prompted by increases in crashes, decreases in reliability, and the availability of new transportation technologies, MaineDOT has updated this study. The update is a technical analysis of I-295 between Scarborough and Brunswick focused on improving safety and reliability with short-term, mid-term, and long-term recommendations. As a part of the update, a broad range of strategies to manage speed, harmonize traffic flow, and improve safety at merge areas were analyzed, including variable speed limits, ramp metering, and part-time shoulder use.
The research conducted as part of the updated I-295 Corridor Study focused on examining new congestion-mitigating mechanisms and proven speed management approaches and technologies now available to assist State DOTs in establishing safe speeds, because effective speed management programs have a direct link to reduced crashes on higher speed facilities. In reviewing FHWA's Guidelines for the Use of Variable Speed Limit Systems in Wet Weather, and FHWA's Synthesis of Variable Speed Limit Signs, MaineDOT recognized that the use of VSL has potential safety and reliability benefits. The agency also realized that VSL systems have been deployed widely in the United States (for congestion-based active traffic management, work zones, and in response to severe weather events). In reviewing FHWA's Ramp Metering Website and Guide for Planning, Evaluating, and Designing Part-Time Shoulder Use as a Traffic Management Strategy, MaineDOT realized that ramp metering and part-time shoulder use have reliability and safety benefits as well.
| Strategies | Characteristics | Safety Improvements |
|---|---|---|
| Auxiliary Lanes |
|
|
| Intelligent Transportation Systems (ITS) |
|
|
| Interchange Improvement |
|
|
Although MaineDOT discovered several innovations and approaches during the research phase, the agency determined that it needed to learn more from its peers before including specific recommendations in the update to the I-295 study. As a result, the agency reached out to the Maine FHWA Division Office for technical assistance. MaineDOT was interested in understanding the lessons other State DOT's had learned from their deployments. Working with the local FHWA Safety & Operations Engineer, MaineDOT successfully pursued three separate avenues of technical assistance:
The results of the technical assistance have proven valuable as MaineDOT seeks to improve safety on the I-295 corridor. Some of the lessons learned from this experience include the following:
Potential synergies exist when deploying both VSL and Part-Time Shoulder Use systems together, and additional research on that topic may be beneficial.
The June 2018 update to the I-295 Corridor Study includes short-term, mid-term, and long-term recommendations. The next step for MaineDOT is to finish drafting a larger scope (statewide) ITS strategic plan. After learning about the important role such a guiding document can play in VSL and ATDM deployment, and after seeing examples from peer agencies, MaineDOT is aiming to complete this plan in October 2018.
In addition, now having a better understanding of how VSL can fit into a State's transportation systems management and operations (TSM&O) efforts, MaineDOT is also considering developing a TSM&O strategic plan to complement the ITS strategic plan. Through the STIC project, MaineDOT will develop standard operating procedures, technical guidance, decision matrices, a public outreach plan, and/or an implementation plan for the use of VSL and other ATDM strategies as needed throughout 2018 and 2019.
Finally, the FHWA Maine Division worked with FHWA to bring a workshop on part-time shoulder use and ramp metering to Maine on July 18, 2018. A peer exchange follow up webinar will be held in fall 2018.
For more information about MaineDOT's experience and future directions, please contact Wayne Emington at wayne.emington@dot.gov.
By: Hillary Isebrands, FHWA Resource Center – Safety and Design Technical Services Team, and Jerry Roche, FHWA Office of Safety
People hear the words "Local Road Safety Plan," and they start to think that it needs to include rigorous analysis, have lots of pages, take a lot of time, or that they need a consultant to write it. But the truth is, LRSPs are scalable and, often, starting with plan as short as 10 or 15 pages that can be enhanced over time is the best way to gain experience and perspective.
To address local agency concerns about how much time, effort, and cost may be involved in developing an LRSP, the FHWA Data Driven Safety Analysis (DDSA) Team developed an LRSP video to give a brief overview of why LRSPs can be important and to explain how easy the four-step process is.
The simple video, which runs just under 2.5 minutes, explains that all an agency needs to get started is a small group of stakeholders—from law enforcement, EMS, public health and elected officials, for example. And an agency doesn't need comprehensive data to create an effective plan, either. Data sources can include crash data, maintenance logs, details of safety audits, and even traffic violations. Then, the stakeholder team selects proven, low-cost countermeasures to address these locations—for example, placing chevrons at a subset of an agency's curves or a installing a leading pedestrian interval at certain signalized intersections. Finally, the solutions are implemented to reduce crashes and fatalities on local roads. One way this has been accomplished is by bundling the application of multiple countermeasures into one project, even including locations within multiple agencies. And, local agencies don't need to wait to develop improvement projects; many strategies can be undertaken by maintenance and enforcement partners in short order.
FHWA developed the video in partnership with the National Association of County Engineers (NACE) and the National Local Technical Assistance Program Association. Both groups provided feedback on the video and are using it to promote safety within their own programs and initiatives. In fact, as part of the Every Day Counts Round 4 initiative, the DDSA team partnered with NACE on a pilot project to help 25 counties in California, Colorado, Florida, Nevada, Ohio, and Wisconsin develop LRSPs (see related story in the spring 2018 issue of Safety Compass). The video was developed with the first group of NACE pilot counties in mind, and was debuted with them to determine whether it was effective. At present, the DDSA team is identifying States and corresponding counties for a second round of the pilot as well.
For more information on the Local Road Safety Plan initiative, or to find out more about how to develop an LRSP for your community, contact Jerry Roche at jerry.roche@dot.gov.
By: Chimai Ngo, FHWA Office of Safety
 As an increasing number of local and regional transportation agencies across the country are committing to the vision of eliminating traffic fatalities and serious injuries on their roadways, many local agencies and metropolitan planning organizations (MPOs) are developing and implementing their own transportation safety plans. To assist these and the many others that are considering adopting the same vision, FHWA is pleased to share a new resource, Transportation Safety Planning and the Zero Deaths Vision: A Guide for Metropolitan Planning Organizations and Local Communities, which will be available in September on the Transportation Safety Planning web page.
This Guide is designed to assist MPOs, local communities, and stakeholders in using the safety planning process to work toward the zero deaths vision. It provides a step-by-step process to develop, implement, and evaluate a regional or local safety plan and highlights noteworthy practices. The Guide also presents safety considerations necessary in the safety planning process in order to reach the zero deaths goal. In addition, it offers suggestions on how safety practitioners can engage in safety planning efforts, analyze data, set goals and targets to facilitate performance-based planning, identify strategies to address safety challenges, prepare a document that presents the plan, and evaluate the effectiveness of the plan.
The most important lesson in the Guide, however, is that together, we can save lives!
For more information on how Transportation Safety Planning can help your locality or MPO reduce traffic fatalities, please contact Chimai Ngo at chimai.ngo@dot.gov.
By: Danielle Betkey, FHWA Office of Safety
Let's imagine for a moment that you are a law enforcement officer on the scene of a single vehicle crash. You observe that the driver of the vehicle has a head wound that is bleeding profusely. As you complete the crash report, you suspect that the driver's injuries are serious and document accordingly. However, after emergency medical services personnel evaluate the driver, the head wound turns out to just be a minor cut. Some wounds, particularly head wounds, tend to bleed more, but that does not necessarily mean it is a serious injury. So how do you classify this injury? And why does assessing the severity of an injury—and accurately and consistently reporting it—matter?
Transportation safety professionals, law enforcement, and healthcare practitioners use crash data to help identify and solve critical highway safety issues. An estimated 2.5 million people are injured in motor vehicle crashes on our Nation's roadways every year. Traffic injuries represent a significant loss to individuals and society. However, many States report serious injuries using different coding conventions and definitions. For example, one State might classify any individual who is transported to a hospital as having a suspected serious injury (regardless of the type of injury sustained), while another State might classify an injury as a suspected serious injury only if an individual is transported to a trauma center. Therefore, due to this inconsistent reporting, the Nation's serious injury trends are challenging to compare and analyze.
But that is all about to change. In response to the need to improve serious injury reporting, the FHWA and NHTSA established a single, national definition for reporting serious injuries. The definition will aid in aligning injury classification systems and injury coding nationwide for reporting and analysis. The definition is codified in FHWA's Safety Performance Management Measures Final Rule (23 CFR 490) and NHTSA's Uniform Procedures for State Highway Safety Grants Program Interim Final Rule (23 CFR 1300). These Final Rules require that serious injuries be reported using the Model Minimum Uniform Crash Criteria (MMUCC) 4th Edition definition and attribute for "Suspected Serious Injury (A)" as defined in the "P5. Injury Status" person data element. While States are required to comply with this regulation beginning April 15, 2019, it is recommended that they adopt the new definition by January 1, 2019, to have a complete and consistent crash data file for the entire 2019 calendar year.
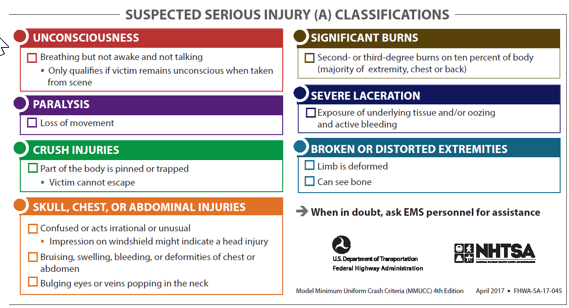
So, thinking back to the single vehicle crash scenario, how would a law enforcement officer know whether an injury was serious or not when completing the crash report? The officer could ask an emergency medical professional and/or refer to the MMUCC definition that defines a "Suspected Serious Injury (A)" as any injury other than fatal which results in one or more of the following:
Crash reports are the main source of injury data that can be linked directly to the crash scene, so accurate and consistent injury classification on the crash report is important. What does the serious injury reporting requirement mean for States? To be considered compliant with the regulation, each State must ensure the following requirements are met:
The statewide crash database accurately aggregates the MMUCC 4th Edition injury status attribute for "Suspected Serious Injury (A)";
- The State crash database, crash data dictionary, and crash report user manual employs the terminology and definitions for the MMUCC 4th
- Edition injury status attribute for "Suspected Serious Injury (A)";
- The police crash report employs the MMUCC 4th Edition injury status attribute for "Suspected Serious Injury (A)"; and
- The seven serious injury types specified in the injury status attribute for "Suspected Serious Injury (A)" are not included in any of the other attributes listed in the States' injury status data elements.
The adoption of the "Suspected Serious Injury (A)" definition and attribute by April 15, 2019, will greatly improve the accuracy of serious injury reporting nationwide. It will help safety professionals to better assess highway safety issues and determine effective strategies and countermeasures to reduce such injuries in the future and save lives. Safety is the top priority at FHWA and NTHSA, and this new requirement will help move us one step closer to the goal of reducing traffic injuries and fatalities on our Nation's roadways.
State personnel should keep in mind that many stakeholders need to be involved to achieve compliance with the new serious injury reporting requirement, some of which include the State department of transportation (DOT), State highway safety office, and law enforcement agencies—all of which play a key role. Additional stakeholders may also include traffic records coordinating committee members and State DOT administrators.
FHWA and NHTSA developed several resources to help States and law enforcement understand the new serious injury definition. These resources include the following:
For more information on the new definition for serious injuries, please contact Danielle Betkey at danielle.betkey@dot.gov.
By: Joseph Cheung P.E., FHWA Office of Safety
The advent of light-emitting diode (LED) has initiated a major transition in the way agencies are approaching and using roadway lighting. LEDs offer the potential for savings in energy and maintenance costs, improved visibility, and easier control of lighting intensity. However, along with these potential advantages, questions have also arisen about the possibility of increased glare, light pollution, and impacts on human circadian rhythms.
In recent years, many transportation agencies have begun to experience a lack of "in-house" expertise about lighting design due to retirements or personnel reassignments. To address this knowledge gap, and to help answer agency questions about how and when to use new lighting technologies such as LEDs, FHWA developed a new training course entitled "Web-based FHWA Roadway Lighting Workshop," which is now available as a web-based, on-demand training program. The course is based on a combination of guidance from the Roadway Lighting Handbook as well as a series of workshops held around the country and other, more recent technical advancements on roadway lighting design.
FHWA is now offering no-cost, web-based training to help practitioners get a refresher on the basics of nighttime lighting concepts and to learn about the latest technologies for safely and effectively lighting roadways at night.
Other topics include basic terminology, practices for determining whether and how lighting should be installed and controlled, measurement issues, and more.
The course is divided into four modules to enable practitioners to view each module in convenient one-hour periods:

Individuals who complete this course will gain a greater understanding of the basics of roadway lighting, its potential benefits, and how decisions are made regarding its installation. They will also learn about the technology and hardware used in roadway lighting and adaptive control systems and be able to take into consideration the criteria and calculations that underlie roadway lighting design and measurement. They will be equipped to address special situations, like the level and type of lighting needed for crosswalks and roundabouts and how to address visual perception issues and light pollution. They will also gain insight into the possible impacts of lighting on human circadian rhythms.
The primary intended audience for this training includes traffic safety engineers from transportation agencies whose responsibilities include making design decisions about roadways and roadway safety systems, those who work with the public and communicate about agency decisions regarding roadway lighting, and lighting contractors for the design and specification of roadway lighting systems. The initial module may also be of interest to the general public wishing to learn more about roadway lighting.
This web-based training is openly available free of charge. We urge you to take the "Web-based FHWA Roadway Lighting Workshop" to improve your understanding of the many important elements that should be taken into account when designing, installing, and maintaining roadway lighting. For more information about this course or FHWA's Nighttime Visibility initiative, please contact Joseph Cheung at joseph.cheung@dot.gov.
By: Jerry Roche, FHWA Office of Safety, and Betsey Tramonte, FHWA Louisiana Division
Over the last few years, many States have increased their use of tools to quantify the safety impacts of project investment decisions, which is the primary concept behind FHWA's Data-Driven Safety Analysis (DDSA) initiative—promoted as an Every Day Counts Round 4 (EDC-4) innovation. The mission of the DDSA Initiative is to integrate safety performance into all highway investment decisions with the ultimate goal of reducing fatal and serious injury crashes. To share these noteworthy advances, FHWA and the Highway Safety Manual (HSM) Implementation Pooled Fund hosted a large peer exchange entitled "DDSA Applications in Performance-Based Project Development" in Dallas, TX July 10-12, 2018.
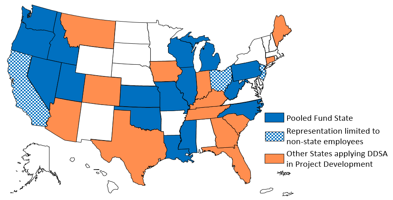
More than 150 attendees from 31 States participated, with representation from a range of project development disciplines, including planning and programming, environment, design, traffic operations, and safety. FHWA invited States to attend based on two factors: their membership in the HSM Pooled fund and their notable activities in implementing DDSA in their State's project development process. The two major objectives of the peer exchange were 1) to share leading practices in the use of DDSA throughout project development and 2) to develop a roadmap to guide States' future DDSA activities as the EDC-4 period concludes in December 2018.
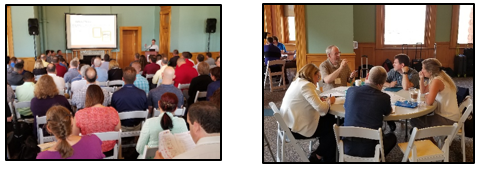
The structure of the peer exchange included plenary sessions for topics of interest to the entire audience as well as more-detailed breakout sessions tailored to specific disciplines. Demonstrations of five safety analysis tools were also conducted in a round-robin format.Â
Session topics included:
After hearing brief presentations from State DOTs in the breakout sessions, attendees participated in facilitated discussions, which helped them identify noteworthy practices and opportunities within their organizations as well as possible challenges and steps needed for implementation. This breakout session format set the stage for a road-mapping exercise in which participants from each State met as a group to discuss and develop their individual State roadmaps. These plans reflected current DDSA activities as well as documented next steps to further the implementation of DDSA within the phases of the project development process. State representatives will share a copy of their plans with the DDSA team in order to identify any remaining needs that would help States progress in implementation.
The complete evaluations from the peer exchange are still being tabulated, but when asked if the peer exchange was something the attendee would recommend to a peer, a significant number of attendees said they would. A few highlights noted by participants include very knowledgeable presenters, the diversity of professionals, State examples of successful projects and programs, the variety of viewpoints from States, and the energy of the group. A final report documenting the peer exchange will be available in the coming months.
By: Adam Larsen, Federal Lands Highways
When properly analyzed and displayed, safety data can help improve the effectiveness of transportation decision making, grant applications, and safety programs. To help Tribal employees gain the skills and knowledge needed to process transportation safety data, FHWA is hosting a series of training sessions.
Safety data can be analyzed using various methods depending on what the analyst is trying to accomplish. This web series introduces several concepts and ends with an opportunity for Tribes to meet one-on-one with FHWA staff at the National Transportation in Indian Country Conference to discuss specific applications.
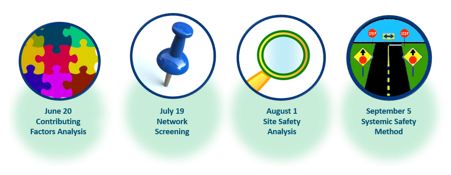
The free training sessions focus on four topics:
The series launched on June 20, 2018. If you would like to attend the September 5 session, please visit our registration page.
Congratulations to the Office of Safety's Kelly Morton, the recipient of the Spike Award for Federal Railroad Administration (FRA) Highway Grade Crossing Technical Leadership class! After attending and participating in the class, students voted Kelly as the participant who best contributed to the course. "Kelly's presentation on Section 130 Program Overview and her thorough responses to questions during the class helped create an exceptional learning environment," said Alisa Paton, the course instructor. Alisa works for FRA's Technical Training Standards Division (TTSD) which is led by Staff Director, Pat McFall.
The TTSD Spike is awarded based on classmates' and instructor's observations, and is determined by class vote.
Way to go, Kelly!

In 2016, the National Working Summit on Transportation in Rural America helped define the future for moving rural America forward by articulating the key transportation safety issues facing these areas. The summit culminated in a call to address rural roadway safety as an integral element of the Road to Zero initiative. The theme for the second summit, which will be held in Savannah, Georgia, in December 2018, is "Bridge the Gap." Attendees will continue to identify ways to move the rural conversation forward, focusing on identifying safety solutions and addressing such questions as:
To join this conversation, register today!
FHWA is very pleased to announce the establishment of a new Interactive Highway Safety Design Model (IHSDM) User Group, which has been established to:
A recorded User Group kick-off meeting (web conference) was held on Wednesday August 15, 2018, and the slideshow presentation is now available. For more information on IHSDM, please contact Abdul Zineddin at abdul.zineddin@dot.gov.
This July, the U.S. Department of Transportation's (DOT) Federal Transit Administration (FTA) issued two final regulations to strengthen the safety of public transportation systems, the Public Transportation Agency Safety Plan rule and the Safety Certification Training Program rule. With these actions, FTA has completed the regulatory framework for the National Public Transportation Safety Program as authorized by Congress.
The Public Transportation Agency Safety Plan rule requires transit agencies to incorporate Safety Management System (SMS) policies and procedures as they develop safety plans to better manage their safety risks. SMS is a comprehensive and collaborative approach to safety—one that many transit agencies have not previously used. The safety plan rule takes effect on July 19, 2019, and compliance with the rule is required within 1 year of that date. In the coming months, FTA anticipates making guidance available to transit agencies that will assist in their development of safety plans and implementation of SMS. The FTA is deferring action on applicability of the rule for small and/or rural transit systems in order to evaluate the safety risks posed by these systems and to determine the need for future regulatory action.
The requirements of the Public Transportation Safety Training Certification Program rule establish a basic training curriculum to enhance the technical competencies and capabilities of individuals responsible for the safety oversight of rail transit systems. The rule takes effect on August 20, 2018. The publication of this final rule reduces the burden to the transit industry from the interim training requirements by eliminating a course requirement and allowing for equivalency training credit.
For more information, visit the FTA's Transit Safety & Oversight (TSO) web page.
is a publication of the U.S. Department of Transportation, Federal Highway Administration.
The Federal Highway Administration publishes the Safety Compass newsletter three times a year. We can be reached at:
FHWA Office of Safety
1200 New Jersey Ave. SE
Room E71-320
Washington, DC 20590
The Safety Compass is available online at the FHWA Office of Safety web site at: https://safety.fhwa.dot.gov/newsletter/safetycompass/.
We welcome your comments and highway safety-related articles. The purpose of this newsletter is to increase highway safety awareness and information and to provide resources to help save lives.
We encourage readers to submit highway safety articles that might be of value to the highway safety community. Send your comments, questions and articles for review electronically to Tara McLoughlin at: tara.mcloughlin@dot.gov

