U.S. Department of Transportation
Federal Highway Administration
1200 New Jersey Avenue, SE
Washington, DC 20590
202-366-4000
| < Previous | Table of Content | Next > |
This chapter provides tools including bus stop audit checklists, pedestrian catchment area facility inventories, pedestrian questionnaires, pedestrian behavior observation surveys, and pedestrian crash analyses to help agencies identify specific pedestrian safety issues that affect their customers.
While the tools in this chapter are presented for use by transit agencies, they can also be beneficial for other transit agency partners, such as:
Bus stop checklists are commonly used to inventory bus stops and roadway characteristics in the area immediately surrounding a stop. They can be used by transit agencies to evaluate their own facilities or by local residents to assess conditions at bus stops. These checklists typically document:
Example bus stop checklists are provided in the Easter Seals Project ACTION Toolkit for the Assessment of Bus Stop Accessibility and Safety1 (excerpt included on the following page), Queensland Transport’s Pedestrian Safety and Accessibility Audit Tools,2 and Pedestrian and Transit Friendly Design: A Primer for Smart Growth.3
| Route Name: |
Location: |
Weather Conditions: |
Stop No.: |
|
| PART B: Landing Area Assessment | ||||
|---|---|---|---|---|
| B1 | Is there a landing area at least 5 feet wide and 8 feet deep adjacent to the curb/street? | Yes No [ ] [ ] |
||
| B2 | Where is the landing area positioned in relation to the curb/street? | |||
| Below street level (low ground or shoulder) [ ] |
Shoulder [ ] | Other (specify): [ ] |
||
| Adjacent [ ] | ||||
| Sidewalk [ ] | Bus Bulb [ ] | Off-Road/No sidewalk [ ] | ||
| B3 | What is the material of the landing area? | |||
| Asphalt [ ] | Dirt [ ] | Gravel [ ] | Other (specify): [ ] |
|
| Concrete [ ] | Grass [ ] | Pavers [ ] | ||
| B4 | Are there problems with the landing area surface? | Yes No [ ] [ ] |
||
| If YES, rank resulting accessibility potential: | ||||
| Not Accessible | Minimally Accessible | Accessible | ||
| Uneven | [ ] | [ ] | [ ] | |
| Slopes up from the street | [ ] | [ ] | [ ] | |
| Slopes down from the street | [ ] | [ ] | [ ] | |
| Requires stepping over drain inlet | [ ] | [ ] | [ ] | |
| Other (Specify) | [ ] | [ ] | [ ] | |
| B5 | Are there any obstacles that would limit the mobility of a wheelchair (trash receptacle, newspaper boxes, landscaping, other? | Yes No [ ] [ ] |
||
| If YES, describe obstruction: | ||||
Prompt lists are listings of potential issues that should be considered when conducting a road safety audit (RSA). An RSA is a formal safety examination of an existing or future roadway that is conducted by an independent, multidisciplinary team. “Independent” means that the RSA team should not include the roadway designer or current owner. The RSA team typically does not have authority to change a design that is being audited, however they can identify safety considerations and suggest measures (for the design team’s or responsible agency’s consideration) that can reasonably be implemented within the project schedule and available budget. There are several stages of a project where an RSA can be conducted, including: pre-construction (planning, preliminary design, final design); construction (work zone traffic control plan, pre-opening); and post-construction (including existing roads open to traffic).
The following table is an example prompt list for transit from the Federal Highway Administration’s (FHWA) Road Safety Audit Guidelines and Prompt Lists (FHWA-SA-07-007). This particular FHWA publication also contains detailed descriptions of the prompts to clarify potential issues for pedestrians at transit stops.
| Master Prompt | Detailed Prompt | RSA Stages | ||||
|---|---|---|---|---|---|---|
| planning | design | construction | post- construction |
|||
| D.1 Presence, Design, and Placement | D.1.1 | Are bus stops sited property? | √ | √ | √ | √ |
| D.1.2 | Are safe pedestrian crossing convenient for transit and school bus users | √ | √ | √ | √ | |
| D.1.3 | Is sight distance to bus stops adequate? | √ | √ | √ | √ | |
| D.1.4 | Are shelters appropriately designed and placed for pedestrian safety and convenience? | √ | √ | √ | √ | |
| D.2 Quality, Condition, and Obstructions | D.2.1 | Is the seating area at a safe and comfortable distance from vehicle and bicycle lanes? | √ | √ | √ | |
| D.2.2 | Do seats (or persons sitting on them) obstruct the sidewalk or reduce its usable width? | √ | √ | √ | ||
| D.2.3 | Is a sufficient landing area provided to accommodate waiting passengers, boarding/alighting passengers, and through/bypassing pedestrian traffic at peak times? | √ | √ | √ | ||
| D.2.4 | Is the landing area paved and free of problems such as uneven surfaces, standing water, or steep slopes? | √ | √ | √ | ||
| D.2.5 | Is the sidewalk free of temporary/permanent obstructions that constrict its width or block access to the bus stop? | √ | √ | √ | √ | |
| D.3 Continuity and Connectivity | D.3.1 | Is the nearest crossing opportunity free of potential hazards for pedestrians? | √ | √ | √ | √ |
| D.3.2 | Are transit stops part of a continuous network of pedestrian facilities? | √ | √ | √ | √ | |
| D.3.3 | Are transit stops maintained during periods of inclement weather? | √ | √ | √ | ||
| D.4 Lighting | D.4.1 | Are access ways to transit facilities well-lit to accommodate early-morning, late-afternoon, and evening | √ | √ | √ | √ |
| D.5 Visibility | D.5.1 | Are open sight lines maintained between approaching buses and passenger waiting and loading areas. | √ | √ | √ | √ |
| D.7 Traffic Characteristics | D.7.1 | Do pedestrians entering and leaving buses conflict with cars, bicycles, or other pedestrians? | √ | √ | √ | √ |
| D.8 Signs and Pavement Markings | D.8.1 | Are appropriate signs and pavement markings provided for school bus and transit stops | √ | √ | √ | √ |
In 2002, the Montgomery County Council established a Bus Stop Task Force and granted $11 million to improve bus stops over a six year period. The Bus Stop Improvement Program has three phases:
The first phase, collecting GPS locations for the transit stops, is complete. The needs assessment and improvement plan phase began in December 2004. A database was developed to manage assets, track improvements, and identify needs. Over one hundred pieces of data were gathered for each bus stop, including the quality of the landing pad, obstructions, speed and traffic characteristics of the road, bus site data, and pedestrian access and connection information. The database of bus stop characteristics/needs is tied to a photo inventory, which provides detailed images of each stop from several perspectives.
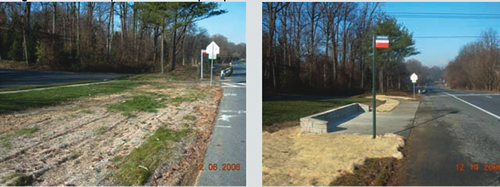
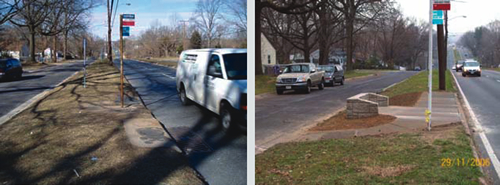
Montgomery County plans to improve over 2,000 of the 5,400 stops in the County. By the fall of 2007, 300 stops had been assessed in detail and 88 had been improved, with 39 percent of the improved stops receiving some type of physical engineering improvement. County traffic engineers are working with local transit providers to develop innovative approaches to improve rider safety at each bus stop. Improvements include providing amenities such as bus shelters, benches, advertising, trash cans, bus maps, and other amenities. The cost of the improvements is shared between the County and the State.
Contact: Jeff Dunckel, Manager - Passenger Facilities Unit at (240) 777-5826, Jeff.Dunckel@montgomerycountymd.gov.
A team from Genesee County, Michigan, consisting of representatives from the Mass Transportation Authority, the Genesee County Metropolitan Planning Commission, the Leaders for Action Transportation Coalition, and The Disability Network won an opportunity to attend the Easter Seals Project ACTION’s (ESPA) annual Mobility Planning Services Institute (MPS) in the spring of 2006. The different representatives brought a wide range of perspectives and experiences to the team that allowed them to work towards their common goal of improving transit service in and around the City of Flint.
The three-day MPS Institute enabled the group to develop a plan for improving accessible transit service in Genesee County that included increased fixed-route service, improved aesthetics at bus stops and compliance with all ADA requirements. In the months immediately following MPS Institute, team members continue to work together with local government and planning officials to implement their ideas. The first project is to inventory bus stop aesthetics, accessibility, and ADA compliance at over 100 stops using the Easter Seals Project ACTION Bus Stop Checklist. The database of information gathered during this process will be used to identify deficiencies and support applications for project funding. The team will continue using public meetings and email correspondence to foster community support for initiatives that improve accessibility for the working population, the elderly and passengers with disabilities in Genesee County.
Contact: Mae Golden, Housing/Transportation Advocate, The Disability Network, (810) 742-1800 X321, maeg@disnetwork.org.
Transit agencies can partner with local and state transportation agencies to inventory sidewalk and roadway crossing facilities in the entire catchment area surrounding a transit stop, not just in the immediate vicinity of the stop location. These inventories often take advantage of existing GIS and aerial photography data to reduce field labor time. For example, the Maryland Department of Transportation conducted a statewide inventory of sidewalks within ½-mile of all rail stations as a part of a program to comply with the Bike-Ped Total Access 2000 statute passed in 1995. As a result, many key gaps in the sidewalk network were identified and filled.
Those who regularly walk to and from bus stops or transit stations are often familiar with pedestrian safety issues along their routes and will typically share this information. To take advantage of this first-hand knowledge, transit agencies can distribute questionnaires to transit riders to gather feedback about pedestrian safety and access conditions at and around transit stops and stations. A variety of questionnaire formats can be used, including providing printed forms on buses; conducting in-person interviews at transit stops; and posting online surveys. Pedestrian questionnaires can also gather useful information about rider characteristics, such as transit use frequency, and walking distances to transit stops. Other information that can be collected by questionnaire includes:
As part of a pilot program in 2003 to learn more about pedestrian attitudes towards the walking environment, Queensland Transport in Australia developed and administered a pedestrian questionnaire and created a standard pedestrian behavior observation form. Pedestrian Safety and Accessibility Audit Tools. Queensland Transport, Queensland, Australia. 2006.
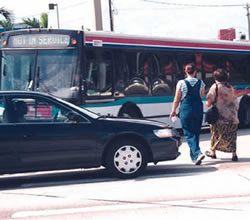
Transit agencies can gather useful information about pedestrian access to transit by observing pedestrian behavior near stops and stations. Observers can note activity, such as:
Transit agencies can use the results of these observations to improve transit stop locations, bus stop design, or service schedules. They can also provide information to schools and other organizations to develop targeted education messages, confer with local police on ideas for targeted enforcement of driver and pedestrian behaviors, and coordinate with local transportation engineers on improvements to crosswalks, sidewalks, warning signs, and pedestrian signals.
Observations of pedestrian behavior can also be used to highlight the importance of pedestrian-friendly improvements. Agencies can use these observations to help convey the experience of accessing the local transit system to transit agency staff, governmental agency staff, developers and politicians.
Washington State Department of Transportation has conducted several corridor and intersection evaluations using a standard pedestrian risk evaluation form developed as part of a key transit corridor study.6
 Transit agencies can work with local and state transportation and police departments to analyze pedestrian crash data near transit access points to help prioritize improvement areas. Caution should be exercised when using pedestrian crash data as it may not always accurately reflect safety conditions. Police-reported crash data do not typically capture all pedestrian crashes that occur. In addition, there may be few pedestrian crashes because pedestrians tend to avoid walking where they perceive conditions to be dangerous. It may also be difficult to identify patterns of pedestrian crashes for specific subgroups, such as elderly pedestrians, children, and people who have visual, auditory, or cognitive disabilities, since the overall number of pedestrian trips made by these groups may be small. To see clear trends, three to ten years of crash data may be needed. It is important to note that changes in land use and bus stop locations can affect geographic distribution of pedestrian crashes.
Once the transit agency has reviewed crash and other relevant data, staff should identify priority sites for safety improvements. Sites selected for improvements should be evaluated comprehensively so that an appropriate combination of pedestrian safety treatments can be applied.
Observations of pedestrian and motorist behaviors near transit stops can help identify safety problems.
Washington State Department of Transportation (WSDOT) in collaboration with University of Washington’s Transportation Research Center (TRAC) developed a method for evaluating both pedestrian and bicycle crash locations on all state highways using Geographic Information Systems. Police records processed by WSDOT provided data on all pedestrians involved in collisions over a six year period (1999 to 2005). The evaluation accounts for a range of contributing factors including:
This evaluation method is now used by WSDOT to develop and prioritize projects and programs focused on reducing the over 400 fatal and serious injury pedestrian- and bicycle-related crashes that occur in the state each year.
Contact: Paula Reeves at (360) 705-7258, Community Design Assistance Branch Manger, ReevesP@wsdot.wa.gov.
| < Previous | Table of Content | Next > |

