U.S. Department of Transportation
Federal Highway Administration
1200 New Jersey Avenue, SE
Washington, DC 20590
202-366-4000
| < Previous | Table of Contents | Next > |
Step 4 in the scalable risk assessment process is to select a specific exposure measure to be used in the calculation of risk values. There are several different categories of exposure measures that attempt to quantify the level of contact that pedestrians and bicyclists have with potentially harmful safety outcomes. The five categories of exposure measures included in the guide are briefly defined below.
Distance Traveled: Exposure measures in this category are based on the cumulative distance traveled by all pedestrians and bicyclists at the specified geographic scale. The most common measures in this category are pedestrian miles traveled (PMT) or bicyclist miles traveled (BMT). In cases when the exposure measure values are numerically large, the measures are expressed in thousands or millions of miles traveled.
Time Traveled: Exposure measures in this category are based on the cumulative time traveled by all pedestrians and bicyclists at the specified geographic scale. The most common measures in this category are pedestrian hours traveled or bicyclist hours traveled.
Volume/Count: Exposure measures in this category are based on the volume or count of pedestrians or bicyclists for a specified time period and geographic scale. In some cases, the counts may be annualized for a typical day (such as annual average daily traffic (AADT)), or may represent shorter periods of time (such as an hour). Exposure measures in this category do not capture the distance or time traveled, only the number of pedestrians or bicyclists. Count-based exposure measures are typically used for facility-specific geographic scales, since counts are readily associated with specific street crossings or segments.
Trips Made: Exposure measures in this category are based on the cumulative number of trips made by all pedestrians and bicyclists at the specified geographic scale. Trip-based exposure measures are typically used for areawide geographic scales, since a pedestrian or bicyclist trip typically includes numerous streets segments and crossings.
Population: Exposure measures in this category are based on the population (or specified sub-population) at a specified geographic scale. The most common measure in this category is the number of people (or percent of the population) that walk or cycle. By definition, population-based exposure measures must be used for areawide geographic scales (i.e., no population associated with street segments or crossings).
The selection of an exposure measure will depend upon several criteria, such as the use of the risk values (Step 1), the geographic scale (Step 2), and other criteria. This chapter of the guide introduces the various categories of exposure measures and provides guidance on selecting the most appropriate exposure measure given criteria (such as geographic scale and analytic method). Table 11 contains a selection matrix to help analysts choose an exposure measure best suited for their analysis. Note that each exposure measure will be for a defined time period that matches other variables in the risk definition (such as crashes or other risk indicators). Table 12 provides guidance on the strengths and limitations of each category of exposure measure.
| Category of Exposure Measure | Typical measures | Typical scale | Typical data sources | |||
|---|---|---|---|---|---|---|
| Point | Segment | Network | Region | |||
| Distance Traveled | Miles of travel |
| ||||
| Miles crossed per entering vehicle | ||||||
| Time Traveled | Hours of travel |
| ||||
| Product of crossing time and vehicle volume | ||||||
| Volume/ Count |
Volume/count |
| ||||
| Product of pedestrian /bicyclist volumes and motor vehicle volumes | ||||||
| Trips Made | Number of trips |
| ||||
| Population | Number of people that walk or cycle on regular basis |
| ||||
| Percent of the population that walk or cycle on regular basis | ||||||
Legend: ![]() = to a small extent;
= to a small extent; ![]() = to a moderate extent;
= to a moderate extent; ![]() = to a great extent.
= to a great extent.
Note: Each exposure measure will be for a defined time period that matches the risk definition.
Source: Partially adapted from Greene-Roesel et al., Estimating Pedestrian Accident Exposure: Protocol Report, March 2007.
| Category | Strengths | Limitations |
|---|---|---|
| Distance Traveled |
|
|
| Time Traveled |
|
|
| Volume/ Count |
|
|
| Trips Made |
|
|
| Population |
|
|
Source: Partially adapted from Greene-Roesel et al., Estimating Pedestrian Accident Exposure: Protocol Report, March 2007.
Distance Traveled: Exposure is often measured in terms of distance traveled by multiplying the segment count by the segment length. For example, if a community is interested in the total BMT for a specific bikeway that is comprised of several segments, then bicycle count data is necessary for each roadway segment along with their individual lengths in terms of miles. BMT could then be calculated per segment by applying the following equation:
In Figure 14, segments AB and BC have individual BMT totals since they are different lengths and have their own bicycle count data. Each segment’s BMT can then be summed together to equal the total BMT for the complete length of the bikeway from A to C to equal 355 BMT. Mode-specific distance traveled is usually expressed in terms of the measurement units used for segment length (e.g., 1.25 miles * 200 bicycles = 250 Bicycle Miles Traveled).
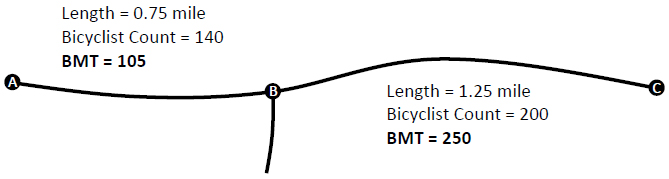
Figure 14. Calculating Distance Traveled Exposure Measure from Segment Counts
Time Traveled: Household travel surveys can be used to measure the amount of time traveled by a specific mode. Survey respondents fill out a travel diary indicating origins and destinations with the start and end times of trips along with the mode that was used. Since the survey represents only a stratified sample of the population, weights must be applied to expand the survey sample so that it represents the entire population of the study area. Survey weights indicate how many households each survey observation represents of the total population of households – these weights are typically provided along with the survey data. For this purpose, the analyst needs to enumerate the total duration of trips by mode per household type as defined in the survey stratification. They then need to multiply each household type’s total duration of trips by its corresponding survey weight to equal the total daily duration of trips by mode for the entire study area (Figure 15).

Figure 15. Calculating Time Traveled by Expanding Household Travel Surveys
For example, the regional household travel survey for Austin, Texas can be used to estimate the total amount of time traveled by walking for the five-county region. The survey sample is comprised of 3,000 households and 8,100 persons and can be expanded to represent the population of the study area by applying the survey weights. The result is a total of 189,256 daily walk trips with an average trip duration of 16 minutes equaling approximately 50,437 hours of walking per day. The NHTS also provides these details for various geographies at a regional scale.
Volume/Count: Exposure measured in terms of volume or counts is common for intersection studies. Such studies may only include bicycle or pedestrian crossing volumes; however, this approach ignores the potential conflicts caused by motor vehicles also passing through the intersection. A more comprehensive exposure measure for intersections is the product of pedestrian/bicyclist volumes and motor vehicle volumes. For example, the following intersection has two counters (C) on opposing corners of the intersection so that they each observe two legs of the intersection, as indicated in Figure 16.
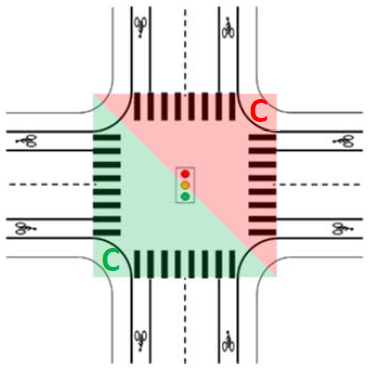
Figure 16. Estimating Count-Based Exposure at Intersections
Each counter counts the total number of entering motor vehicles and bicyclists, as well as the pedestrians using the crosswalks. In this example, pedestrians are counted each time they cross the street and are excluded if they remain on the sidewalk to turn the corner. Since this study is focused on the intersection as a whole, the two sets of counts are combined to equal the total number of bicyclists, pedestrians, and motor vehicles entering the intersection. From these totals, an analyst can apply the following equations to calculate both the bicycle and pedestrian exposures for the intersection:
The above example illustrate one possible way to count non-motorized and motorized volume at an intersection. There are several ways to count user volumes at intersections, and the preferred method may depend on overall intersection user volume, user mix, common turning movements, sight lines, the potential to use automated technology, and data collection resources.
Trips Made: Similar to “Time Traveled,” household travel surveys can be used to measure the number of trips made by a specific mode within a specific study area. The method of expanding the survey sample is the same as above. In this case, the analyst needs to enumerate the total number trips by mode per household type as defined in the survey stratification. They then need to multiply each household type’s total number of trips by its corresponding survey weight to equal the total number of daily trips by mode for the entire study area. For example, the regional household travel survey for Austin, Texas can be used to estimate the total number of trips by mode for the five-county region. The survey sample is comprised of 3,000 households and 8,100 persons and can be expanded to represent the population by applying the survey weights. The result is 189,256 daily walk trips.
Population: Population estimates can be used as an alternative to direct exposure measurements when it is impractical to collect exposure data due to cost constraints. Some of the most commonly used population estimates are those provided by the U.S. Census Bureau, such as the decennial census and ACS. Each of these possess varying levels of data currency and underlying sample sizes. For example, if an agency wanted to know the approximate total number of people who walk to work within Travis County, then they could use the 2016 ACS 1-year estimate for the “Commuting Characteristics by Sex” (see table S0801 and B08301). The ACS data in Table 13 states that Travis County has approximately 662,881 workers 16 years and over, of which 1.8% or 19,932 workers commute to work by walking. Margins of errors are also provided so that confidence intervals can be calculated around the estimates.
| Subject | Estimate | Margin of Error |
|---|---|---|
| Workers 16 years and over | 662,881 | 7,656 |
| MEANS OF TRANSPORTATION TO WORK (%) | ||
| Car, truck, or van | 83 | 1 |
| Drove alone | 73.3 | 1.1 |
| Carpooled | 9.7 | 0.8 |
| In 2-person carpool | 7.6 | 0.8 |
| In 3-person carpool | 1.2 | 0.3 |
| In 4-or-more person carpool | 0.9 | 0.3 |
| Workers per car, truck, or van | 1.07 | 0.01 |
| Public transportation (excluding taxicab) | 3.1 | 0.4 |
| Walked | 1.8 | 0.4 |
| Bicycle | 1.2 | 0.3 |
| Taxicab, motorcycle, or other means | 1.3 | 0.3 |
| Worked at home | 9.5 | 0.8 |
| < Previous | Table of Contents | Next > |

