U.S. Department of Transportation
Federal Highway Administration
1200 New Jersey Avenue, SE
Washington, DC 20590
202-366-4000
| < Previous | Table of Contents | Next > |
In the safety literature, the term risk has been defined as a measure of the probability of a crash to occur given exposure to potential crash events (Turner et al., 2017). This conceptual definition, however, does not provide enough specific detail for one to calculate a risk value.
Therefore, Step 3 involves selecting a specific definition of risk that will be used to calculate quantitative risk values. Table 8 shows three possible definitions of risk, with two of the three definitions closely related (i.e., one uses observed crashes, while the other uses expected crashes).
| 1. Observed Crash Rate | 2. Expected Crashes | 3. Additional Risk Indicators | |
|---|---|---|---|
| Description |
|
|
|
| Strengths |
|
|
|
| Limitations |
|
|
|
The first risk definition is a crash rate (i.e., observed crashes per exposure unit), whereas the second risk definition is a crash frequency (i.e., expected crashes per time unit). There is ongoing discussion in the transportation safety community about the appropriate use of crash rate versus crash frequency in different safety analyses. Crash frequency reflects the overall magnitude of crashes for a given location and time period, whereas crash rate reflects a normalized rate of crashes for a given exposure. If a crash rate is used to quantify risk, a location with just a few crashes but also very low exposure could be classified as a high-risk location, due to the low exposure value in the denominator of the crash rate equation. Similarly, a location with many crashes but also a very high exposure could be classified as a low-risk location, due the high exposure value in the denominator of the crash rate equation. Therefore, one should carefully consider whether the appropriate measure is crash frequency, crash rate, or a combination of these and other safety performance measures. In some safety analyses, both crash frequency and crash rate measures are used to understand better the different dimensions of pedestrian and bicyclist safety.
The remaining sections of this chapter describe examples of these three risk definitions that have been used in practice. These examples are from existing literature and are used to illustrate similarities and differences between the uses of these three risk definitions.
The first risk definition is an observed crash rate, which is calculated by dividing observed (i.e., reported) pedestrian or bicyclist crashes by the corresponding exposure measure. Observed pedestrian or bicyclist crashes are compiled from available crash databases. The exposure measure in the denominator is estimated or calculated as described in this guide.
Schneider et al. (2015) explored the characteristics of pedestrian and bicycle crashes to assist the Wisconsin DOT in providing safe pedestrian and bicycle travel through education, enforcement, and engineering treatments. The authors calculated observed crash rates for the entire state of Wisconsin to determine the historical trend of pedestrian and bicycle crash risk over time. Crash data were obtained from the WisTransPortal Database for years 2011-2013.
Population and level of activity (i.e., walking, bicycling, and driving) were used as measures of exposure to account for any impact that a changing population size or travel behavior may have on risk (i.e., observed crash rate). The authors used the U.S. Census Bureau's ACS intercensal population estimates and commuters by mode to calculate crashes per 100,000 people and crashes per 1,000 walk/bike commuters. Wisconsin DOT VMT data were used to account for the level of driving in the state over the same time by calculating the crashes per million VMT. These measures were used in the absence of statewide direct pedestrian and bicycle counts.
Figure 12 shows the historical trends for the number of fatal (K-level) and incapacitating (A-level) bicycle crashes relative to population and the number of bicycle commuters. The graph shows the difference in rates between the two forms of exposure, although they both indicate a downward trend over the years. The same is true for the pedestrian crash rates.
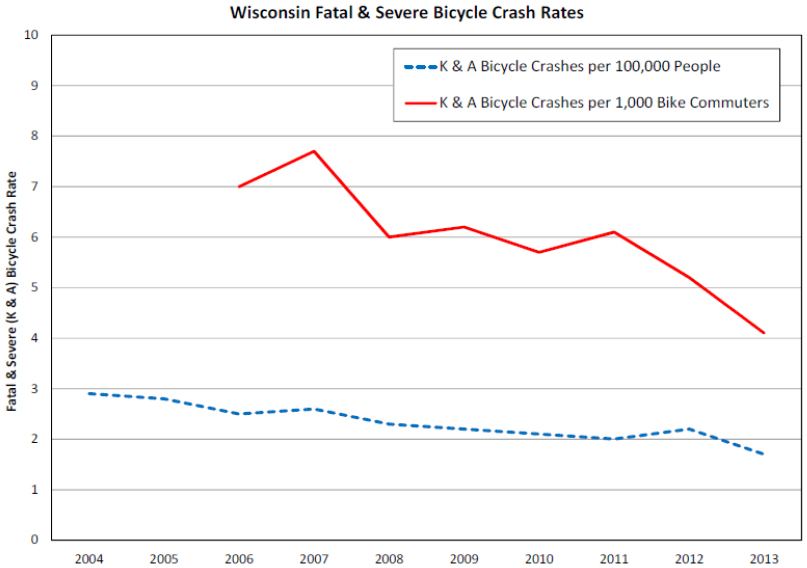
Figure 12. Historical Trends for Observed Bicycle Crash Rates in Wisconsin
Source: Schneider et al., 2015.
Despite their differences, these exposure measures allowed the authors to understand better the change in pedestrian and bicycle crash risk by accounting for exposure at the state level. Table 9 shows that the number of bicycle crashes has only declined slightly between the years 2004-2013, whereas the bicycle commuter crash rate was nearly halved. Therefore, an increase in the number of bicycle commuters was associated with a reduction in bicycle crash risk in Wisconsin.
Table 9. Historical Trends for Observed Bicycle Crashes in Wisconsin
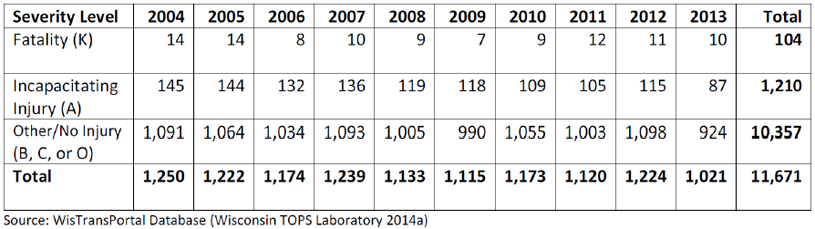
Source: Schneider et al., 2015.
The second risk definition is expected crashes, which are typically estimated using statistical models described in the HSM and elsewhere. These statistical models use exposure as an independent variable (along with other variables) to estimate expected crashes. The exposure input to statistical models can be estimated or calculated as described in this guide.
As part of its Vision Zero initiative, the Seattle DOT and others conducted a pedestrian safety analysis to proactively identify locations and prioritize safety improvements with the goal of preventing future crashes (Seattle DOT 2016, Thomas et al. 2017). The Seattle analysis used a risk definition of expected crashes to overcome several limitations of observed crashes at specific locations, such as regression-to-the-mean and a reactive focus only where crashes have occurred in the past rather than where they are likely to occur in the future.
The Seattle analysis developed statistical models for two crash types:
The analysis included a range of roadway inventory, motorized and non-motorized traffic (i.e., exposure), land use, and socioeconomic variables to estimate expected pedestrian crashes.
The statistical crash models were used to estimate expected crashes for the defined Seattle street network, for the purposes of identifying those locations with the highest risk for pedestrian crashes in the future. The network screening results are shown in Figure 13, which illustrates the top 30 ranked locations in each Seattle City Council District. Note that although this hotspot map looks similar to a traditional crash hotspot map, it is based on expected crashes (i.e., where crashes are most likely to occur in the future) rather than observed crashes. The sidebar in this figure summarizes the key differences between risk definitions based on observed historical crashes versus expected crashes.
![This map and text graphic shows locations in Seattle that have high pedestrian risk, based on the measure of expected pedestrian crashes. Text graphic: 'Systematic vs. High Crash Approach to Reducing Crashes. A systematic approach 1) proactively identifies sites based on risk factors associated with a particular crash type, and 2) uses cost-effective strategies to address potential safety issues system-wide. These strategies might include locations with and without a crash history. This allows us to address future safety risks before they become an issues. This approach complements our traditional high-collision analysis, which identifies and recommends safety improvements for locations with a high number of crashes ['hot spots']. We'll also continue to address safety concerns at bicycle or pedestrian crash 'hot spot' locations.](images/fig13_lg.jpg)
Figure 13. Locations in Seattle with High Risk of Pedestrian Crashes based on Expected Crashes
Source: Seattle DOT, City of Seattle Bicycle and Pedestrian Safety Analysis, 2016
The third risk definition is using one or more risk indicators that are combined into a composite risk score. The risk indicators are those traffic, roadway, and land use features that are thought (or proven) to contribute to higher levels of pedestrian and bicyclist crashes. The risk indicators may be identified through a formal analysis (such as FHWA’s System Safety Analysis process) or through an informal locally defined process. In this approach, pedestrian and bicyclist exposure (or those features that lead to higher exposure, such as walkable streets and mixed land use) is often used as a contributing risk factor. Like the previous two risk definitions, this guide is intended for use to estimate exposure in this Additional Risk Indicators definition of risk.
The Minnesota DOT (MnDOT) 2014 Strategic Highway Safety Plan identified pedestrian and bicyclist crashes as a statewide priority. After completing county-specific safety plans, MnDOT decided to update the safety plans for each of the districts using the systemic approach. Initial analysis showed that about 67 percent of all severe pedestrian and bicyclist crashes occurred in the Minneapolis-St. Paul metropolitan area. As a result, a systemic evaluation of this area was conducted with a focus on pedestrian and bicyclist crashes. The St. Paul case study shows how MnDOT applied the systemic safety process to pedestrian and bicyclist crashes in the urban areas across the State's system in Greater Minnesota. Databases used in this analysis are: 1) MnDOT crash record system, 2) video logs, 3) Google Earth for geometric details, and 4) MnDOT database on traffic volumes.
For the Minnesota district safety plans, the systemic safety process identified the following risk indicators as significantly contributing to pedestrian and bicyclist crashes:
Table 10 shows a table excerpt of signalized intersections for pedestrian and bicyclist risk. Note that a simple ranking score (i.e., one star for each risk indicator) was used to rank and prioritize signalized intersections.
Table 10. Example of Ranking Signalized Intersections based on Multiple Risk Indicators
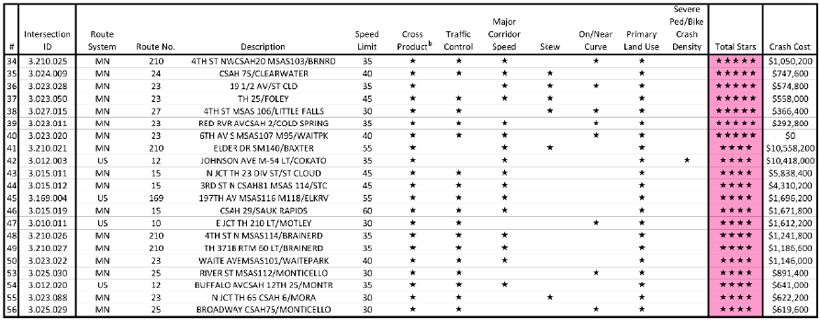
Source: Report FHWA-SA-17-002, Systemic Safety Project Selection Tool Supplemental Case Studies, December 2016.
| < Previous | Table of Contents | Next > |

