U.S. Department of Transportation
Federal Highway Administration
1200 New Jersey Avenue, SE
Washington, DC 20590
202-366-4000
| < Previous | Table of Content | Next > |
This site is within the jurisdiction of Clark County. The land use pattern is a mixed type with shopping complexes and apartments. Flamingo Road is classified as a major arterial and Koval Lane as a minor arterial. Crash data show a total of 29 crashes from January 1996 to December 2000 with 76 percent of them occurring at the intersection. Forty one percent of the total crashes are due to the motorists’ failure to yield. The 2006 traffic count show the estimated ADT on Flamingo Road near Koval Lane to be 40,500. Figure 17 presents the aerial photograph of the site. Implementation plans and conceptual designs of this site are illustrated in Site 7 in Appendix B.
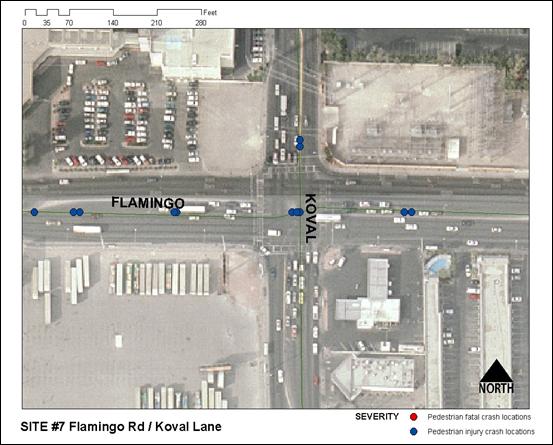
Figure 17: Aerial Photograph of Flamingo Road and Koval Lane
Some of the observed problems at this site are motorists’ failure to yield and a significant number of nighttime crashes inconspicuous crosswalks, high percent of elderly pedestrian involved in crashes, motorist failure to yield, pedestrians do NOT wait for signals/acceptable gaps and high pedestrian/right turning vehicle conflicts.
Based on the field observation and analysis of crash data, the following countermeasures are selected. These countermeasures aim at addressing both pedestrians and drivers behavior to improve safety. By implementing “High visibility crosswalk,” a driver’s attention could be attracted towards pedestrians. Installation of “Pedestrian countdown signal” would help pedestrians to judge if they have enough time to cross the street. Similarly, “Pedestrian Countdown Timer with Animated Eyes” would alert the pedestrians to look for the oncoming traffic or turning traffic before they start crossing the road. Installing ITS No RTOR Signs would mitigate the pedestrian and right turning vehicles conflicts. The implementation plan for the proposed countermeasures at this location is shown in Table 29.
| Treatments | Stage 1 | Stage 2 | Stage 3 |
|---|---|---|---|
| High visibility crosswalk | O | O | O |
| Pedestrian countdown signal (animated eyes) | O | O | |
| ITS No-RTOR signs | O |
O – Installed
The various countermeasures proposed are installed in two stages at this signalized intersection location are as follows:
Stage 1 Countermeasure Deployment
Countermeasure deployed during this stage is “High visibility crosswalk treatment.” This countermeasure is installed on December 19 to 23, 2005. The after condition data for Stage 1 countermeasure deployment are collected on February 14, 2006. Figure 18 shows the countermeasures deployed in stage 1 at this location.
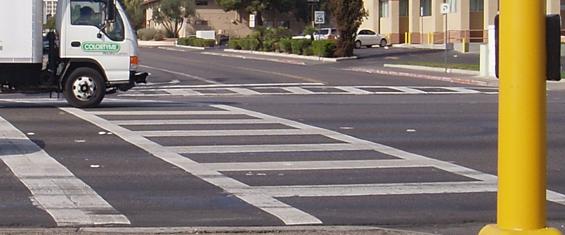
Figure 18: High Visibility Crosswalk Tr ceatment installed at Site 7
Stage 2 Countermeasure Deployment
Countermeasure deployed during this stage is “Pedestrian countdown signs with animated eyes.” This countermeasure is installed on June 9 to 11, 2007. The after condition data for stage 2 countermeasure deployment is collected on July 12 and 13, 2007. Figure 19 shows the countermeasures deployed in stage 2.
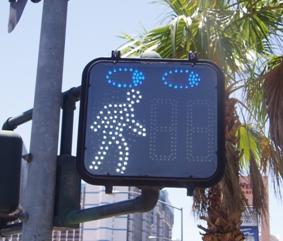
Figure 19: Pedestrian Countdown Timers with Animated Eyes
Stage 3 Countermeasure Deployment
Countermeasure deployed during this stage is “ITS No-Turn on Red Signs.” This countermeasure is installed on November 26, 2007. The after condition data for stage 3 countermeasure deployment is collected on December 17 and 19, 2007. Figure 20 shows the countermeasure deployed in stage 3 at this location
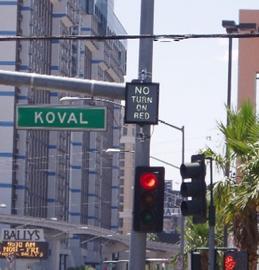
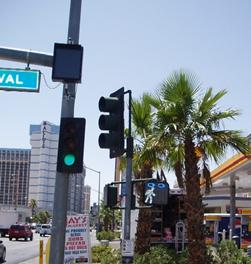
Figure 20: ITS No-Turn On Red – Activated
For the intersection of Flamingo Road and Koval Lane, data collected for the pedestrian and motorist MOEs are summarized in Tables 30 and 31. Statistical tests were performed for the safety MOEs for both pedestrians and motorists comparing the baseline conditions with each stage and comparing the individual stages at a 95 percent confidence level. The results are shown in Tables 32 and 33. The effectiveness of the installed countermeasures is discussed below.
7.5.1 Pedestrian MOEs
From Table 30, the percent of captured and diverted pedestrians is 100 and 0, respectively for both baseline condition and stage 1. The installation of high visibility crosswalk in stage 1 does not show any effect in increasing the percent signal cycles in which the call button was pushed, and the percent of pedestrians beginning their crossing during WALK phase. On the other hand, it resulted in decreasing the frequency of pedestrian signal violation, percent of pedestrians in crosswalk at the end of flashing DON’T WALK phase. However, the percent of pedestrians who look for vehicles before beginning to cross, and percent of pedestrians in the crosswalk at the end of all-red phase shows an increase after installation of stage 1 countermeasures. The deployment of pedestrian countdown with animated eyes in stage 2 shows an increase in the percent signal cycles in which the call button has been pushed, pedestrians who look for vehicles before beginning to cross, pedestrians beginning their crossing during the WALK phase, and a decrease in the percent of pedestrians in the crosswalk at the end of all-red phase. Stage 3 results show further increase in the percent signal cycles in which the call button has been pushed. After installation of stage 3 countermeasures, the percent of pedestrians who look for vehicles before beginning cross was 96 percent, which is significant increase from the 86 percent observed after stage 2 countermeasure deployment. The above results suggest that the high visibility crosswalk and pedestrian countdown signal with animated eyes together have produced a positive effect in increasing the pedestrian safety at the intersection of Flamingo Road and Koval Lane. Also installing ITS No-Turn On Red also improved the overall pedestrian safety by increasing the awareness among pedestrians.
7.5.2. Motorist MOEs
According to the results of field observations, ( Table 31), installation of a high visibility crosswalk does not help increasing percent of drivers yielding to pedestrians, and percent of drivers making a right turn on red (RTOR) who come to a complete stop. On the other hand, the percent of drivers blocking the crosswalk is reduced by 18 percent in stage 1 from baseline condition. However, after the installation of ITS No Turn On Red Sign, there is a slight increase in the percent value (stage 3 - 48 percent from stage 2 - 36 percent) of the drivers making RTOR who come to complete stop before making their turn.
Table 30: Results of safety MOEs for pedestrians at Flamingo Road and Koval Lane
| Measures of Effectiveness (Safety) |
Baseline | Stage 1 | Stage 2 | Stage 3 | ||||||||
|---|---|---|---|---|---|---|---|---|---|---|---|---|
| Sample | NB | Percent | Sample | NB | Percent | Sample | NB | Percent | Sample | NB | Percent | |
| Percent of captured pedestrians | 442 | 442 | 100 | 455 | 455 | 100 | – | – | ||||
| Percent of diverted pedestrians | 442 | 0 | 0 | 455 | 0 | 0 | – | – | ||||
| Percent signal cycles in which call button has been pushed | 438 | 207 | 47 | 307 | 145 | 47 | 235 | 188 | 80 | 202 | 172 | 85 |
| Percent pedestrians who look for vehicles before beginning to cross | 419 | 222 | 53 | 380 | 240 | 63 | 235 | 203 | 86 | 202 | 194 | 96 |
| Frequency of pedestrian signal violation | 442 | 22 | 5 | 303 | 17 | 5 | 235 | 11 | 5 | 202 | 22 | 10 |
| Percent of pedestrians beginning their crossings during the WALK phase | 439 | 232 | 52 | 455 | 234 | 51 | 544 | 436 | 80 | – | ||
| Percent of pedestrians in crosswalk at the end of flashing DON’T WALK | 430 | 127 | 30 | 455 | 140 | 31 | 544 | 269 | 50 | – | ||
| Percent of pedestrians in crosswalk at the end of All-Red | 430 | 39 | 9 | 455 | 14 | 3 | 544 | 29 | 5 | – | ||
Table 31: Results of safety MOEs for motorists at Flamingo Road and Koval Lane
| Measures of Effectiveness (Safety) |
Baseline | Stage 1 | Stage 2 | Stage 3 | |||||||
|---|---|---|---|---|---|---|---|---|---|---|---|
| Sample | NB | Percent | Sample | NB | Percent | Sample | NB | Percent | |||
| Percent of drivers yielding to pedestrians | 164 | 146 | 89 | 278 | 19 | 7 | – | – | |||
| Distance driver stops/yields before crosswalk | < 5 ft | 139 | 112 | 80 | 19 | 18 | 95 | – | – | ||
| 5-10 ft | 139 | 27 | 20 | 19 | 1 | 5 | – | – | |||
| >10 ft | 139 | 0 | 0 | 19 | 0 | 0 | – | – | |||
| Percent of drivers blocking crosswalk | 105 | 22 | 21 | 88 | 3 | 3 | – | – | |||
| Percent of drivers making RTOR who come to a complete stop | 104 | 87 | 83 | 88 | 32 | 36 | 276 | 132 | 48 | ||
| Percent of drivers violating the no RTOR (when pedestrian present) | 276 | 88 | 32 | ||||||||
| Percent of drivers violating the no RTOR (when pedestrian not present) | 276 | 188 | 68 | ||||||||
7.6.1 Safety MOEs
The statistical tests show that the installation of high visibility crosswalk does not improve significantly the proportion of signal cycles in which a call button is pushed. However, the installation of pedestrian countdown signs with animated eyes shows significant effect in increasing the proportion of signal cycles in which the call button is pushed, both when compared with the baseline as well as with stage 1. A similar effect is seen in the percent of pedestrians beginning their crossing during the WALK phase. A significant increase in the percent of pedestrians who look for vehicles before beginning to cross is found in stage 1 as well as in stages 2 and 3, when compared to the baseline data (Table 32). Also when Stage 1 data are compared with stage 2 and stage 2 compared to stage 3 (Table 33). When compared to the baseline data, the data collected after installations of stages 1 and 3 do not show significant improvement in percent of drivers yielding to pedestrians, and in percent of drivers making RTOR who come to a complete stop when compared to baseline. No significant change in the proportion of drivers stopping at distances greater than 10 ft is observed in stage 1 in comparison to the baseline data. A comparison of stages 1 and 2 shows no significant difference in the frequency of pedestrian signal violation and percent of pedestrians in crosswalk at the end of flashing DON'T WALK and the percent of pedestrians in crosswalk at the end of All-Red
Table 32: Statistical test results of safety MOEs at Flamingo Road and Koval Lane (Baseline vs. Stages)
| Measures of Effectiveness (Safety) |
Baseline vs. Stage 1 | Baseline vs. Stage 2 | Baseline vs. Stage 3 | |||||||
|---|---|---|---|---|---|---|---|---|---|---|
| PB – P1 | P-value | H0 | PB – P2 | P-value | H0 | PB – P3 | P-value | H0 | ||
| MOEs below are tested for H0: Pbefore= Pafter vs. Ha: Pafter > Pbefore | ||||||||||
| Percent of captured pedestrians | No Change | – | – | |||||||
| Percent of diverted pedestrians | No Change | – | – | |||||||
| Percent signal cycles in which call button has been pushed | 0.0003 | >0.05 | Do not Reject | -0.32 | <0.001 | Reject | -0.37 | <0.001 | Reject | |
| Percent pedestrians who look for vehicles before beginning to cross | -0.10 | <0.05 | Reject | -0.33 | <0.001 | Reject | -0.43 | <0.001 | Reject | |
| Percent of pedestrians beginning their crossings during the WALK phase | 0.01 | >0.05 | Do not Reject | -0.27 | <0.001 | Reject | – | |||
| Percent of drivers yielding to pedestrians | 0.82 | >0.05 | Do not Reject | – | – | |||||
| Distance driver stops/yields before crosswalk | < 5 ft | -0.14 | <0.05 | Reject | – | – | ||||
| 5-10 ft | 0.14 | >0.05 | Do not Reject | – | – | |||||
| >10 ft | No Change | – | – | |||||||
| Percent of drivers making RTOR who come to a complete stop | 0.47 | >0.05 | Do not reject | – | 0.35 | >0.05 | Do not Reject | |||
| MOEs below are tested for H0: Pbefore= Pafter vs. Ha: Pafter > Pbefore | ||||||||||
Frequency of pedestrian signal violation |
-0.006 | >0.05 | Do not Reject | 0.002 | >0.05 | Do not Reject | -0.05 | >0.05 | Do not Reject | |
| Percent of pedestrians in crosswalk at the end of flashing DON'T WALK | -0.01 | >0.05 | Do not Reject | -0.19 | >0.05 | Do not reject | – | |||
| Percent of pedestrians in crosswalk at the end of All-Red | 0.06 | <0.001 | Reject | 0.03 | <0.05 | Reject | – | |||
Percent of drivers blocking crosswalk |
0.17 | <0.001 | Reject | – | – | |||||
Table 33: Statistical test results of safety MOEs for pedestrians between stages at
Flamingo Road and Koval Lane
| Measures of Effectiveness (Safety) |
Stage 1 vs. Stage 2 | Stage 2 vs. Stage 3 | ||||
|---|---|---|---|---|---|---|
| PB – P1 | P-value | H0 | PB – P2 | P-value | H0 | |
| MOEs below are tested for H0: Pbefore= Pafter vs. Ha: Pafter > Pbefore | ||||||
| Percent signal cycles in which call button has been pushed | -0.32 | <0.001 | Reject | -0.05 | >0.05 | Do not Reject |
| Percent pedestrians who look for vehicles before beginning to cross | -0.23 | <0.001 | Reject | -0.09 | <0.001 | Reject |
| Percent of pedestrians beginning their crossings during the WALK phase | -0.28 | <0.001 | Reject | – | ||
| MOEs below are tested for H0: Pbefore= Pafter vs. Ha: Pafter > Pbefore | ||||||
| Frequency of pedestrian signal violation | 0.009 | >0.05 | Do not Reject | -0.06 | >0.05 | Do not Reject |
| Percent of pedestrians in crosswalk at the end of flashing DON'T WALK | -0.18 | >0.05 | Do not Reject | – | ||
| Percent of pedestrians in crosswalk at the end of All-Red | -0.02 | >0.05 | Do not Reject | – | ||
The increment in percent of pedestrians who pushed the call button, percent of pedestrians who look for vehicles before beginning to cross the roadway, percent of pedestrians beginning their crossing during the WALK phase during after the study shows an indication of improving crossing behavior. The decrease in the percent of pedestrians in the crosswalk at the end of all-red is an indication of increased safety for pedestrians. The decrease in the percent of drivers blocking crosswalk indicates that motorists are stopping/yielding far away from the pedestrians, thus increasing safety for pedestrians. There is a significant increase in the percent of drivers coming to complete stop before making a right turn on red (RTOR) after the installation of the ITS No-Turn On Red Sign.
| < Previous | Table of Content | Next > |

