U.S. Department of Transportation
Federal Highway Administration
1200 New Jersey Avenue, SE
Washington, DC 20590
202-366-4000
| < Previous | Table of Content | Next > |
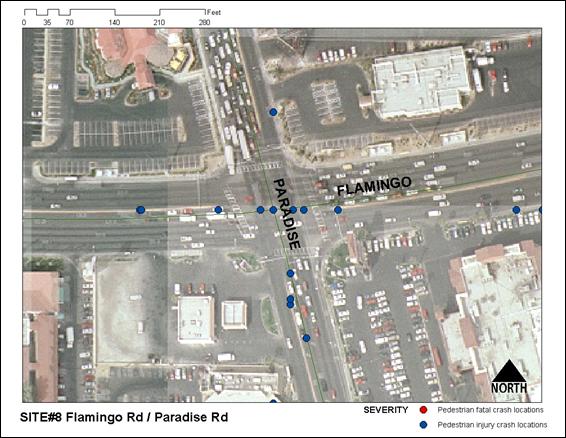
Figure 21: Aerial Photograph of Flamingo Road and Paradise Road (Control Site)
The land use pattern along Bonanza Road between D Street and F Street site is classified as commercial. The location is within the jurisdiction of the City of Las Vegas and the Nevada Department of Transportation (NDOT). Bonanza Road, D Street, and F Street are classified as minor arterials. The posted speed limit along Bonanza Road is 35 mph. D Street and F Street have a posted speed limits of 25 mph. Bonanza Road/D Street is a three-legged (T intersection), and Bonanza Road/F Street is a four-legged signalized intersections. D Street has only the southbound approach at the intersection. Bonanza Road/D Street had 6 crashes between January 1996 and December 2000. All the crashes had occurred at non-intersection location. Bonanza Road/F Street had a total of 12 crashes in the same period with about 60 percent of the crashes occurring at non-intersections. As per the 2006 traffic count statistics, the estimated ADT along Bonanza Road at this site is 20,100. Figures 22 and 23 present the aerial photographs of the Site 9 and Site 10 respectively. Implementation plans and conceptual designs of this site are illustrated in Site 9 and Site 10 in Appendix B.
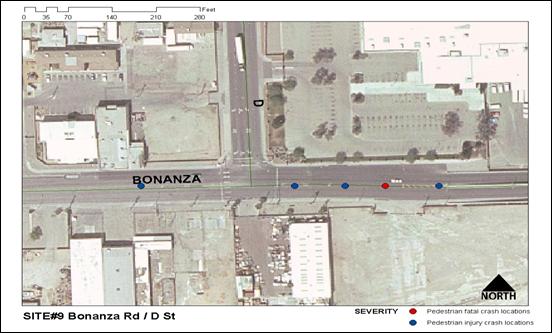
Figure 22: Aerial Photograph of Bonanza Road and D Street
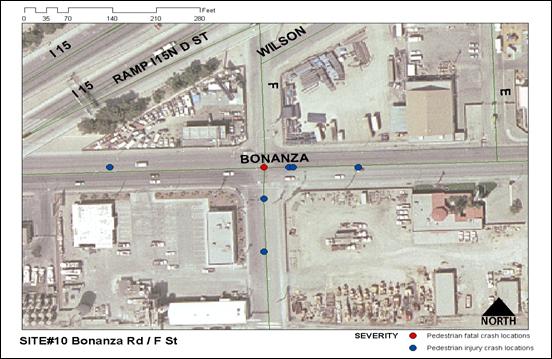
Figure 23: Aerial Photograph of Bonanza Road and F Street
Some of the problems observed at Bonanza Road D Street and F Street are pedestrians not using the crosswalks, inconspicuous crosswalks, pedestrians trapped in the middle of the street while crossing, motorists failing to yield, pedestrians failing to yield, and pedestrians not waiting for signals or acceptable gaps.
The installation of “In-roadway knockdown signs” would inform motorists about pedestrian activities in the vicinity, and it would also remind them of the State law that motorists must yield to pedestrians in the crosswalk. Deployment of “High visibility crosswalk” and “In-roadway knockdown signs” is expected to increase motorists’ yielding behavior to pedestrians, and more crosswalk users. The implementation plan for the proposed countermeasures at this location is shown in Table 34.
Table 34: Implementation Plan for Bonanza Rd: D St to F St
| Treatments | Stage 1 | Stage 2 | Stage 3 |
|---|---|---|---|
| In-roadway knockdown sign | O | O | O |
| High visibility crosswalk | O | O | |
| Pedestrian channelization | O | ||
| Warning sign for motorists |
O – Installed
Stage 1 Countermeasure Deployment
Countermeasure deployed during this stage is “In Roadway Knockdown Signs.” This countermeasure is installed between August 22 and 26, 2005. The after condition data for stage 1 countermeasure deployment are collected between September 12 and 16, 2005. Figure 24 shows the countermeasures deployed in Stage 1 at this location.
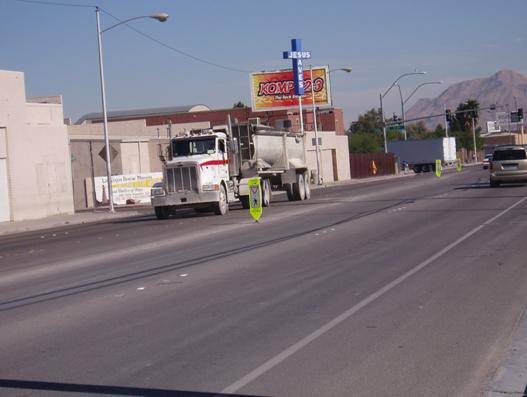
Figure 24: In-roadway Knockdown Signs installed at Site 9/10
Stage 2 Countermeasure Deployment
Countermeasures deployed during this stage are “High Visibility Crosswalk Treatment” and “Warning Signs for Motorists.” These countermeasures are installed on August 4-7, 2006. The after condition data for Stage 2 countermeasure deployment are collected on August 21 to 24, 2006. Figure 25 shows the high visibility crosswalk treatment installed at Site 9/10. Warning signs for motorists installed at the site are shown in Figure 26.
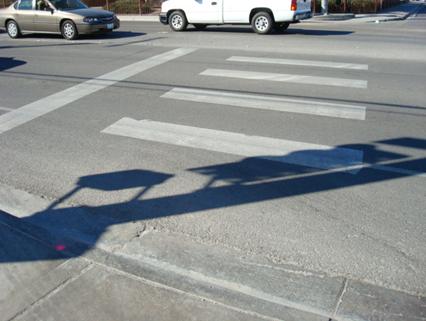
Figure 25: High Visibility Crosswalk Treatment installed at Site 9/10
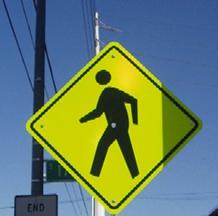
Figure 26: Warning Signs for Motorists installed at Site 9/10
Stage 3 Countermeasure Deployment
Countermeasure deployed during this stage was “Pedestrian Channelization.” This countermeasure is installed on October 29 to November 2, 2007. The after condition data for Stage 3 countermeasure deployment are collected on December 20 and 21, 2007. Figure 27 shows the countermeasure deployed in Stage 3 at this location.
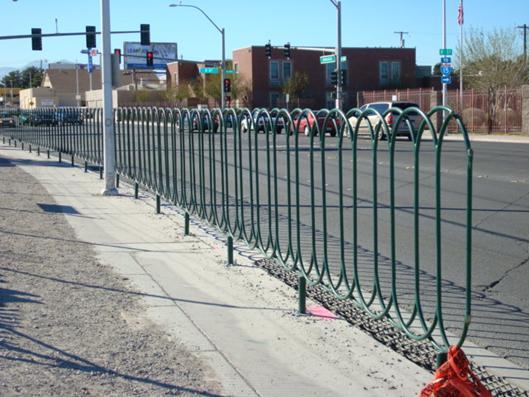
Figure 27: Pedestrian Channelization installed at Site 9/10
9.5.1 Pedestrian MOEs
The baseline data indicate that 100 percent of the observed pedestrians look for vehicles before beginning to cross the roadway and before crossing the second half of the street. The installation of in-roadway knockdown signs in Stage 1, high visibility crosswalk in Stage 2 and pedestrian Channelization in Stage 3 also maintain the “pedestrians look for vehicles behavior before beginning to cross the roadway and before crossing the second half of the street” MOE at 100 percent as shown in Table 35. An increase in the percent of captured pedestrians is observed after the installation of the in-roadway knockdown signs in the Stage 1. Thus the proportion of diverted pedestrians reduced. Different effects are seen in Stage 2 and Stage 3, with decrease in the percent of captured pedestrians and increase in the percent of diverted pedestrians as shown in Table 35. A slight increase is observed in the proportion of pedestrians trapped in the roadway during stage 1. However, after the installation of the high visibility crosswalk, the proportion of pedestrians trapped in the roadway is reduced to zero and is maintained at a similar percentage even after the installation of pedestrian Channelization in Stage 3.
Table 35: Results of pedestrian MOEs at Bonanza Road: D Street to F Street
| Measures of Effectiveness (Safety) |
Baseline | Stage 1 | Stage 2 | Stage 3 | ||||
|---|---|---|---|---|---|---|---|---|
| Sample = 197 | Sample = 333 | Sample = 18 | Sample = 100 | |||||
| NB | Percent | N1 | Percent | N2 | Percent | N3 | Percent | |
| Percent pedestrians who look for vehicles before beginning to cross | 197 | 100 | 333 | 100 | 18 | 100 | 100 | 100 |
| Percent pedestrians who look for vehicles before crossing 2nd half of street | 197 | 100 | 333 | 100 | 18 | 100 | 100 | 100 |
| Percent of captured pedestrians | 146 | 74 | 289 | 87 | 11 | 61 | 78 | 78 |
| Percent of diverted pedestrians | 51 | 26 | 44 | 13 | 7 | 39 | 22 | 22 |
| Percent of pedestrians trapped in the roadway | 9 | 5 | 32 | 9 | 0 | 0 | 9 | 9 |
9.5.2 Motorist MOEs
The data collected under the MOEs related to motorists are shown in Table 36. The proportion of drivers yielding to pedestrians shows a continuous reduction of 0.74 in the baseline to 0.47 in Stage 1 to 0.00 in Stage 2 and has maintained at a lower proportion of 0.01 in stage 3. The data indicate that the installation of countermeasure in Stage 1 resulted in a greater proportion of drivers yielding at a distance greater than 10 ft. Also, the percent of drivers blocking the crosswalk shows a reduction in Stage 1 compared to baseline period. Data from stages 2 and 3 countermeasure installation do not show notable effect on the motorist behavior.
Table 36: Results of motorist MOEs at Bonanza Road: D Street to F Street
| Measures of Effectiveness (Safety) | Baseline | Stage 1 | Stage 2 | Stage 3 | |||||
|---|---|---|---|---|---|---|---|---|---|
| Sample = 89 | Sample = 106 | Sample = 25 | Sample = 170 | ||||||
| NB | Percent | N1 | Percent | N2 | Percent | N3 | Percent | ||
| Percent of drivers yielding to pedestrians | 66 | 74 | 50 | 47 | 0 | 0 | 1 | 0.6 | |
| Sample = 66 | Sample = 50 | Sample = 0 | Sample = 1 | ||||||
| Distance driver stops/yields before crosswalk | < 10 ft | 46 | 70 | 20 | 40 | – | – | ||
| 10-20 ft | 10 | 15 | 15 | 30 | – | 1 | 100 | ||
| >20 ft | 10 | 15 | 15 | 30 | – | – | |||
| Sample = 77 | Sample = 284 | Sample = 0 | Sample = 0 | ||||||
| Percent of drivers blocking crosswalk | 5 | 7 | 3 | 6 | – | – | |||
9.6.1 Pedestrian Delay
The average pedestrian delay measured at this location is shown in Table 37. An increase in pedestrian delay is observed during stage 1; however, it is reduced in stage 2 and further reduced in stage 3 after the installation of the pedestrian channelization.
Table 37: Delay at Bonanza Road: D Street to F Street
| Measures of Effectiveness (Mobility) |
Baseline | Stage 1 | Stage 2 | Stage 3 | ||||
|---|---|---|---|---|---|---|---|---|
| Sampl | Delay | Sample | Delay | Sample | Delay | Sample | Delay | |
| Average pedestrian delay (sec/ped) | 197 | 8.06 | 333 | 12.56 | 18 | 6.29 | 113 | 0.87 |
9.7.1 Safety MOEs
Since the proportions of pedestrians who look for vehicles before beginning to cross and before crossing 2nd half of the street are 1.00, statistically, the null hypothesis cannot be accepted proving no significant changes in the results. The statistical test indicate a significant increase in the percent of captured pedestrians during stage 1 when compared to the baseline data (P<0.001). The increase is not statistically significant when stage 2 results are compared with baseline as well as stage 1 data (P>0.05). The percent of pedestrians trapped in the roadway significantly reduced in stage 2 compared to baseline as well as with stage 1 data (P=0.001). The results are shown in Tables 38 and 39.
The results show no significant increase in percent of drivers yielding to pedestrians and no significant decrease in percent of drivers blocking crosswalk (P<0.05). The increase in the proportion of drivers stopping/yielding at a distance greater than 10 ft is statistically significant (P<0.05).
Table 38: Statistical test results of safety MOEs at Bonanza Road: D Street to F Street
| Measures of Effectiveness (Safety) |
Baseline vs. Stage 1 | Baseline vs. Stage 2 | Baseline vs. Stage 3 | |||||||
|---|---|---|---|---|---|---|---|---|---|---|
| PB – P1 | P-value | H0 | PB – P2 | P-value | H0 | PB – P3 | P-value | H0 | ||
| MOEs below are tested for H0: Pbefore= Pafter vs. Ha: Pafter > Pbefore | ||||||||||
| Percent pedestrians who look for vehicles before beginning to cross | No Change | No Change | No Change | |||||||
| Percent pedestrians who look for vehicles before crossing 2nd half of street | No Change | No Change | No Change | |||||||
| Percent of captured pedestrians | -0.12 | <0.001 | Reject | 0.13 | >0.05 | Do not Reject | -0.03 | >0.05 | Do not Reject | |
| Percent of diverted pedestrians | 0.12 | >0.05 | Do not Reject | -0.13 | >0.05 | Do not Reject | 0.03 | >0.05 | Do not Reject | |
| Percent of drivers yielding to pedestrians | 0.26 | >0.05 | Do not Reject | 0.74 | >0.05 | Do not Reject | 0.73 | >0.05 | Do not Reject | |
| Distance driver stops/yields before crosswalk | <10 ft | 0.29 | >0.05 | Do not Reject | – | – | ||||
| 10-20 ft | -0.26 | <0.05 | Reject | – | – | |||||
| >20 ft | -0.006 | <0.05 | Reject | – | – | |||||
| MOEs below are tested for H0: Pbefore= Pafter vs. Ha: Pafter > Pbefore | ||||||||||
| Percent of drivers blocking crosswalk | 0.01 | >0.05 | Do not Reject | – | ||||||
| Percent of pedestrians trapped in the roadway | -0.05 | >0.05 | Do not Reject | 0.04 | 0.001 | Reject | -0.04 | >0.05 | Do not Reject | |
Table 39: Statistical test results of safety MOEs between stages at Bonanza Road:D Street to F Street
| Measures of Effectiveness (Safety) |
Stage 1 vs. Stage 2 | Stage 2 vs. Stage 3 | ||||
|---|---|---|---|---|---|---|
| PB – P1 | P-value | H0 | PB – P2 | P-value | H0 | |
| MOEs below are tested for H0: Pbefore= Pafter vs. Ha: Pafter > Pbefore | ||||||
| Percent pedestrians who look for vehicles before beginning to cross | No change | No change | ||||
| Percent pedestrians who look for vehicles before crossing 2nd half of street | No change | No change | ||||
| Percent of captured pedestrians | 0.25 | >0.05 | Do not Reject | -0.16 | >0.05 | Do not Reject |
| Percent of diverted pedestrians | -0.25 | <0.05 | Reject | 0.16 | >0.05 | Do not Reject |
| Percent of drivers yielding to pedestrians | 0.47 | >0.05 | Do not Reject | -0.005 | >0.05 | Do not Reject |
| MOE below is tested for H0: Pbefore= Pafter vs. Ha: Pafter > Pbefore | ||||||
| Percent of pedestrians trapped in the roadway | 0.09 | <0.001 | Reject | -0.13 | >0.05 | Do not Reject |
9.7.2 Mobility MOEs
There is no significant reduction in the average pedestrian delay in stages 1 and 2 compared to the baseline as shown in Table 40 (P>0.05). But a significant decrease is observed in stage 2 when compared to stage 1 as seen in Table 41 (P<0.05).
| Measures of Effectiveness (Mobility) |
Baseline vs. Stage 1 | Baseline vs. Stage 2 | Baseline vs. Stage 3 | ||||||
|---|---|---|---|---|---|---|---|---|---|
| Difference in Mean | P-value | H0 | Difference in Mean | P-value | H0 | Difference in Mean | P-value | H0 | |
| MOE below is tested for H0: Pbefore= Pafter vs. Ha: Pafter > Pbefore | |||||||||
| Average pedestrian delay (sec/ped) | -4.50 | >0.05 | Do not Reject | 1.77 | >0.05 | Do not Reject | 7.19 | <0.001 | Reject |
Table 41: Statistical test results of mobility MOE stages 1 and 2 at
Bonanza Road: D Street to F Street
| Measures of Effectiveness
(Mobility) |
Stage 1 vs. Stage 2 | Stage 2 vs. Stage 3 | ||||
|---|---|---|---|---|---|---|
| Difference in Mean | P-value | H0 | Difference in Mean | P-value | H0 | |
| MOE below is tested for H0: Pbefore= Pafter vs. Ha: Pafter > Pbefore | ||||||
| Average pedestrian delay (sec/ped) | 6.27 | <0.05 | Reject | 5.22 | <0.05 | Reject |
The installation of in-roadway knockdown signs and a high visibility crosswalk is effective for reducing the proportion of pedestrians trapped in the roadway and increasing the proportion of pedestrians using the crosswalk to cross the street. The increase in the proportion of drivers yielding at a greater distance enhances safety to pedestrians crossing the roadway. The decrease in the average pedestrian delay in stage 2 indicates that the high visibility crosswalk provides improved mobility
| < Previous | Table of Content | Next > |

