U.S. Department of Transportation
Federal Highway Administration
1200 New Jersey Avenue, SE
Washington, DC 20590
202-366-4000
| < Previous | Table of Content | Next > |
Land use classification along Charleston Boulevard corridor includes office complexes, several small commercial activity units, restaurants, and apartments. The location is within the jurisdiction of the City of Las Vegas and the Nevada Department of Transportation (NDOT). Charleston Boulevard between Spencer Street and 17th Street is a mid-block location. The posted speed limit is 35 mph. The ADT along Charleston Boulevard in the study area is estimated to be 37,500 in the year 2006. Figure 46 presents the aerial photograph of the site.
Figure 46: Aerial Photograph of Charleston Boulevard: Spencer Street to 17th Street
Some of the problems identified are pedestrians not using the crosswalks, high proportions of elderly pedestrian crashes, motorists failing to yield, pedestrians not waiting for signals/acceptable gaps, and high proportions of nighttime crashes. This mid-block site does not have a crosswalk present. Therefore, pedestrians are expected to use crosswalks located at nearby intersections. However, crash data show several pedestrian crashes occurring away from the intersections.
A “High visibility crosswalk” treatment is proposed at this location to help reduce jaywalking in the vicinity. “Advance yield markings” upstream of the crosswalk alert motorists to yield for pedestrians. “Automatic pedestrian detection devices” and “Smart lighting” help to detect the presence of a pedestrian and brighten up the crosswalk with high intensity lights. These countermeasures are intended to address a significant number of nighttime crashes at this site. Because of the automatic pedestrian detection system, pedestrians are expected to be detected even if they do not press the button to activate smart lighting. The implementation plan for the proposed countermeasures at this location is shown in Table 77.
| Treatments | Stage 1 | Stage 2 |
|---|---|---|
| Warning signs for motorists | O | O |
| High visibility crosswalk | O | O |
| Advance yield markings + sign yield to pedestrians | O | O |
| ITS automatic pedestrian detection devices | O | |
Smart Lighting |
O |
O – Installed
The study site of Charleston Boulevard from Spencer Street to 17th Street is a mid-block location. Countermeasures are installed in two stages at this location.
Stage 1 Countermeasure Deployment
Countermeasures deployed during this stage are High visibility crosswalk treatment, Advance yield markings and Warning signs for motorists. These countermeasures are installed between August 22 and 26, 2005. The after condition data for stage 1 countermeasures deployment are collected on September 12 and 16, 2005. Figure 47 and Figure 48 show the countermeasures deployed in stage 1 at this location.
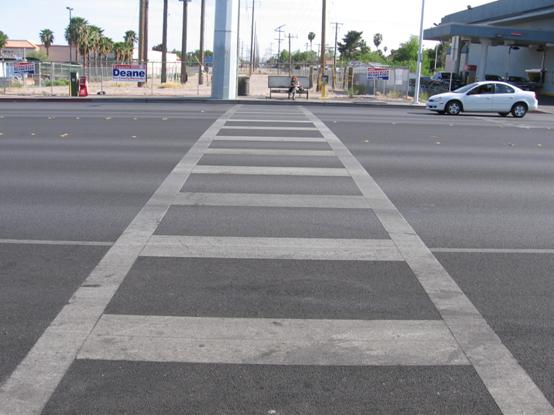
Figure 47: High Visibility Crosswalk Treatment at Charleston Boulevard and 17th Street
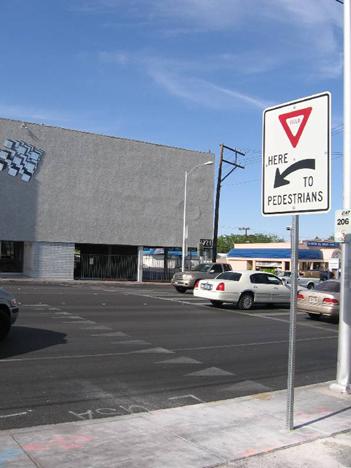
Figure 48: “Advanced Yield Markings” installed at Site 19
Stage 2 Countermeasure Deployment
Countermeasures deployed during this stage are “ITS Pedestrian detection device, Smart lighting.” These countermeasures are installed between January 16 and 19, 2007. The after condition data for Stage 2 countermeasure deployment are collected on February 22 and 26, 2007. Figure 49 and Figure 50 show the countermeasures deployed in stage 2.
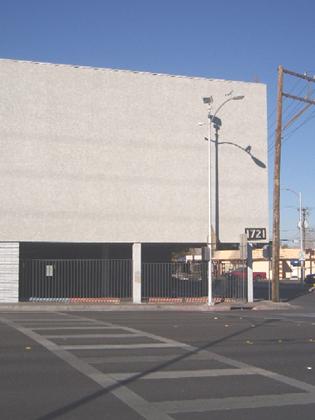
Figure 49: Smart Lighting
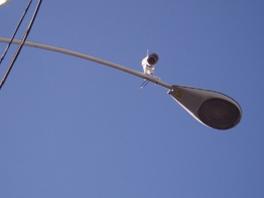
Figure 50: Automatic Pedestrian Detection
The results of the safety MOEs are summarized in Tables 78 and 79. At this location, innovative ITS pedestrian detection device with smart lighting is installed to address the high proportion of nighttime crashes. Results of the statistical tests for the safety MOEs comparing the baseline conditions with each stage and between stages are shown in Tables 82 and 83 respectively. The overall summary and results of statistical analyses of delays and vehicle speed are shown in Tables 80 and 81, and Tables 84 to 85, respectively.
19.5.1 Pedestrian MOEs
During all the data collection periods, such as, baseline, and stages 1 and 2, all the observed pedestrians look for vehicles before beginning to cross and before crossing second half of the roadway as shown in Table 78. Data show that the countermeasures installed in stage 2 results in increase in the number of diverted pedestrians. In addition, the proportion of pedestrians trapped in the roadway reduces for each stage of the installation of the countermeasures.
19.5.2 Motorist MOEs
Data collected for the evaluation of motorist MOEs are summarized in Table 79. The deployment of countermeasures in stages 1 and 2 increases the proportion of drivers yielding to pedestrians compared to the baseline period. Also, an increase in the proportion of drivers who stop/yield to pedestrians at a distance greater than 20 feet is observed in stage 2. However, a notable proportion of drivers blocked the crosswalk during stage 2 data collection.
| Measures of Effectiveness (Safety) |
Baseline | Stage 1 | Stage 2 | |||
|---|---|---|---|---|---|---|
| Sample = 24 | Sample = 44 | Sample = 84 | ||||
| NB | Percent | N1 | Percent | N2 | Percent | |
| Percent pedestrians who look for vehicles before beginning to cross | 24 | 100 | 44 | 100 | 84 | 100 |
| Percent pedestrians who look for vehicles before crossing 2nd half of street | 24 | 100 | 44 | 100 | 84 | 100 |
| Percent of captured pedestrians | 24 | 100 | 44 | 100 | 70 | 83 |
| Percent of diverted pedestrians | 0 | 0 | 0 | 0 | 14 | 17 |
| Percent of pedestrians trapped in the roadway | 9 | 38 | 13 | 30 | 12 | 14 |
| Measures of Effectiveness (Safety) |
Baseline | Stage 1 | Stage 2 | ||||
|---|---|---|---|---|---|---|---|
| Sample = 50 | Sample = 91 | Sample = 116 | |||||
| NB | Percent | N1 | Percent | N2 | Percent | ||
| Percent of drivers yielding to pedestrians | 3 | 6 | 20 | 22 | 41 | 35 | |
| Sample = 3 | Sample = 20 | Sample = 41 | |||||
| Distance driver stops/yields before crosswalk | < 10 ft | 2 | 67 | 8 | 40 | 16 | 39 |
| 10-20 ft | 0 | 0 | 10 | 50 | 16 | 39 | |
| >20 ft | 1 | 33 | 2 | 10 | 9 | 22 | |
| Sample = N/A | Sample = 20 | Sample = 41 | |||||
| Percent of drivers blocking crosswalk | N/A | N/A | 0 | 0 | 5 | 12 | |
The average pedestrian and vehicle delay measured at this location is shown in Table 80 for different stages. The average travel speed of the vehicle is shown in Table 81.
19.6.1 Pedestrian Delay
The average pedestrian delay for the baseline conditions is 15.42 sec/ped. After the installation of the countermeasure in stage 1, the average pedestrian delay decreased to 7.52 sec/ped. The average pedestrian delay further decrease to 3.82 sec/ped in stage 2.
19.6.2 Vehicle Delay
Average vehicle delay increased in stage 1 as well as in stage 2. The increase in vehicle delay is greater in stage 2.
19.6.3 Vehicle Speed
The mean of the observed speeds on eastbound and westbound direction, at the baseline conditions is 32.2 mph and 24.9 mph, respectively. An increase in the mean speed is observed in both directions during stage 1 when compared to baseline.
| Measures of Effectiveness (Mobility) |
Baseline | Stage 1 | Stage 2 | |||
|---|---|---|---|---|---|---|
| Sample | Delay | Sample | Delay | Sample | Delay | |
| Average pedestrian delay (sec/ped) | 24 | 15.42 | 44 | 7.52 | 84 | 3.82 |
| Average vehicle delay (sec/veh) | 50 | 0.34 | 91 | 0.74 | 116 | 2.16 |
| Measures of Effectiveness (Mobility) |
Baseline | Stage 1 | ||
|---|---|---|---|---|
| Sample | Mean speed | Sample | Mean speed | |
| Eastbound (mph) | 266 | 32.2 | 172 | 33.4 |
| Westbound (mph) | 250 | 24.9 | 223 | 30.7 |
19.7.1 Safety MOEs
The increase in the percent of captured pedestrian is statistically significant when stage 2 is compared with baseline. The percent of increase in the diverted pedestrians from baseline to stage 2, and stage 1 to stage 2 is statistically significant (P<0.001). There is a significant decrease in the proportion of pedestrians trapped in the roadway in stage 2 from baseline condition and 15 percent in stage 2 from stage 1 (P<0.05).
From Tables 82 and 83, it can be seen that there is a significant increase in the proportion of drivers yielding to pedestrians from the baseline to stage 1 (P<0.05), the baseline to stage 2 (P<0.001), and stage 1 to stage 2 (P<0.05). Therefore, there is sufficient evidence to reject the null hypothesis at a 95 percent confidence level. The increase in the proportion of drivers yielding distance (10 feet to 20 feet) in stage 1 and stage 2, respectively from the baseline are statistically significant (P<0.001). There is no significant increase in the proportion of drivers blocking the crosswalk from stage 1 to stage 2 at this location as shown in Table 83 (P>0.05).
| Measures of Effectiveness (Safety) |
Baseline vs. Stage 1 | Baseline vs. Stage 2 | |||||
|---|---|---|---|---|---|---|---|
| PB – P1 | P-value | H0 | PB – P2 | P-value | H0 | ||
| MOEs below are tested for H0: Pbefore= Pafter vs. Ha: Pafter > Pbefore | |||||||
| Percent pedestrians who look for vehicles before beginning to cross | No Change | No Change | |||||
| Percent pedestrians who look for vehicles before crossing 2nd half of street | No Change | No Change | |||||
| Percent of captured pedestrians | No Change | 0.16 | >0.05 | Do not Reject | |||
| Percent of diverted pedestrians | No Change | -0.16 | <0.001 | Reject | |||
| Percent of drivers yielding to pedestrians | -0.15 | <0.05 | Reject | -0.29 | <0.001 | Reject | |
| Distance driver stops/yields before crosswalk | < 10 ft | 0.27 | >0.05 | Do not Reject | 0.28 | >0.05 | Do not Reject |
| 10-20 ft | -0.50 | <0.001 | Reject | -0.39 | <0.001 | Reject | |
| >20 ft | 0.23 | >0.05 | Do not Reject | 0.11 | >0.05 | Do not Reject | |
| MOE below is tested for H0: Pbefore= Pafter vs. Ha: Pafter > Pbefore | |||||||
| Percent of pedestrians trapped in the roadway | 0.07 | >0.05 | Do not Reject | 0.23 | <0.05 | Reject | |
| Measures of Effectiveness (Safety) |
Stage 1 vs. Stage 2 | |||
|---|---|---|---|---|
| P1 – P2 | P-value | H0 | ||
| MOEs below are tested for H0: Pbefore= Pafter vs. Ha: Pafter > Pbefore | ||||
| Percent pedestrians who look for vehicles before beginning to cross | No Change | |||
| Percent pedestrians who look for vehicles before crossing 2nd half of street | No Change | |||
| Percent of captured pedestrians | 0.16 | >0.05 | Do not Reject | |
| Percent of diverted pedestrians | -0.16 | <0.001 | Reject | |
| Percent of drivers yielding to pedestrians | -0.13 | <0.05 | Reject | |
| Distance driver stops/yields before crosswalk | < 10 ft | 0.01 | >0.05 | Do not Reject |
| 10-20 ft | 0.11 | >0.05 | Do not Reject | |
| >20 ft | -0.12 | <0.05 | Reject | |
| MOEs below are tested for H0: Pbefore= Pafter vs. Ha: Pafter > Pbefore | ||||
| Percent of pedestrians trapped in the roadway | 0.15 | <0.05 | Reject | |
| Percent of drivers blocking crosswalk | -0.12 | >0.05 | Do not Reject | |
19.7.2 Mobility MOEs
Even though there is a reduction in pedestrian delay from stage 1 to stage 2, it is not statistically significant (P>0.05). There is no significant change in the average vehicle delay in baseline, stage 1 and stage 2 as shown in Tables 84 and 85 (P>0.05). Therefore, the effectiveness of the countermeasures installed at this location has no significant effect in reducing the average vehicle delay. The statistical significance of change in the average speed of the vehicle in stage 1 to baseline is shown in Table 86.
| Measures of Effectiveness (Mobility) |
Baseline vs. Stage 1 | Baseline vs. Stage 2 | ||||
|---|---|---|---|---|---|---|
| Difference in Mean | P-value | H0 | Difference in Mean | P-value | H0 | |
| MOEs below are tested for H0: Pbefore= Pafter vs. Ha: Pafter > Pbefore | ||||||
| Average pedestrian delay (sec/ped) | 7.90 | >0.05 | Do not Reject | 11.60 | <0.05 | Reject |
| Average vehicle delay (sec/veh) | -0.40 | >0.05 | Do not Reject | -1.82 | >0.05 | Do not Reject |
| Measures of Effectiveness (Mobility) |
Stage 1 vs. Stage 2 | ||
|---|---|---|---|
| Difference in Mean | P-value | H0 | |
| MOEs below are tested for H0: Pbefore= Pafter vs. Ha: Pafter > Pbefore | |||
| Average pedestrian delay (sec/ped) | 3.70 | >0.05 | Do not Reject |
| Average vehicle delay (sec/veh) | -1.42 | >0.05 | Do not Reject |
| Measures of Effectiveness (Mobility) |
Baseline vs. Stage 1 | ||
|---|---|---|---|
| Difference in Mean Speed | P-value | H0 | |
| MOEs below are tested for H0: Pbefore= Pafter vs. Ha: Pafter > Pbefore | |||
| Eastbound (mph) | -1.20 | >0.05 | Do not Reject |
| Westbound (mph) | -5.80 | >0.05 | Do not Reject |
It is clear that implementation of ITS pedestrian detection device and smart lighting has a significant effect in increasing the proportion of diverted pedestrians and decreasing the proportion of pedestrians trapped in the roadway, thereby increasing the pedestrian safety. The installation of warning signs for motorists, high visibility crosswalk, and advance yield markings do not show significant effect in reducing the vehicles speed at this location.
| < Previous | Table of Content | Next > |

