U.S. Department of Transportation
Federal Highway Administration
1200 New Jersey Avenue, SE
Washington, DC 20590
202-366-4000
The following four case studies show different approaches towards addressing speed management within the community. Figure 5-1 notes the variety of approaches which include:
A brief summary is provided for each case study, followed by a hyperlink to a report or other document that provides additional detail.
Table 6-1 Case Study Summary
| Traffic Calming Treatments | |||||||||||||||||||||||||||||||||||
|---|---|---|---|---|---|---|---|---|---|---|---|---|---|---|---|---|---|---|---|---|---|---|---|---|---|---|---|---|---|---|---|---|---|---|---|
| Public Concerns | Horizontal Deflection | Vertical | Markings | Signage | Other | ||||||||||||||||||||||||||||||
| Case Study | Unique Approach and Focus Areas for the Countermeasure |
Location | Summary | Speeding | Safety | Transition Zone | Traffic Volumes (through) | Cut Through Traffic | Reduce Truck Traffic | Existing TCDs or Calming | Road Closures | Roadway Realignment | Roundabout | Median Barrier/Island | Chicane | One Way Roadway | Lane Narrowing | Lane Delineators (bike lane) | Speed Hump | Speed Table | Speed Cushions | Pedestrian Crossings (raised) | Pavement Markings Improved | Pvmt Mkg (SLOW) | Pvmt Mkg (Optical Bar) | Pvmt Mkg (Chevron) | Pvmt Mkg (Transverse Bar) | Pvmt Mkg (Speed Limit) | Speed Limit Reduction | Speed Feedback Signs | Special Signing | Gateway Signing | Turn Restrictions | Back-In Angle Parking | Landscaping |
| 1 | Approach: Community Initiative Focus Area: Comprehensive | Village of Palmetto Bay, Florida (Community) | Organized community calming initiatives and process (2015). | X | X | X | X | X | X | X | X | X | X | X | X | X | X | X | |||||||||||||||||
| 2 | Approach: Rural Area Evaluation Focus Area: Rural Community | Kitsap Co, Washington (Rural Area) | Assess safety, evaluate existing TCDs and calming measures (2013). | X | X | X | X | X | |||||||||||||||||||||||||||
| 3 | Approach: Strategic Planning Focus Area: Urban/Rural Areas | Princeton Township, New Jersey (Corridor) | Vision Plan contains a series of traffic calming elements in different settings (2006). | X | X | X | X | X | X | X | X | X | X | ||||||||||||||||||||||
| 4 | Combines four studies Approach: Engineering Study Focus Area: Transition Zones | City of Jesup, Iowa (Transition Zone) | Speed advisory pavement markings at transition zones in Jesup, Iowa (2012). | X | X | X | X | ||||||||||||||||||||||||||||
| City of Ossian, Iowa (Transition Zone) | Speed advisory pavement markings at transition zones in Ossian, Iowa (2012). | X | X | X | X | ||||||||||||||||||||||||||||||
| City of Quasqueton, Iowa (Transition Zone) | Transverse bar pavement markings at transition zones in Quasqueton, Iowa (2012). | X | X | X | X | ||||||||||||||||||||||||||||||
| City of Dexter, Iowa (Transition Zone) | Speed advisory pavement markings at transition zones in Dexter, Iowa (2012). | X | X | X | X | ||||||||||||||||||||||||||||||
Approach: Community Initiative
Focus Area: Comprehensive across Village
Summary: Organized community speed management initiative and process (2015)
What is unique about the approach?
The Village of Palmetto Bay, FL (population 24,339) has a community-based initiative towards speed management in which the Police and Public Works Department receive requests from residents for speed management projects and jointly handles responsibility for addressing these issues. The Village defines speed management as:
What is the speed management focus area?
The Village approach addresses speeding concerns comprehensively with the following options available to address issues:
When was the initiative established and what are the citizen concerns?
The Village organized their community scale speed management initiatives and process in June of 2015. The main concerns from residents include:
What speed management strategies are being used?
The community has strategies to both reduce speed and volumes on residential streets. The speed management efforts to date include the following strategies:
The Village has established both short- and long-term priorities which include:
Several temporary speed management strategies are available to residents as noted below:
How do citizens request a speed management device?
Palmetto Bay citizens can call and specific to speed tables accept Temporary Speed Table Applications from residents who believe there is excessive speeding or poor traffic conditions present in their neighborhood. In order to install the temporary speed table(s), the application requires a 67 percent approval from the neighbors of the area in question. Once the Public Services Department verifies the application, the area(s) get placed on a list with a contractor for installation. However, in order to install permanent asphaltic speed tables, the area must be reviewed for excessive speeding and poor traffic conditions. If it qualifies, the request must then be put forth by Resolution of the Village Council.
Approach: Rural Area Evaluation
Focus Area: Rural Community including Non-Motorized Facilities
Summary: Completed a study to access safety, evaluate existing traffic control devices, and to establish speed management measures (2013)
What is unique about the approach?
Comprehensive assessment of traffic safety issues, and an evaluation of the existing traffic control devices and speed management measures (speed tables). The 2013 study includes pedestrian and bike considerations. The previous reviews and analysis, within the rural study area, were completed by the County Public Works Department. This study, completed by a consultant (TranspoGroup) provides an opportunity for the County and residents of the study area to have an independent and comprehensive review of the roadway conditions, vehicle speeds, safety issues, and existing traffic control and speed management measures along the arterial roadways. The effort identifies best practices for speed management measures along primary routes within rural areas.
What is the speed management focus area?
The study focuses on the Greater Hansville Area (GHA), an unincorporated community in Kitsap County located at the northern end of the Kitsap Peninsula. The traffic study area is an approximately 11 mile network of arterial roadways located in the GHA often referred to as the "Hansville Loop." The arterial network of roads provides primary access to the neighborhoods, adjoining residential properties, small commercial areas, parks, and public community spaces.
When was the initiative established and what are the citizen concerns?
The study was completed in 2013 and one component included an online survey to capture public perceptions about traffic and to help identify parameters for what the traffic study should evaluate and consider. The survey included approximately 18 questions to understand how area residents used the roadways and their general impressions regarding safety. It also attempted to better prioritize specific issues they would like addressed. The County received approximately 330 responses with the primary concerns noted as:
What are the study recommendations relative to speed management?
The community has strategies to both reduce speed and volumes on residential streets. The speed management efforts to date include the following strategies:
How do citizens request a speed management device?
Kitsap County periodically receives requests from its citizens or local community organizations asking that posted speed limits be modified along a corridor. Typically the requests are associated with concern about high vehicle speeds along a roadway. The online survey conducted by the County in May 2012 indicated that few respondents were concerned about the existing speed limits on the roadways today, but were rather concerned about the enforcement of existing speed limits. Kitsap County has not adopted policies or guidelines that need to be followed when modifying or setting speed limits. Instead the County follows Washington State law (WAC 468-95-045), which requires an engineering and traffic investigation to determine if a speed limit modification is warranted. Such an investigation is usually conducted only for those locations that have seen some noticeable change in development, land use, collisions type and frequency, roadway realignments, or travel behavior.
What are the applicable speed management measures for rural arterials?
The study includes development of a speed management toolkit for rural arterials as summarized below:
Approach: Strategic Planning
Focus Area: Route 206 Corridor (Urban and Rural Segments)
Summary: Vision plan which contains a series of speed management elements in both rural and urban settings (2006)
What is unique about the approach?
Princeton Township, Princeton Borough, and the advocacy group Citizens for a Safer Route 206, requested assistance from the New Jersey Department of Transportation to develop a comprehensive vision for Route 206. The Route 206 Joint Vision Plan and Traffic Calming Study takes a corridor level approach to finding solutions to local concerns through three objectives:
What is the speed management focus area?
Route 206 from the Nassau Street intersection area in Princeton Borough to Cherry Valley Road in Princeton Township. The route was defined as a series of five sub-areas from the southern end of the corridor to the north: "In-Town Residential," "Civic Park," "Neighborhood Commercial/Rural Residential," "Woodland," and "Northern Commercial." The Vision Plan contains a series of speed management elements (street trees, roundabouts, back-in angled parking, and pedestrian median refuges) designed to slow vehicular traffic and increase safe opportunities for pedestrians.
What were the citizen concerns?
The study includes a collaborative public involvement process with two design workshops and interviews with local government staff and elected officials, business owners, residents, emergency services representatives, maintenance staff, school system representatives, and the local and regional planning agencies. Several common themes became apparent in the stakeholder interviews:
What are the study recommendations relative to speed management?
Although each segment of the Route 206 corridor has its own set of unique characteristics and challenges, several speed management measures were identified as common solutions and were emphasized throughout the corridor. These include:
What does the Vision Plan provide?
The ideas embodied in the Vision Plan are intended as a starting point from which community residents and their elected officials and their planners can create a "form-based comprehensive plan" of images which illustrate how the corridor might appear. Each particular idea needs to be refined through community analysis, further impact analysis, and the project development process.
The Vision Plan provides Princeton with a framework that allows residents and officials to think about proposed changes in a comprehensive manner. The hope is that this Vision Plan will help the Princeton community come to an agreement on elements to be integrated into its master plan and that it will guide NJDOT in implementing needed projects along the corridor.
The document first defines the design elements that shape the Vision, and then lays out the possible applications of these elements. The speed management elements per area are summarized below:
The study also documents the Vision Plan process including:
Approach: Traffic engineering solutions for rural transition zones
Focus area: Transition zone
Summary: Engineering study
Why was speed management necessary?
Over 42 percent of the population of Iowa (USA) live in a city or township with a population less than 5,000 residents. Many of these communities are located on a farm to market road or principal arterial. As a result, speed management is an important piece of the puzzle to address rural traffic safety. To this end, a team of research engineers from the Institute of Transportation at Iowa State University, selected and then conducted a field evaluation of different engineering speed management countermeasures within rural communities.
How were the speed countermeasures selected?
A list of engineering speed management countermeasures appropriate for use along major routes through rural communities was compiled by the engineering team. This first included evaluating countermeasures employed in urban US communities to determine whether they were feasible for rural communities. Next European countermeasures were identified and considered in the context of rural conditions and norms in the US since rural speed management is more advanced in Europe and other countries than in the US. Countermeasures also needed to be reasonably low-cost due to project constraints (< $10,000 USD). Additionally, the countermeasure needed to conform to the Manual on Uniform Traffic Control Devices (MUTCD) or be able to receive experimental approval.
The engineering countermeasures considered include:
How were the participating communities selected?
Each community either responded to a general study solicitation or were identified for consideration by others, most often the County Engineer.
How were the final speed management study locations selected?
The evaluation for each potential location included a combination of field and desk review actions. The field review considered the magnitude of the existing speeding problem with "speeding" defined as the mean or 85th percentile speed being 5 mph over the posted speed limit. Other considerations included proximity of the road to sensitive land uses (schools, playgrounds, or other pedestrian generators), whether the roadway geometry was conducive to installing countermeasures and measuring their benefits, the location of other traffic controls (i.e. stop signs), the vehicle volumes and fleet mix, and crash history.
The team developed a short list of potential locations and met with locals (city council, maintenance workers, citizens, and law enforcement) to gain perspective on the issues at hand and to discuss appropriate countermeasures. Based on this information, the team presented a speed countermeasure plan for Council approval as well as coordination with the County Engineer. Lastly, the Iowa DOT provided final approval to initiate each community plan. In some cases, the speed countermeasure required "experimental approval" due to non-compliance with the MUTCD.
What were the common community concerns?
Common concerns cited by the communities include:
There were a number of different countermeasures evaluated within community speed transition zones with the results of two different approaches summarized below.
6.4.1 Before/After Case Study #1: Horizontal Speed Limit Signage
What was the treatment?
Figure6-1 shows an example of the horizontal signing evaluated (speed advisory pavement marking treatment) which consists of a large red square painted within the travel lane along with the speed limit ("XX MPH") in white.
![Figure 6-1 Horizontal signing at community entrance in Dexter, IA [Treatment authorized with MUTCD experimental waiver] (Image Source: Neal Hawkins). This photo shows an experimental treatment with 35 MPH painted in red on the road. Note: The red background coloring is not MUTCD compliant, and should only be installed after receiving approval from FHWA through an experimentation waiver.](images/rt32.jpg)
Figure 6-1 Horizontal signing at community entrance in Dexter, IA
[Treatment authorized with MUTCD experimental waiver]
(Image Source: Neal Hawkins)
These pavement markings are a supplement to existing signage with the unusual over-sized markings being more dramatic than static side-of-road signing which can get lost in the clutter or conditioned commuter behavior. Figure 6-2 shows an example of the marking adjacent to existing signage
![Figure 6-2 Horizontal signing at community entrance in Ossian, IA [Treatment authorized with MUTCD experimental waiver] (Image Source: Hallmark, et al 2002). This photo shows an experimental treatment with 25 MPH painted in red on the road. Note: The red background coloring is not MUTCD compliant, and should only be installed after receiving approval from FHWA through an experimentation waiver.](images/rt33.jpg)
Figure 6-2 Horizontal signing at community entrance in Ossian, IA
[Treatment authorized with MUTCD experimental waiver]
(Image Source: Hallmark, et al 2002)
Where was the treatment installed?
Horizontal signing was applied at the speed transition zone of the major roadway entering a small rural community. Table 6-2 identifies the five evaluation locations within the three different communities.
Table 6-2 Evaluation locations for horizontal signing
| City | Community Approach | Roadway | AADT (vpd) | Speed Limit (in transition zone) |
|---|---|---|---|---|
| Dexter | West | F-65 | 1,100 | 55 mph to 35 mph |
| Dexter | East | F-65 | 1,300 | 55 mph to 35 mph |
| Jesup | East | SH 939 | 2,850 | 45 mph to 35 mph |
| Jesup | West | SH 939 | 3,070 | 45 mph to 35 mph |
| Ossian | North | W-42 | 840 | 55 mph to 25 mph |
How were the markings installed and was maintenance over time an issue?
The pavement markings were installed in Dexter first using standard traffic paint, however, winter maintenance significantly degraded their presence after one winter, see Figure 6-3.
![Figure 6-3 Pavement marking paint installation (left) and wear after one winter (right) [Treatment authorized with MUTCD experimental waiver] (Image Source: Neal Hawkins). This photo shows an experimental treatment with 35 MPH painted in red on the road. Note: The red background coloring is not MUTCD compliant, and should only be installed after receiving approval from FHWA through an experimentation waiver. There are two photos. The first shows the painting process on the left, and the second shows the wear after one year, with the red paint faded and worn.](images/rt34.jpg)
Figure 6-3 Pavement marking paint installation (left) and wear after one winter (right)
[Treatment authorized with MUTCD experimental waiver]
(Image Source: Neal Hawkins)
To avoid the problem of wear over time, and to increase skid resistance across the large painted surface, the team used pre-formed thermoplastic with skid resistance for all subsequent pavement marking installations, see Figure 6-4.
![Figure 6-4 Thermoplastic pavement marking installation [Treatment authorized with MUTCD experimental waiver] (Image Source: Hallmark, et al. 2002). This photo shows an experimental treatment with 35 MPH painted in red on the road. Note: The red background coloring is not MUTCD compliant, and should only be installed after receiving approval from FHWA through an experimentation waiver. In this photo, you can see the worn red paint being retreated with thermoplastic marking to improve wear and longevity.](images/rt35.jpg)
Figure 6-4 Thermoplastic pavement marking installation
[Treatment authorized with MUTCD experimental waiver]
(Image Source: Hallmark, et al. 2002)
How was the evaluation conducted?
The evaluation compares speed metrics from before and after installation. Pneumatic road tubes provided individual vehicle speeds, classification, and volume by time of day. The information contrasted included mean and 85th percentile speeds as well as the fraction of drivers traveling 10 or more mph over the posted speed limit (reflects reduction in high-end speeding and not just average changes in speed).
What were the results of the evaluation?
Table 6-3 summarizes the change in speed metrics 12 months after installation. This includes the mean and 85th percentile speed as well as the impact on the higher end speeds (percent traveling 10 and 15 mph over the posted speed). As shown, mean speeds decreased by 1 and up to 2 mph as compared to the before period, and 85th percentile speeds decreased by 1 and up to 3 mph. More positively, there was a sustained reduction in the percentage of vehicles traveling 10 or 15 mph over the posted speed limit (up to 54 percent for 10 mph and up to 53 percent for 15 mph).
Table 6-3 Horizontal signing effectiveness showing change from before to 12 months after installation
| City | Approach | Roadway | Mean Speed (mph) | 85th % Speed (mph) | % 10 mph over posted speed | % 15 mph over posted speed |
|---|---|---|---|---|---|---|
| Dexter | West | F-65 | -1 | -1 | -13% | -16% |
| Dexter | East | F-65 | -1 | -1 | -46% | 0% |
| Jesup | East | SH 939 | -1 | -1 | -43% | -53% |
| Jesup | West | SH 939 | -2 | -3 | -54% | -52% |
| Ossian | North | W-42 | -1 | -1 | -17% | -17% |
6.4.2 Before/After Case Study #2: Removable Traffic Control Devices
What was the treatment?
Figure 6-5 shows an example of how removable traffic control devices were used to create a sense of narrowed lanes and transition zone awareness as drivers entered the community. The temporary curbing was yellow in color and approximately 2 inches high by 40 inches long by 8 inches wide with reflectorized material on each end. Hazard markers were secured on flexible mounts at the beginning and end of the countermeasure.
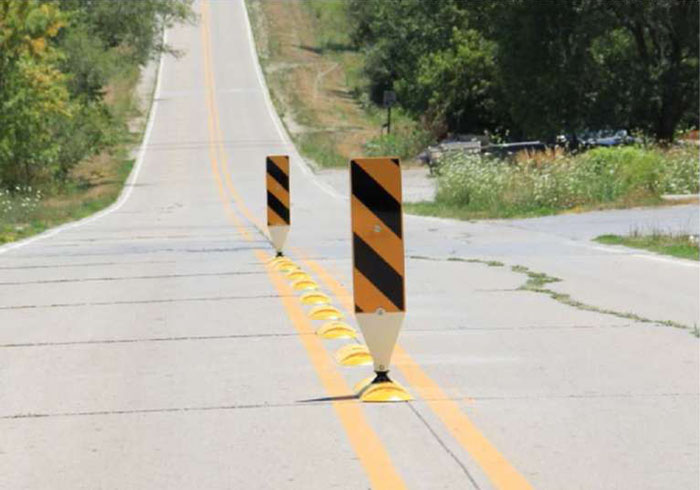
Figure 6-5 Removable traffic control device countermeasure installed in St Charles, IA
(Image Source: Hallmark et al. 2013)
Where was the treatment installed?
The treatment was installed at the speed transition zones on the north, south, and west entrances to St. Charles, Iowa (pop = 653). The east community entrance includes a horizontal curve and was not considered for the treatment.
How were the markings installed and was maintenance over time an issue? The countermeasure was easily installed using simple tools and followed manufacturer's instructions. The countermeasure was placed to avoid driveways (both residential and farm driveways) and drainage facilities. Following installation, some farmers expressed concerns about moving loaded trucks across the countermeasure during the fall harvest. Additionally, it was originally intended that the countermeasure would be removed during the winter months since it could not be avoided by snow plows. As a result, the countermeasure was removed during the late fall and winter periods and replaced during the spring. The plastic products were durable, however, given the potential for the object marker signs to be damaged, additional supplies were ordered and stockpiled.
How was the evaluation conducted?
The evaluation compares speed metrics from before and after installation. Pneumatic road tubes provided individual vehicle speeds, classification, and volume by time of day. The information contrasted included mean and 85th percentile speeds as well as the fraction of drivers traveling 10 or more mph over the posted speed limit (reflects reduction in high-end speeding and not just average changes in speed).
What were the results of the evaluation?
Table 6-4 summarizes the change in speed metrics 12 months after installation. This includes the mean and 85th percentile speed as well as the impact on the higher-end speeds (percent traveling 10 and 15 mph over the posted speed). As shown, mean speeds decreased by 1 and up to 3 mph as compared to the before period, and 85th percentile speeds decreased by 1 and up to 3 mph. More positively, there was a sustained reduction in the percentage of vehicles traveling 10 or 15 mph over the posted speed limit (up to 50 percent for 10 mph and up to 57 percent for 15 mph).
Table 6-4 Removable traffic control device effectiveness showing change from before to 12 months after installation
| Community Approach | Roadway | Mean Speed (mph) | 85th % Speed (mph) | % 10 mph over posted speed | % 15 mph over posted speed |
|---|---|---|---|---|---|
| North | Morgan | -3 | -3 | -50% | -57% |
| South | Morgan | -2 | -2 | -33% | -43% |
| West | Main | -1 | -1 | -22% | -25% |
| << Module 5 | Rural Transition Zones ePrimer | |

