U.S. Department of Transportation
Federal Highway Administration
1200 New Jersey Avenue, SE
Washington, DC 20590
202-366-4000
| < Previous | Table of Contents | Next > |
The objective of this section of the report is to summarize characteristics of speeding-related crashes. The research team used crash data from the Fatality Analysis Reporting System (FARS) and General Estimation System (GES). FARS includes all fatal motor vehicle crashes since 1975. A fatal crash is defined as the death of an occupant or a non-occupant within 30 days of the crash (NHTSA, 2012a). More than 100 data elements were coded in FARS including accident, vehicle, driver, occupant, non-occupant, and pre-crash information.
The most recent crash data in FARS was from 2012. The coding structure has gone through many changes over time; in particular, a major change was made in 2009 to address the data consistency between FARS and GES. As a result, the research team primarily used the most recent 3 years of crash data since the changes were made in 2009 (2010 to 2012) for this report.
GES, on the other hand, includes all types of injury severities from minor to fatal and has data available as early as 1988. Non-injury crashes are also included. The research team collected GES data from a nationally representative sample of motor vehicle crashes as reported by police (NHTSA, 2012b).
GES randomly sampled 50,000 police accident reports each year from more than 400 police agencies in the United States. The crashes included in GES must involve at least one motor vehicle traveling on a roadway and must result in property damage, injury, or death. Each crash in the dataset is also assigned with a weight that can be used to estimate the total number of crashes in the United States.
This report included both FARS and GES datasets to estimate the scope of the speeding-related crash problem in the United States.
The raw datasets were downloaded from FARS and GES ftp website. The data manipulation was conducted using R software. The categories used in the charts and figures are based on FARS definitions.
The following summarizes the various definitions used to summarize crash information.
Definition of speeding-related crashes: "NHTSA considers a crash to be speeding-related if the driver was charged with a speeding-related offense or if an officer indicated that racing, driving too fast for conditions, or exceeding the posted speed limit was a contributing factor in the crash (Traffic Safety Facts, NHTSA)."
The coding system in FARS and GES contains a set of auxiliary data files which indicate whether a crash was speeding related based on the codes as shown in Table 1.
| Variable | FARS/GES | |
|---|---|---|
| Auxiliary File Name | Field Name | |
| Speeding-related Crashes | ACC_AUX | A_SCRA |
The research team used these variables to identify what are termed "speeding-related" crashes in this report.
Definition of Intersection Crashes: The definition was based on the most recent definition provided by FHWA and incorporates intersection and intersection related crashes. An internal memo was the source for this information. Intersection crashes in 2010 or later FARS data are selected to include the following within the "Relation to Junction" field: (2) intersection; (3) intersection-related; (4) driveway access; and (8) driveways access related.
Definition of Roadway Departure Crashes: The definition was based on the most recent provided by FHWA for roadway departure crashes: "A crash in which a vehicle crosses an edge line, a center line, or leaves the traveled way." The research team queried roadway departure crashes in 2010 or later FARS data within the first event for any vehicle to include: (63) Ran Off Road – Right; (64) Ran Off Road – Left); (65) Cross Median; and (68) Cross centerline or include the following within the fixed object codes: 17, 19-43, 46, 52, 53, 57, and 59. The following are also included: (67) Vehicle Went Airborne and (69) Re-entering Roadway.
Definition of Pedestrian and Bicycle Crashes: The definition was based on the most recent provided by FHWA for pedestrian and bicycle crashes. Using 2010 or later FARS data this includes persons who were coded as: (5) Pedestrian; (6) Bicyclist; (7) Other Cyclist; or (8) Person on Personal Conveyance.
This section focuses on the breakdown of speeding-related crashes by crash type, driver characteristics, vehicle characteristics, and roadway environments at the national level. Unless otherwise noted, the information utilizes the most recent three years of data (2010 to 2012).
In most cases data are shown aggregated the crash level. In some cases data are presented at the vehicle or driver level (i.e. age or vehicle type), and this is indicated as such.
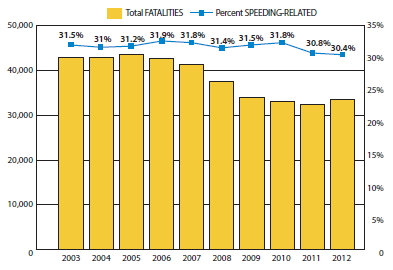
The trend of speeding-related fatalities in the past 10 years is shown in Figure 1. The number of fatalities has declined over the past 10 years from around 42,000 from 2003 to 2007 to around 33,000 from 2010 to 2012. The percent of fatalities that are speeding related has remained relatively constant at around 31 percent over the past 10 years. NHTSA estimated the annual cost of speeding-related crashes was $40.4 billion (NHTSA, 2012c).
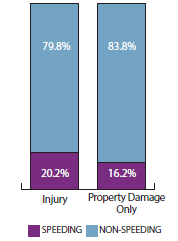
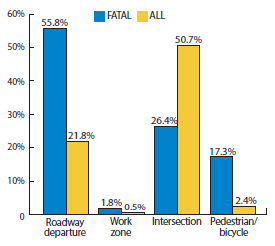
The number of speeding-related crashes are summarized by injury type as shown in Figure 2. Around 20 percent of injury crashes were speeding related in comparison to around 31 percent of fatal crashes. Speeding-related crashes make up around 16 percent of property damage only crashes. The percentage of different crash categories of interest are summarized in Figures 3 and 4. Figure 3 illustrates the percentage of roadway, intersection, work zone, and pedestrian and bicycle crashes overall. Roadway departures make up 55.8 percent of fatal crashes in general but only 21.8 percent of all crashes. As a result, roadway departure crashes are more disproportionately likely to be fatal. Work zone crashes make up 1.8 percent of fatal crashes in general and only 0.5 percent of all crashes. Intersection crashes account for 26.4 percent of fatal crashes in general and 50.7 percent of all crashes. Pedestrian and bicycle crashes account for 17.3 percent of fatal crashes in general but account for only 2.4 percent of all crashes. This suggests that intersection crashes are less likely to be fatal than roadway departures, work zones, or pedestrian and bicycle crashes. This also indicates that pedestrian and bicycle crashes are much more likely to result in a fatal crash.
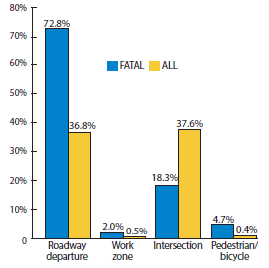
Figure 4 provides similar information for crashes that were coded as speeding-related. As noted roadway departure crashes account for the majority of speeding-related fatal crashes (72.8 percent). In contrast they make up 36.8 percent of all speeding-related crashes. Work zones account for 2.0 percent of speeding-related fatal crashes and 0.5 percent of all speeding-related crashes. Intersections account for less than 20 percent of speeding-related fatal crashes while making up over one-third (37.6 percent) of all speeding-related crashes. Finally, pedestrian and bicycle crashes are 4.7 percent of speeding-related fatal crashes and less than one percent (0.4 percent) of all speeding-related.
It should be noted that the categories in Figures 3 and 4 are not mutually exclusive. A crash coded as a roadway departure could also be a work zone crash, an intersection crash could also be a pedestrian and bicycle crash, etc.
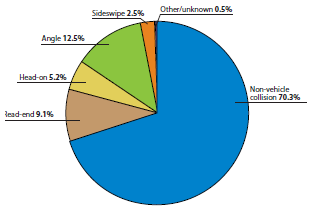
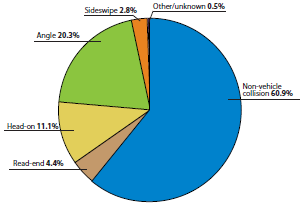
Figures 5 and 6 shows fatal crashes by manner of collision. The predominant crash type for both speeding- and non-speeding-related crashes is non-vehicle collisions, which include roadway departures (this is typically single vehicle roadway departure crashes). Manner of collision was similar for speeding versus non-speeding related crashes.
Driver characteristics including driver age, gender, alcohol test results, and previous convictions are summarized in the following sections.
Age and Gender
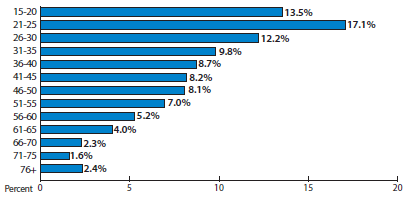
Figure 7 shows the distribution of drivers involved in speeding-related fatal crashes as a function of age group. The sum of the columns equals 100 percent. For instance 13.5 percent of drivers involved in fatal speedingrelated crashes were aged 15 to 20 years old. The largest percentage of drivers involved were aged 21 to 25. Drivers aged 71 to 75 accounted for the fewest number of speeding-related crashes.
Males accounted for 78.2 percent of drivers involved in speeding-related fatal crashes with females making up 22.8 percent. Males make up 73.7 percent of non-speeding-related fatal crashes and females make up 26.3 percent.
Blood Alcohol Concentration
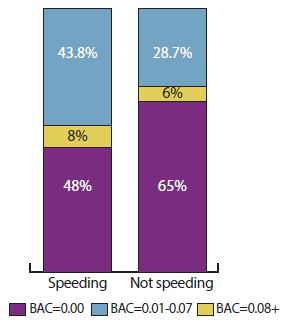
Figure 8 shows the distribution of blood alcohol concentration (BAC) for drivers in fatal crashes. Only situations where BAC was reported were included. The left column show the distribution of drivers involved in speeding-related fatal crashes. Each column equals 100 percent. As noted, drivers with BAC of 0.08 or greater made up almost half of drivers involved in speeding-related fatal crashes while those with a BAC between 0.01 to 0.07 made up around 8 percent of all speeding-related crashes. In contrast, only 29 percent of drivers in non-speeding-related fatal crashes had a BAC of 0.08 and higher and 6 percent had a BAC between 0.01 and 0.07.
Convictions
Figure 9 shows speed convictions. The bars show percentage of drivers involved in all fatal crashes by number of convictions. The sum of all columns equals 100 percent. The percentage of drivers for each conviction category which are speeding-related are shown using the trend line.
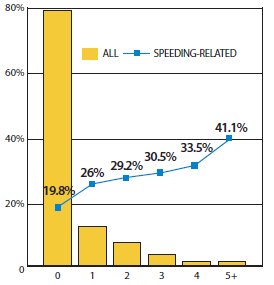
Drivers with no previous convictions make up almost 80 percent of fatal crashes, around 20 percent of crashes for those crashes were coded as speeding related. In contrast, drivers with one previous conviction make up 12.6 percent of fatal crashes but 26.0 percent of those crashes are speeding related. Drivers with five or more convictions account for 0.2 percent of fatal but 41.1 percent of those crashes are speeding related. Although drivers with more convictions made up only a small share of fatal crashes, when they were involved in a fatal crash, it was much more likely to be coded as being speeding related.
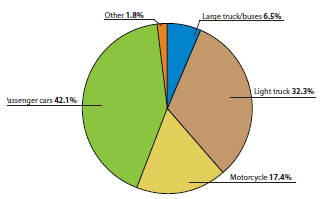
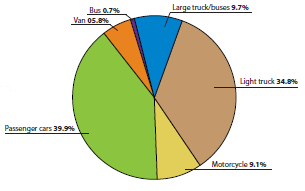
Figures 10 and 11 show the type of vehicles involved in speeding-related and non-speeding-related fatal crashes. Passenger cars make up around 40 percent of both speeding- and non-speeding-related crashes. Slightly more light trucks are involved in non-speeding related (34.8 percent versus 32.3 percent). Similarly, large trucks and buses were more likely to be involved in non-speeding-related fatal crashes compared to those that are speeding-related (9.7 percent versus 6.5 percent). As shown, motorcycle fatalities were much more likely to be speeding-related. Motorcycles only account for 9.1 percent of non-speeding-related fatal crashes but they account for 17.4 percent of speeding-related fatal crashes.
This section summarizes the roadway and environmental characteristics of speeding-related crashes.
Figures 12 and 13 illustrate fatal crashes by roadway type. As the charts indicate, more speeding-related fatal crashes occur on local streets and minor arterials, but more fatal non-speeding-related crashes occur on interstates and principal arterials.
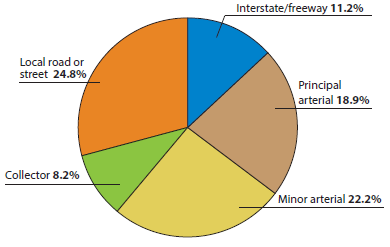
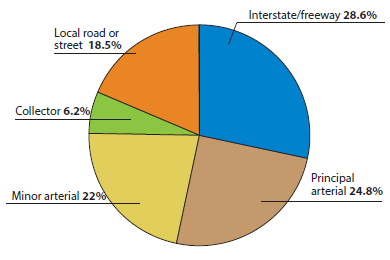
Figure 14 shows the percentage of vehicles involved in speeding-related crashes by speed limit of the corresponding roadway. Almost 37 percent of vehicles involved in fatal crashes on roadways posted at 25 mph and lower were coded as speeding-related. Correspondingly, 63.4 percent of crashes on roadways posted 25 mph or lower were non-speeding-related. Only 8.6 percent of vehicles involved in all crashes on roadways in the same speed limit range are speeding-related. As a result, fatal crashes were much more likely to be speedingrelated for this roadway category.
In all cases, the percentage of vehicles involved in fatal speeding-related crashes for a particular speed limit range is higher than the number of all crashes that are speeding-related.
In addition, lower speed limit ranges have a higher percentage of vehicles involved in crashes that are coded as speeding-related. For instance, 27.9 percent of vehicles involved in fatal crashes on roadway posted at 60 or more mph were speeding-related while 34.1 percent were coded for roadways posted at 30 to 35 mph. This is likely due to the fact that it is easier to be coded as speeding for lower speed limits.
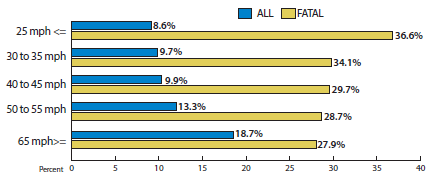
Figure 15 summarized the percentage of speeding-related crashes in work zones. Speeding-related crashes account for 35 to 42 percent of fatal work zone crashes, depending on the type of work zone. The percentage of all speeding-related crashes in work zones range from 15 to 27 percent. For instance, 42.4 percent of fatal crashes in utility type work zones were speeding-related while only 14.8 percent of all crashes in utility work zones were speeding-related.
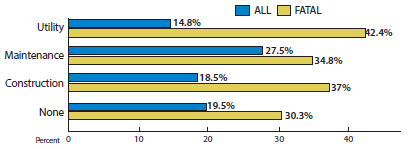
Figure 16 show the percentage of vehicles involved in crashes that were speeding-related by surface condition. As noted, fatal crashes were more likely to be speeding-related for all roadway surface categories. Crashes on roadways where ice, frost, or slush was listed as the surface condition were the most likely to be speeding-related for both fatal and total crashes (41.6 percent and 32.7 percent), respectively.
Crashes on dry roads were the least likely to be coded as speeding-related, with 8.6 percent of all crashes and 20.0 percent of fatal crashes coded as having vehicles on dry roads.
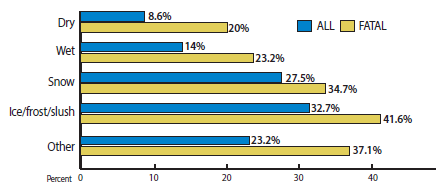
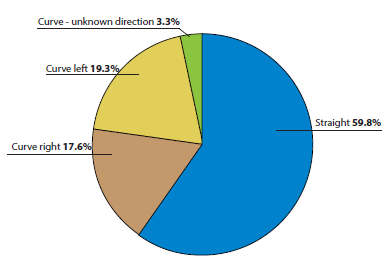
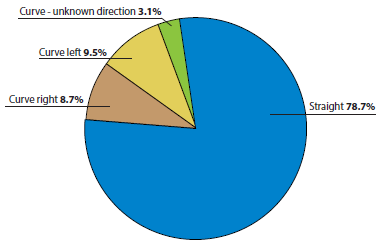
Figure 17 showed the distribution of vehicles involved in speeding-related crashes by type of horizontal alignment. As noted, around 60 percent of vehicles involved in fatal speeding-related crashes were on a straight section of roadway while around 40 percent were on some type of horizontal curve. Figure 18 shows the distribution of vehicles involved in all crashes. As indicated, vehicles in all crashes were most likely to be on a straight section (78.7 percent) with around 21 percent occurring on some type of horizontal curves.