U.S. Department of Transportation
Federal Highway Administration
1200 New Jersey Avenue, SE
Washington, DC 20590
202-366-4000
| < Previous | Table of Contents | Next > |
This section describes speeding-related crash characteristics for pedestrian and bicycle crashes. Crashes were extracted for 2010 to 2012 in the FARS database as described in Chapter 2.
Only 8.3 percent of fatal crashes involving a pedestrian or bicyclist were speeding related. Pedestrian and bicycle crashes were predominantly urban (73 percent). Around 16.9 percent of all fatal pedestrian and bicycle crashes were coded as hit and run, while 30.4 percent of all speeding-related crashes were coded as such. As a result, speeding-related crashes were almost twice as likely to be hit and run.
Roadway characteristics for fatal crashes involving bicyclists and pedestrians are summarized in the following sections.
Location for speeding-related, pedestrian and bicycle fatal crashes is provided in Figure 79. The sum of all bars equals 100 percent. As noted, 46.4 percent of fatal speeding-related pedestrian and bicycle crashes were non- intersection crashes and did not occur in a crosswalk. A small number (1.2 percent) occurred at a non-intersection location within a marked crosswalk and 6.8 percent were at an unknown location away from an intersection. These locations may indicate mid-block crossings and, together, make up 54.4 percent of fatal speeding-related pedestrian and bicycle crashes.
Around 2.5 percent were located within a marked crosswalk at an intersection, 1.5 percent were at an intersection but in an unmarked crosswalk, and 3.3 percent were at an intersection within an unmarked crosswalk. A small share were at an unknown location within an intersection.
Shoulders, roadsides, or parking lanes accounted for 14.3 percent of fatal, speeding-related, pedestrian and bicycle crashes. Non-trafficways made up 4.8 percent and the remainder were in various other facilities.
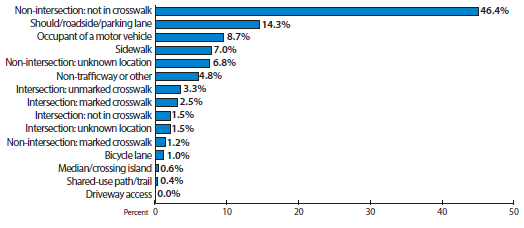
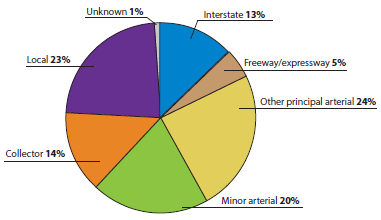
Figure 80 shows pedestrian and bicycle fatal crashes that were speeding-related by roadway type. As noted, other principal arterials which excludes freeways/expressways and interstates accounted for 24 percent of pedestrian and bicycle fatal crashes.
The distribution of vehicles involved in pedestrian and bicycle fatal crashes by posted speed limit that were speeding- related are shown in Figure 81. Vehicles on roadways posted 30 to 35 mph had the highest share of pedestrian and bicycle fatal crashes that were speeding-related (31.1 percent) followed by roadways posted 40 to 45 (20.5 percent).
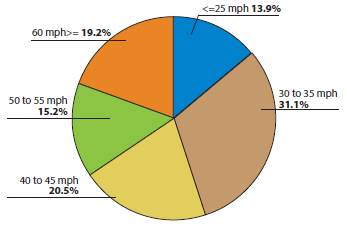
Figure 82 shows the percentage of vehicles involved in fatal bike/ped crashes by speed limit category that were speeding-related. Each bar shows the percentage that were speeding and non-speeding related for a particular speed limit category.
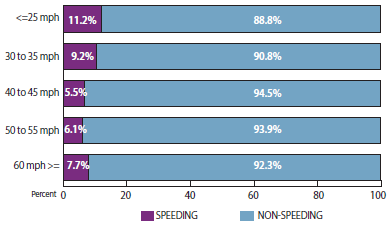
As shown, the category of 25 mph or less had the highest percentage with 11.2 percent of vehicles involved having been coded as speeding-related.
Vehicles traveling on roadways posted 40 to 55 mph were the least likely to be coded as speeding-related for pedestrian and bicycle crashes while almost 8 percent of vehicles involved that were on roadways posted 60 mph or higher were speeding-related.
Males made up 72.3 percent of drivers in all pedestrian and bicycle fatal crashes and 72.5 percent of drivers in speeding related pedestrian and bicycle fatal crashes.
The distribution of drivers involved in all fatal pedestrian and bicycle crashes is illustrated in Figure 83. This includes both speeding and non-speeding and the sum of all bars equals 100 percent. Males accounted for more fatal bike/ped crashes than females for all categories. As noted, males aged 45 to 54 made up 16.0 percent of all fatal pedestrian and bicycle crashes while females in that same age category accounted for 5.2 percent of crashes.
Male drivers aged 55 to 64 accounted for the next highest number of fatal pedestrian and bicycle crashes. They accounted for 12.1 percent of these crashes. Females aged 21 to 24 accounted for the lowest amount of crashes (1.8 percent).
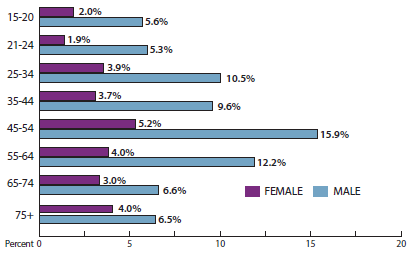
Figure 84 shows the distribution of drivers involved in speeding- related fatal bike/ped crashes. All the bars summed would equal 100 percent. Female drivers of all ages were less likely to have been involved in speeding-related crashes than males. The highest category for females was ages 45 to 54 which accounted for 5.5 percent of speeding-related fatal bike/ped crashes. Female drivers aged 65 to 74 were the least likely to have been involved accounting for 1.8 percent of speeding-related crashes.

Males in all age groups made up a higher percentage of speeding-related crashes than females. Male drivers aged 45 to 54 accounted for 15.9 percent of speeding-related bike/ped crashes and male drivers aged 55 to 64 made up 11.8 percent.
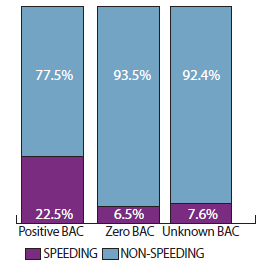
Figure 85 provides blood alcohol concentration for drivers involved in pedestrian and bicycle crashes. The left column shows fatal crashes for positive BAC. As noted 22.5 percent of pedestrian and bicycle crashes where BAC was positive were speeding-related. The center column shows the percentage of drivers with zero BAC involved in pedestrian/bicycle crashes.
Fatal pedestrian and bicycle crashes that were speeding-related by time of day were summarized in Figure 86. As noted, around 37.6 percent of speeding-related crashes occurred during the nighttime with roadway lighting and 22.3 percent occurred at nighttime with no roadway lighting. Daytime crashes represented 35.0 percent with the remaining crashes occurring during nighttime or at dawn or dusk (5.0 percent).
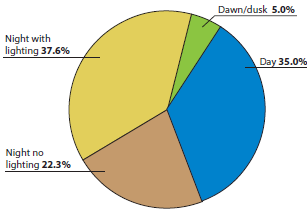
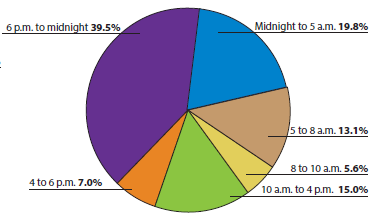
Figure 87 shows the distribution of fatal pedestrian and bicycle crashes by hour of the day that were speeding-related. The most problematic time period was 6 p.m. to midnight which accounted for 39.5 percent of speeding-related fatal pedestrian and bicycle crashes. Midnight to 5 a.m. accounted for 19.8 percent of these crashes. The next highest period was 10 a.m. to 4 p.m. with 15.0 percent of fatal speeding-related bike/ped crashes.
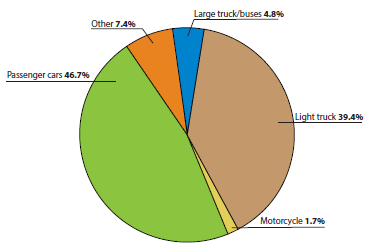
The distribution of vehicles involved in speeding-related fatal pedestrian and bicycle crashes is provided in Figure 88. Passenger vehicles were the most likely to be involved in speeding-related pedestrian and bicycle fatal crashes making up 46.7 percent of vehicles involved in these types of crashes. Large trucks represented 4.8 percent and motorcycles made up the smallest share (1.7 percent).