U.S. Department of Transportation
Federal Highway Administration
1200 New Jersey Avenue, SE
Washington, DC 20590
202-366-4000


Skip to content
Facebook iconYouTube iconTwitter iconFlickr iconLinkedInInstagram

Safety

FHWA Home / Safety / Speed Management / Integrating Speed Management within Roadway Departure, Intersections, and Pedestrian and Bicyclist Safety Focus Areas

Integrating Speed Management within Roadway Departure, Intersections, and Pedestrian and Bicyclist Safety Focus Areas

< Previous Table of Contents Next >

Appendix A:

4. SPEEDING-RELATED FATAL ROADWAY DEPARTURE CRASHES

This chapter describes speeding-related crash characteristics for roadway departures. Roadway departure crashes were extracted from the FARS database using FHWA definition as described in Chapter 2. Roadway crashes were extracted from the FARS data for 2010 to 2012.

Around 40 percent of fatal roadway departure crashes are speeding-related. Sixty-five percent of fatal roadway departure crashes occur in rural areas

4.1 ROADWAY CHARACTERISTICS

4.1.1 Roadway Type

Figure 50 shows the distribution of vehicles involved in fatal speeding-related roadway departure crashes by type of roadway. As noted, 27.2 percent of vehicles were on local roads followed by collectors, which account for 25.1 percent. Minor and other principal arterials accounted for 16.7 percent and 16.0 percent, respectively.

The distribution of vehicles involved in speeding-related fatal roadway departure crashes by type of roadway is as follows: interstate, 10.4 percent; freeway or expressway, 3.2 percent; other principal arterial, 16 percent; minor arterial, 16.7 percent; collector, 25.1 percent; local, 27.2 percent; unknown, 1.5 percent.
Figure 50: Distribution of Vehicles Involved in Speeding-related Fatal Roadway Departure Crashes by Type of Roadway
(Source: FARS 2010 – 2012)

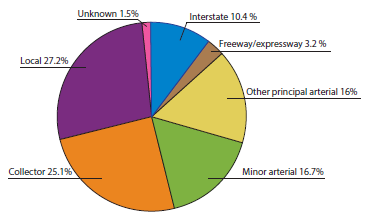
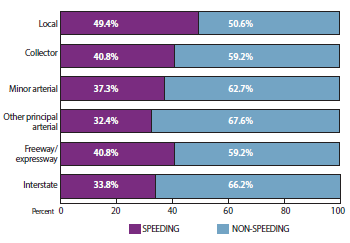
Figure 51 shows percentage of vehicles involved in roadway departure crashes by roadway type that were speeding-related. As can be seen, local roads had the highest percentage of vehicles involved in speeding-related crashes, and almost half of all vehicles involved in fatal roadway departure crashes on local roads are speeding-related. Other principal arterials ranked lowest at 32.4 percent.

The percentage of vehicles involved in speeding-related fatal roadway departure crashes by type of roadway is as follows: local, 49.4 percent; collector, 40.8 percent; minor arterial, 37.3 percent; other principal arterial, 32.4 percent; freeway or expressway, 40,8 percent; interstate, 33.8 percent.
Figure 51: Percentage of Vehicles Involved in Speeding-related Fatal Roadway Departure Crashes by Type of Roadway
(Source: FARS 2010 – 2012)

4.1.2 Speed Limit

The distribution of vehicles involved in speeding-related roadway departure fatal crashes by speed limit is shown in Figure 52. It should be noted that speed limit is correlated to roadway type. At 35.0 percent, the largest share of vehicles involved in speeding-related roadway departure fatal crashes were on roadways with speed limits of 50 or 55 mph. The second largest share was for vehicles on roadways with a posted speed limit of 40 to 45 mph (21.4 percent).

Note that type of roadway (e.g., local, collector) does not necessarily correspond to a specific speed-limit range. As a result, information in Figure 51 does not necessarily correlate to that in Figure 53. For instance, local roads made up 27.2 percent of speeding-related fatal crashes as noted in Figure 51. The local roads category includes roadways other than residential and other low-speed roadways.

The distribution of vehicles involved in speeding-related roadway departure fatal crashes by speed limit (mph) of corresponding approach is as follows: less than 25 mph, 5.9 percent; 30 to 35 mph, 18 percent; 40 to 45 mph, 21.4 percent; 50 to 55, 35 percent; 60 or more, 17.3 percent; unknown, 2.3 percent.
Figure 52: Distribution of Vehicles Involved in Speeding-related Roadway Departure Fatal Crashes by Speed Limit (MPH) of Corresponding Approach
(Source: FARS 2010 – 2012)

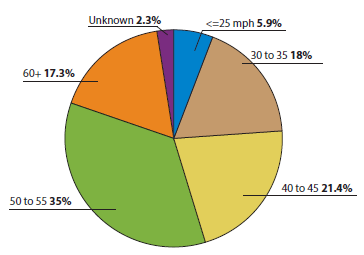
Figure 53 provides the speeding-related roadway departure fatal crashes for each speed limit category. Almost 54 percent of vehicles involved in fatal roadway departure crashes on roadways signed at 25 mph or less were speeding-related. Only 29.4 percent of vehicles involved in fatal roadway departure crashes on roadways signed at 60 mph or more were speeding-related.

The percentage of vehicles involved in speeding-related fatal roadway departure crashes by speed limit (mph) of corresponding approach is as follows: less than 25 mph, 53.7 percent; 30 to 35 mph, 49.4 percent; 40 to 45 mph, 40.8 percent; 50 to 55, 32.4 percent; 60 or more, 29.4 percent; unknown, 2.3 percent.
Figure 53: Percentage of Vehicles Involved in Speeding-related Fatal Roadway Departure Crashes by Speed Limit (MPH) of Corresponding Approach
(Source: FARS 2010 – 2012)

4.1.3 Speed Limit for Single Vehicle Roadway Departure Crashes

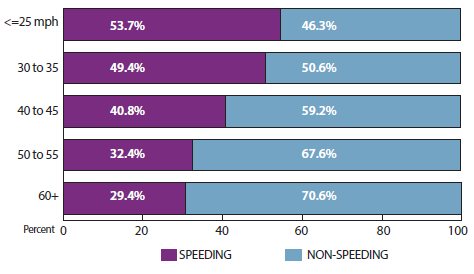
Figure 54 shows the distribution of vehicles involved in speeding-related fatal crashes by speed limit for single vehicle roadway departure crashes. Single-vehicle roadway departures are non-vehicle collisions.

The distribution of vehicles involved in speeding-related single-vehicle roadway departure fatal crashes by speed limit (mph) of corresponding approach is as follows: less than 25 mph, 7 percent; 30 to 35 mph, 20.1 percent; 40 to 45 mph, 22.1 percent; 50 to 55, 35 percent; 60 or more, 15.8 percent.
Figure 54: Distribution of Vehicles Involved in Speeding-related Single-vehicle Roadway Departure Fatal Crashes by Speed Limit (mph) of Corresponding Approach
(Source: FARS 2010 – 2012)

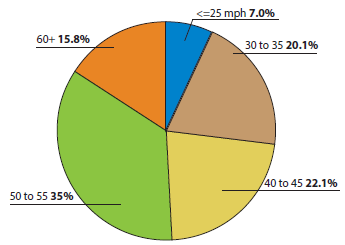
As can be seen, the majority of the vehicles involved in speeding-related single-vehicle roadway departure fatal crashes occur on roadways posted at 50 to 55 mph (35.0 percent), with 15.8 percent occurring on roadways posted 60 mph and higher. Around 20 percent were on roadways posted 30 to 35 mph. The distribution is similar to that presented for all speeding-related roadway departure crashes, as shown in Figure 53.

4.1.4 Horizontal Alignment

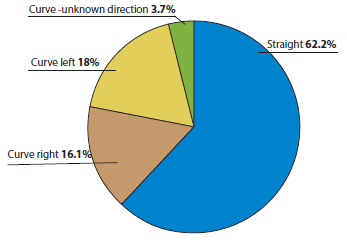
Figure 55 illustrates the distribution of vehicles involved in fatal speeding-related roadway departure crashes by horizontal alignment. Almost 38 percent of vehicles involved in speeding-related fatal roadway departure crashes are on curves, with just over 62 percent being on straight sections, as shown.

The distribution of vehicles involved in speeding- related fatal roadway departure crashes by curve type is as follows: straight, 62.2 percent; curve right, 16.1 percent; curve left, 18 percent; curve - unknown direction, 3.7 percent.
Figure 55: Distribution of Vehicles Involved in Speeding-related Fatal Roadway Departure Crashes by Curve Type
(Source: FARS 2010 – 2012)

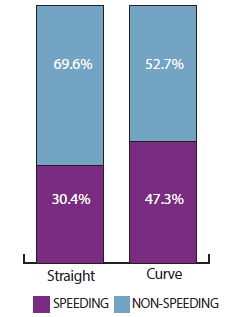
The percentage of vehicles involved in fatal roadway departure crashes for curve and tangent sections are provided in Figure 56. The left bar shows the fatal roadway departure on tangent sections. More than 30 percent of vehicles involved in fatal roadway departure crashes on straight sections were speeding-related,and around 70 percent coded as being not speeding-related. The right bar shows fatal roadway departure crashes on curves. As shown, 47.3 percent of vehicles involved in fatal roadway departure crashes on curves were coded as speeding-related.

The percentage of vehicles involved in speeding-related fatal roadway departure crashes by horizontal alignment is as follows: straight, 30.4 percent; curve, 47.3 percent.
Figure 56: Percentage of Vehicles Involved in Speeding-related Fatal Roadway Departure Crashes by Horizontal Alignment
(Source: FARS 2010 – 2012)

4.2 DRIVER CHARACTERISTICS

Males made up 75.3 percent of roadway departure fatalities. They also accounted for 78.9 percent of speeding-related roadway departure fatalities.

4.2.1 Age and Gender

Figure 57 shows the distribution of drivers involved in speeding-related roadway departure crashes by age and gender. Each set of bars shows the percentage of drivers that were involved in speeding-related crashes for that age group by gender. As a result, 29.9 percent of female drivers aged 45 to 54 who were involved in fatal roadway departure crashes were coded as speeding related, while 70.1 percent were non-speeding related.

Graph indicates that males account for a consistently higher percentage of drivers, regardless of age bracket, who are involved in speeding-related roadway departure fatalities by driver age and genter, as follows: 15-20 years, 42.7 percent female and 52.6 percent male; 21-24 years, 37.4 percent female and 51.8 percent male; 25-34 years, 34.9 percent female and 45.5 percent male; 35-44 years, 32.5 percent female and 37.7 percent male. From age 45 and up, the percentages continue to decrease, although the percentage of females involved in such crashes is consistently lower than the percentage of males.
Figure 57: Percentage of Drivers Involved in Speeding-related Roadway Departure Fatalities by Driver Age and Gender
(Source: FARS 2010 – 2012)

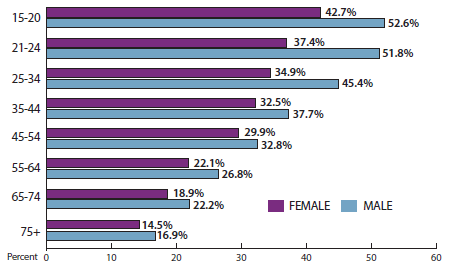
The 15 to 20 age group had the highest fraction of speeding-related fatal roadway departure crashes for both male and females. As shown, 42.7 percent of fatal roadway departure crashes for females in that age group were speeding-related while 52.6 percent of fatal roadway departure crashes for males in that same age group were speeding-related. Drivers aged 75 and older had the lowest fraction of speeding-related roadway departure crashes.

4.2.2 Blood Alcohol Concentration

Figure 58 shows the distribution of drivers involved in fatal speeding-related roadway departure crashes by blood alcohol concentration (BAC). As noted 45.4 percent of drivers involved in speeding-related fatal roadway departure crashes had a positive BAC, while no BAC was noted in nearly a quarter of drivers involved in speeding- related fatal roadway departure crashes.

The distribution of drivers involved in speeding-related fatal roadway departure crashes by BAC is as follows: positive BAC, 45.4 percent; zero BAC, 24.9 percent; unknown BAC, 29.6 percent.
Figure 58: Distribution of Drivers Involved in Speeding-related Fatal Roadway Departure Crashes by BAC
(Source: FARS 2010 – 2012)

4.3 ENVIRONMENTAL CHARACTERISTICS

4.3.1 Time of Day

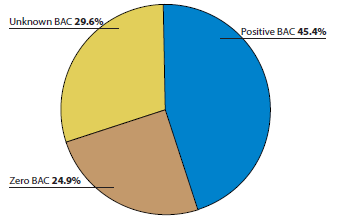
Figure 59 illustrates the distribution of speeding-related fatal roadway departure crashes by time of day. As noted, 38.3 percent of roadway departure crashes occurred during the daytime, with 35.5 percent occurring during the night-time with no lights. Almost 19 percent of fatal road departure crashes occurred during nighttime with lighting and 7.3 percent occurred during dawn or dusk.

The distribution of speeding-related fatal road departure crashes by time of day is as follows: day, 38.3 percent; night, no lighting, 35.5 percent; night with lighting, 18.9 percent; dawn and dusk, 7.3 percent.
Figure 59: Distribution of Speeding-related Fatal Road Departure Crashes by Time of Day
(Source: FARS 2010 – 2012)

4.3.2 Hour of Day

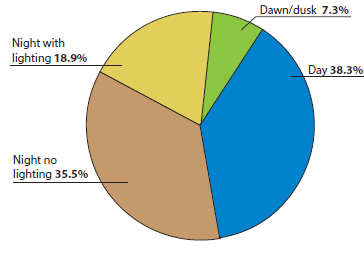
Figure 60 shows the distribution of speeding-related roadway departure fatal crashes by hour of the day. As noted, the majority of speeding-related crashes occurred from 6 p.m. to midnight (31.0 percent) followed by midnight to 5 a.m. at 29.3 percent.

The distribution of speeding-related road departure fatal crashes by hour of day is as follows: midnight to 5 a.m., 29.3 percent; 5 to 8 a.m., 8.2 percent; 8 to 10 a.m., 4.4 percent; 10 a.m. to 4 p.m., 18.8 percent; 4 to 6 p.m., 8.9 percent; 6 p.m. to midnight, 31 percent.
Figure 60: Distribution of Speeding-related Road Departure Fatal Crashes by Hour of Day
(Source: FARS 2010 – 2012)

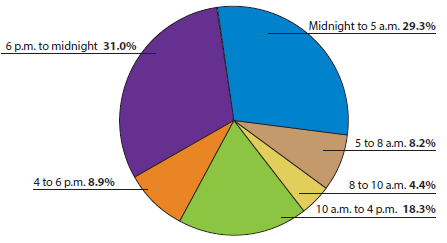
Figure 61 illustrates the percentage of speeding-related fatal roadway departure crashes by hour of the day. Each bar shows the percentage of speeding versus non-speeding related fatal roadway departure crashes for a specific time period. For instance, 27.1 percent of vehicles involved in fatal roadway departure crashes between 10 a.m. and 4 p.m. were speeding-related while 72.9 percent were not speeding-related.

The percentage of speeding-related fatal roadway departure crashes by hour of day is as follows: midnight to 5 a.m., 49.2 percent; 5 to 8 a.m., 30.1 percent; 8 to 10 a.m., 27 percent; 10 a.m. to 4 p.m., 27.1 percent; 4 to 6 p.m., 30.6 percent; 6 p.m. to midnight, 41.5 percent.
Figure 61: Percentage of Speeding-related Fatal Roadway Departure Crashes by Hour of Day
(Source: FARS 2010 – 2012)

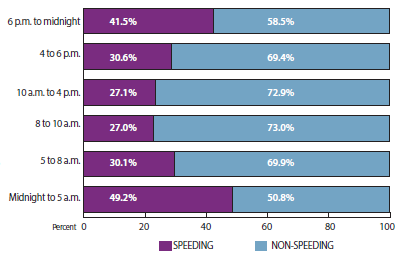
The data show that the percentage of speeding-related fatal roadway departure crashes was highest during the early hours of the day (midnight to 5 a.m.) at 49.2 percent. During the time period from 10 a.m. to 4 p.m., only 27.1 percent of fatal roadway departure crashes were speeding-related.

4.3.3 Surface Condition

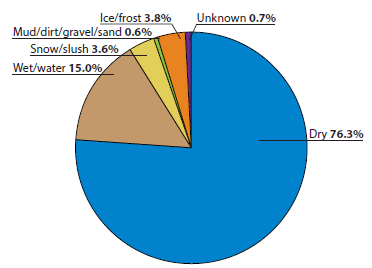
The distribution of vehicles involved in speeding-related fatal roadway departure crashes by surface condition is shown in Figure 62. The majority of vehicles involved in speeding-related fatal roadway departure crashes were on dry roads (76.3 percent), with 15.0 percent occurring on a wet roadway surface, as illustrated.

The distribution vehicles involved in speeding-related fatal roadway crashes by roadway surface condition is as follows: dry, 76.3 percent; wet/water, 15.0 percent; snow/slush, 3.6 percent; mud/dirt/gravel/sand, 0.6 percent; ice/frost, 3.8 percent; unknown, 0.7 percent.
Figure 62: Distribution Vehicles Involved in Speeding-related Fatal Roadway Crashes by Roadway Surface Condition
(Source: FARS 2010 – 2012)

4.4 VEHICLE TYPE

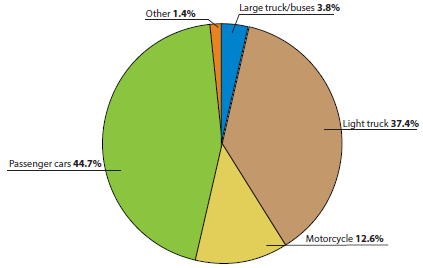
The distribution of vehicles involved in fatal speeding-related roadway departure crashes is provided in Figure 63. Passenger vehicles were the most likely to be involved in speeding-related roadway departure crashes making up 44.7 percent of vehicles involved in these types of crashes. Large trucks represented the smallest share (3.8 percent) of vehicles involved in speeding-related intersection crashes. Motorcycles made up 12.6 percent of speeding-related roadway departure crashes.

The distribution of vehicles involved in speeding-related fatal roadway departure crashes by type of vehicle is as follows: large truck or bus, 3.8 percent; light truck, 37.4 percent; motorcycle, 12.6 percent; passenger car, 44.7 percent; other, 1.4 percent.
Figure 63: Distribution of Vehicles Involved in Speeding-related Fatal Roadway Departure Crashes by Type of Vehicle
(Source: FARS 2010 – 2012)

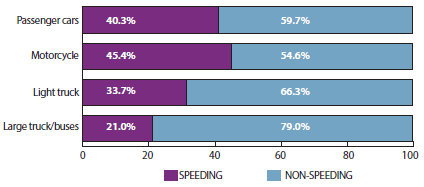
The fraction of speeding-related fatal roadway departure crashes by vehicle type is shown in Figure 64. As shown, for motorcycles that were involved in fatal roadway departure crashes, 45.4 percent were speeding-related, while only 21.0 percent of large trucks/buses involved in fatal roadway departure crashes were speeding-related. Of the passengers cars involved in fatal roadway departure crashes, around 40 percent were speeding-related.

The distribution of vehicles involved in speeding-related fatal roadway departure crashes by type of vehicle is as follows: large truck or bus, 21 percent; light truck, 33.7 percent; motorcycle, 45.4 percent; passenger car, 40.3 percent.
Figure 64: Percentage of Vehicles Involved in Speeding-related Fatal Roadway Departure Crashes by Type of Vehicle
(Source: FARS 2010 – 2012)

4.5 CRASH TYPE

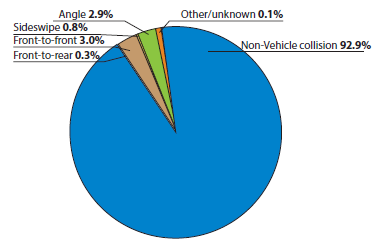
Roadway departure fatal crashes were disaggregated by crash type as shown in Figure 65. As can be seen, non-vehicle collisions made up the highest percentage of speeding-related roadway departure fatal crashes (92.9 percent). Head-on (front-to-front) crashes made up 3.0 percent, while sideswipe accounted for around 1 percent.

The distribution of fatal speeding-related roadway departure crashes by crash type is as follows: non-vehicle collision, 92.9 percent; front-to-rear, 0.3 percent; front-to-front, 3.0 percent; sideswipe, 0.8 percent; angle, 2.9 percent.
Figure 65: Distribution of Fatal Speeding-related Roadway Departure Crashes by Crash Type
(Source: FARS 2010 – 2012)

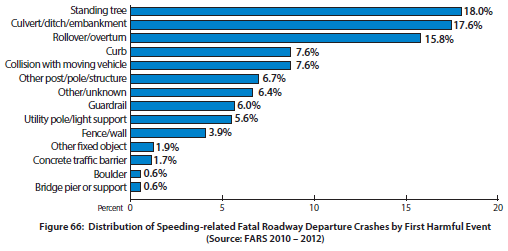
A distribution of crashes by first harmful event for speeding-related roadway departure crashes is shown in Figure 66. Striking a tree accounted for the largest percentage of speeding-related roadway departure crashes (18.0 percent) followed by striking some type of embankment (17.6 percent). Roll-over/overturn crashes account for 15.8 percent.

The distribution of speeding-related fatal roadway departure crashes by first harmful event is as follows: standing tree, 18 percent; culvert/ditch/embankment, 17.6 percent; rollover/overturn, 15.8 percent; curb, 7.6 percent; collision with moving vehicle, 7.6 percent; other post/pole/structure, 6.7 percent; other/unknown, 6.4 percent; guardrail, 6 percent; utility pole/light support, 5.6 percent; fence/wall, 3.9 percent; other fixed object, 1.9 percent; concrete traffic barrier, 1.7 percent; boulder, 0.6 percent; bridge pier or support, 0.6 percent.
Figure 66: Distribution of Speeding-related Fatal Roadway Departure Crashes by First Harmful Event
(Source: FARS 2010 – 2012)

Characteristics of crashes for several types of crashes are summarized in the following sections.

4.6 CHARACTERISTICS OF ROLLOVER CRASHES

Rollover/overturn crashes make up about 14 percent of all fatal roadway departure crashes and account for 16 percent of those that are speeding-related. Rollover/overturn crashes are predominantly rural crashes (72 percent). Information in the following sections was extracted at the vehicle level.

4.6.1 Speed Limit

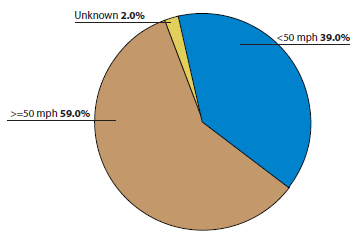
As shown in Figure 67, around 59.0 percent of vehicles involved in speeding-related fatal rollover/overturn crashes were on roadways posted 50 mph or higher. Facilities signed lower than 50 mph accounted for 38.6 percent of these crashes.

The distribution of vehicles involved in speeding- related rollover/overturn fatal crashes by speed limit is as follows: less than 50 mph, 39 percent; greater than or equal to 50 mph, 59 percent; unknown, 2 percent.
Figure 67: Distribution of Vehicles Involved in Speeding-related Rollover/Overturn Fatal Crashes by Speed Limit
(Source: FARS 2010 – 2012)

4.6.2 Blood Alcohol Concentration

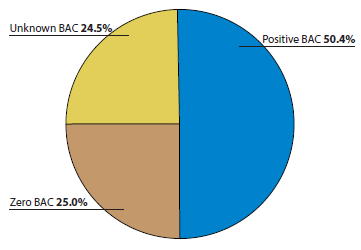
Driver alcohol involvement in fatal rollover/overturn crashes that are speeding-related are shown in Figure 68. A positive BAC was present for 50.4 percent of drivers involved in fatal speeding-related roadway departure crashes, and BAC was unknown about a quarter of these crashes.

The distribution of drivers involved in of speeding- related rollover/overturn fatal crashes by BAC is as follows: positive BAC, 50.4 percent; zero BAC, 25 percent; unkown BAC, 24.5 percent.
Figure 68: Distribution of Drivers Involved in of Speeding-related Rollover/Overturn Fatal Crashes by BAC
(Source: FARS 2010 – 2012)

4.6.3 Surface Condition

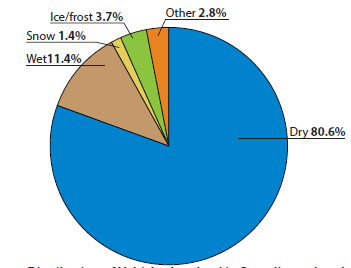
The distribution of vehicles involved in speeding-related fatal roadway departure crashes which were coded as rollover/overturn by roadway surface condition is shown in Figure 69. As can be seen, the majority of vehicles were on roadways with dry road conditions (80.6 percent) and 11.4 percent of vehicles were on wet roads.

The distribution of vehicles involved in speeding-related rollover/overturn fatal crashes by roadway surface condition is as follows: dry, 80.6 percent; wet, 11.3 percent; snow, 1.4 percent; ice/frost, 3.7 percent; other, 2.8 percent.
Figure 69: Distribution of Vehicles Involved in Speeding-related Rollover/Overturn Fatal Crashes by Roadway Surface Condition
(Source: FARS 2010 – 2012)

4.6.4 Vehicle Type

Vehicle involvement in fatal roadway rollover/ overturn crashes that are speeding-related are shown in Figure 70. Light trucks are involved in the majority of speeding-related rollover/ overturn fatal crashes (51.4 percent) followed by passenger vehicles, which are involved in 43.5 percent of these crashes.
The distribution of vehicles involved in speeding-related rollover/ overturn fatal crashes by vehicle type is as follows: light truck, 51.4 percent; passenger car, 43.5 percent; large truck/buses, 3.8 percent; other, 2.8 percent.
Figure 70: Distribution of Vehicles Involved in Speeding-related Rollover/Overturn Fatal Crashes by Vehicle Type
(Source: FARS 2010 – 2012)

4.7 CHARACTERISTICS OF OPPOSING DIRECTION CRASHES

Opposing direction crashes make up 3.6 percent of all fatal crashes, but make up 14.5 percent of speeding-related fatal roadway departure crashes. Around 67 percent of opposing direction crashes were in rural areas.

4.7.1 Speed Limit

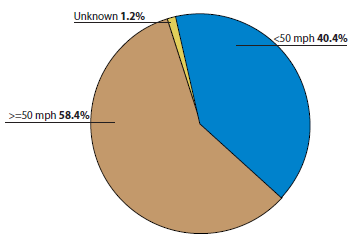
Around 58.4 percent of vehicles involved in speeding-related, fatal, opposing-direction crashes were on roadways posted 50 mph and higher as shown in Figure 71. More than 40 percent were on facilities signed lower than 50 mph.

The distribution of vehicles involved in speeding- related fatal opposing direction crashes by speed limit is as follows: less than 50 mph, 40.4 percent; greater than or equal to 50 mph, 58.4 percent; unkown, 1.2 percent.
Figure 71: Distribution of Vehicles Involved in Speeding-related Fatal Opposing Direction Crashes by Speed Limit
(Source: FARS 2010 – 2012)

4.7.2 Blood Alcohol Concentration

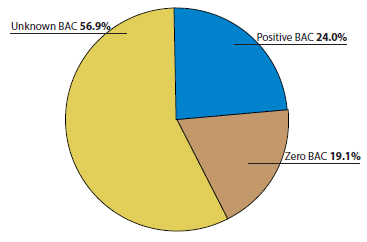
Driver alcohol involvement in fatal opposing-direction crashes that are speeding related are shown in Figure 72. Blood alcohol concentration was not known in the majority of crashes (56.9 percent) while 24.0 percent had a positive BAC.

The distribution of vehicles involved in speeding- related fatal opposing direction crashes by BAC is as follows: positive BAC, 24 percent; zero BAC, 19.1 percent; unknown BAC, 56.9 percent.
Figure 72: Distribution of Vehicles Involved in Speeding-related Fatal Opposing Direction Crashes by BAC
(Source: FARS 2010 – 2012)

4.7.3 Surface Condition

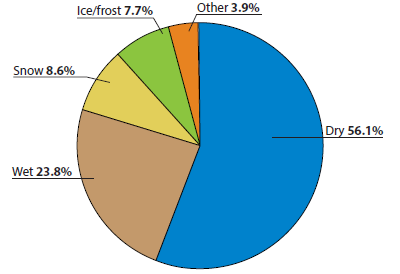
Roadway surface condition for speeding-related, fatal, opposing-direction crashes is shown in Figure 73. As noted, the majority of vehicles were traveling on dry road conditions (56.1 percent). A large number of vehicles involved in opposing-direction crashes were also on wet (23.8 percent), snow-covered (8.6 percent), or ice/frost-covered (7.7 percent) roadway surfaces.

The distribution of vehicles involved in speeding-related fatal opposing direction crashes by roadway surface is as follows: dry, 56.1 percent; wet, 23.8 percent; snow, 8.6 percent; ice/frost, 7.7 percent; other, 3.9 percent.
Figure 73: Distribution of Vehicles Involved in Speeding-related Fatal Opposing Direction Crashes by Roadway Surface
(Source: FARS 2010 – 2012)

4.7.4 Vehicle Type

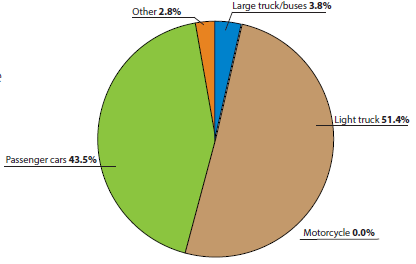
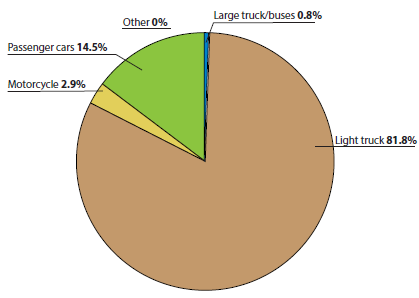
Vehicle involvement in fatal opposing-direction crashes that are speeding related is shown in Figure 74. As noted, light trucks make up the majority of fatal-involvement crashes (81.8 percent) followed by passenger vehicles at 14.5 percent.

The distribution of vehicles involved in speeding-related, fatal, opposing-direction crashes by vehicle type is as follows: light truck, 81.8 percent; motorcycle, 2.9 percent; passenger cars, 14.5 percent; large truck/buses, 0.8 percent.
Figure 74: Distribution of Vehicles Involved in Speeding-related, Fatal, Opposing-Direction Crashes by Vehicle Type
(Source: FARS 2010 – 2012)

4.8 CHARACTERISTICS OF TREE CRASHES

Crashes involving trees as the first harmful event make up 14.1 percent of all fatal roadway departure crashes and account for 18.0 percent of those that are speeding related. Tree crashes occur predominantly on rural roadways (68.8 percent), with 31 percent occurring in urban areas.

4.8.1 Speed Limit

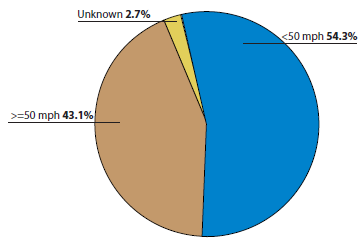
Figure 75 shows the distribution of vehicles involved in fatal roadway departure crashes that were coded with hitting a tree as the first harmful event by speed limit. As shown, around 43 percent of vehicles involved in speeding-related tree-impact crashes were on roadways posted 50 mph or higher. Fifty-four percent of vehicles were on facilities signed lower than 50 mph.

The distribution of vehicles involved in speeding- related, tree-impact, fatal crashes by speed limit is as follows: less than 50 mph; 54.3 percent; greater than or equal to 50 mph, 43.1 percent; unknown, 2.7 percent.
Figure 75: Distribution of Vehicles Involved in Speeding- related, Tree-Impact, Fatal Crashes by Speed Limit
(Source: FARS 2010 – 2012)

4.8.2 Blood Alcohol Concentration

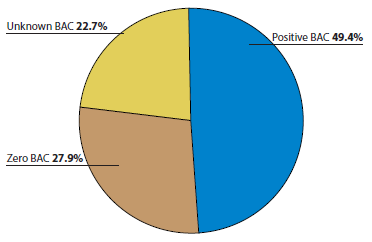
Driver alcohol involvement in fatal tree-impact crashes that are speeding-related are shown in Figure 76. Around 49 percent of drivers involved in fatal speeding-related roadway departure crashes had a positive BAC while almost 30 percent had no BAC. BAC was unknown for 22.7 percent of crashes.

The distribution of drivers involved in speeding- related tree impact fatal crashes by BAC is as follows: positive BAC, 49.4 percent; zero BAC, 27.9 percent; unknown BAC, 22.7 percent.
Figure 76: Distribution of Drivers Involved in Speeding- related Tree Impact Fatal Crashes by BAC
(Source: FARS 2010 – 2012)

4.8.3 Surface Condition

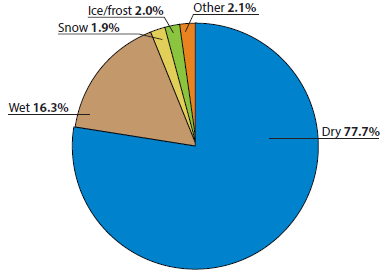
Roadway surface condition for speeding-related, fatal, rollover/overturn crashes is shown in Figure 77. As noted, the majority of vehicles involved in these crashes were on dry roads (77.7 percent) and 16.3 percent were on wet roads.

The distribution of vehicles involved in speeding-related tree impact fatal crashes by roadway surface condition is as follows: dry, 77.7 percent; wet, 16.3 percent; snow, 1.9 percent; ice/frost, 2.0 percent; and other, 2.1 percent.
Figure 77: Distribution of Vehicles Involved in Speeding-related Tree Impact Fatal Crashes by Roadway Surface Condition
(Source: FARS 2010 – 2012)

4.8.4 Vehicle Type

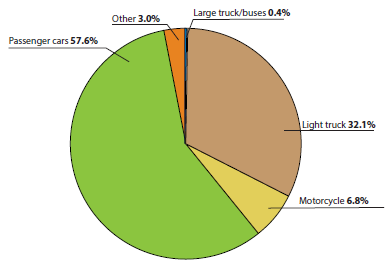
Vehicle involvement in fatal tree-impact crashes that are speeding related are shown in Figure 78. Passenger cars are involved in the majority of tree-impact, speeding-related, fatal crashes (57.6 percent) followed by light trucks at 32.1 percent.

The distribution of vehicles involved in of speeding-related, tree-impact, fatal crashes by vehicle type is as follows: light truck, 32.1 percent; motorcycle, 6.8 percent; passenger cars, 57.6 percent; other, 3.0 percent; large trucks and buses, 0.4 percent.
Figure 78: Distribution of Vehicles Involved in of Speeding-related, Tree-impact, Fatal Crashes by Vehicle Type
(Source: FARS 2010 – 2012)
Page last modified on April 29, 2016
Safe Roads for a Safer Future - Investment in roadway safety saves lives
Federal Highway Administration | 1200 New Jersey Avenue, SE | Washington, DC 20590 | 202-366-4000