


Chapter 2: Introduction to Safety Planning
This chapter provides an overview of the fundamentals and benefits of transportation safety planning, explains the need to foster a culture of safety, and introduces a six-step transportation safety planning process that agencies can use to integrate safety in their day-to-day activities and to develop an actionable safety plan. This chapter provides a high-level discussion on the basics of the transportation safety process for decisionmakers and those new to the process. Chapter 3 provides the details on how to execute the safety planning process.
2.A – INTRODUCTION AND BACKGROUND
Federal transportation funding legislation such as the Safe, Accountable, Flexible, Efficient Transportation Equity Act – A Legacy for Users (SAFETEA–LU), Moving Ahead for Progress in the 21st Century Act (MAP-21), and the Fixing America's Surface Transportation (FAST) Act have incrementally increased State requirements and resources to focus their efforts toward safety. This increased focus helps to address the more than 37,000 fatalities and hundreds of thousands injured on the nation's roadways annually. MAP-21 also requires States and MPOs to establish quantifiable targets for safety performance measures that track the number and rate of fatalities and serious injuries and the number of non-motorized fatalities and serious injuries. In response, agencies have increased the focus on safety and are taking a proactive approach to roadway planning and design, using performance measures to quantify progress in meeting agency goals. This movement is illustrated by the number of local and regional agencies developing and implementing safety plans that run in parallel to Federal and State efforts.
2.B – BENEFITS OF SAFETY PLANNING AND SAFETY PLANS
The primary goal of safety planning is to reduce fatalities and serious injuries on all public roads. A strategic, data-driven, multidisciplinary safety plan that is performance-based, and consistently evaluated and updated offers many benefits to regional agencies and local communities. Transportation agencies can use the following benefits of safety planning to engage new partners in the planning process:
- Reduce fatalities and injuries and support a zero deaths vision. Research demonstrates the importance of a safety plan in preventing traffic fatalities and serious injuries. Safety planning can help to set a goal of eliminating both fatalities and serious injuries within a specified timeframe. Clear and measurable objectives and the use of effective strategies help drive successful safety plans.
- Create a culture of safety across local, regional, and State agencies and communities. A safety plan can act as a springboard towards institutionalizing safety in transportation programs and projects within an MPO or local community. This can be accomplished through informing the public of safety planning efforts, creating a network of safety partnerships, and strengthening traffic safety enforcement policies and practices.
- Strengthen and develop collaborative partnerships among stakeholders. Establishing collaborative arrangements where partners regularly work together builds trust and understanding and will lead to the development of a successful safety plan. These collaborations help expand the initiative to the broader safety community and foster widespread understanding and support for safety priorities. Dramatic improvements in roadway safety are more likely to result from a collaborative effort among various stakeholders than from efforts within a single agency. In addition, collaborative relationships established during the development and implementation of the safety plan can provide helpful insights; learning from the experiences of others helps to identify and proactively remove obstacles.
- Promote data-driven decision-making. A data-driven process will help to prioritize resources to projects and programs with the greatest potential to reduce fatalities and serious injuries. Transportation agencies should use data to identify safety problems, select appropriate strategies and countermeasures, monitor progress toward achieving goals and objectives, measure strategy effectiveness, identify needed improvements, and direct limited resources to the highest potential for reducing fatalities and serious injuries.
- Share resources to accomplish a common mission. Collaboration between stakeholders helps to effectively support safety initiatives and to minimize duplication of effort. A shared plan allows agencies to enhance how funds are used by stakeholders. Collaboration also brings new partners and further expands resources to assist with safety plan implementation.
- Prioritize funding for safety. A safety plan brings the potential for sharing financial resources through safety planning collaboration. Prioritizing solutions for safety issues that affect multiple jurisdictions can strengthen development and funding for projects. Prioritization also curbs the practice of allocating funds to the most popular projects and promotes an equitable portfolio of projects.
2.C – PERFORMANCE–BASED PLANNING
Performance-based planning and programming applies performance management principles to transportation system policy and investment decisions, providing a link between management and long-range decisions about policies and investments that an agency makes in its transportation system. Performance-based planning and programming is a system-level, data-driven process to identify strategies and investments. The experience of State SHSPs and local Vision Zero efforts show that a performance-based framework plays an important role in driving the success of a safety plan.
Figure 2 shows a framework for a performance-based planning approach and identifies the primary process elements of an analytic approach to transportation planning and programming. States and MPOs are required to establish targets for safety performance measures, and a performance-based approach to safety planning helps to meet the targets. Although it is not required, local communities can also benefit from establishing performance metrics. Adopting a performance-based approach that tracks progress and results provides an accountable foundation for developing, implementing, and evaluating safety plans and will result in a plan with clearly defined strategies and desired outcomes. The FHWA Transportation Safety Planning webpage provides more information about integrating safety into this approach.
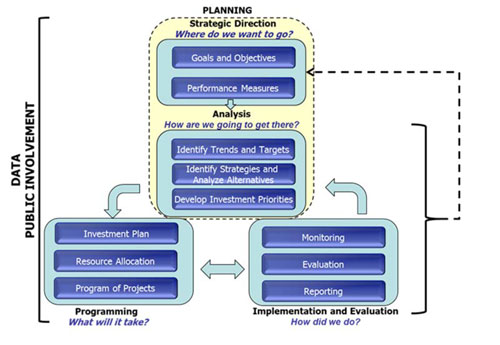
Figure 2. FHWA's performance-based planning approach.
Source: FHWA Office of Planning Performance Based Planning and Programming Guidebook
A performance-based safety planning framework also needs to involve the participation of stakeholders and the public. Their participation helps to inform the selection of goals, objective, and performance metrics for a safety plan. Their participation is also needed to interpret the results of performance and to contribute to the decision-making process of selecting and prioritizing safety projects. For example, the SHSP requires collaboration not only between agencies at the State level, but also with agencies at the regional, local, and tribal level to help inform strategic direction and coordination of common safety efforts. Although MPOs and local communities are not subject to the same requirements, they can use the SHSP as a foundation to develop, implement, and evaluate their safety plans. This will help move MPOs and local communities toward improving their safety outcomes. The experience of Vision Zero cities has shown that equity and Safe Systems contribute to how projects are prioritized in the performance-based planning process.
There are resources available to assist agencies with their regional and local efforts. Notably, FHWA provides technical assistance and guidance to transportation agencies on proactive approaches to addressing safety, including developing SHSPs and local road safety plans, implementing low-cost safety countermeasures, and improving data. FHWA's Strategic Highway Safety Plan Champion's Guidebook provides more information on the SHSP process and reviews the basic principles and important considerations in the development, implementation, and evaluation of an SHSP. FHWA's Building Links to Improve Safety: How Safety and Transportation Planning Practitioners Work Together is a toolkit of strategies to integrate safety and transportation planning processes and provides examples of how transportation and planning practitioners can work together. Additional information on the SHSP performance-based approach is available in the FHWA documents Strategic Highway Safety Plan Guidance and SHSP Quick Reference Guide.
Additionally, theVision Zero Network, a nonprofit group supporting the Vision Zero work of jurisdictions from across the United States, provides a pamphlet, 9 Components of a Strong Vision Zero Commitment,that describes essential safety planning elements experienced by early-adopter Vision Zero cities that MPOs or local communities can follow.
2.D – ESTABLISHING AND FOSTERING A CULTURE OF SAFETY
Vision Zero and Toward Zero Deaths strive to institute transformational change in transportation policies, engagement, planning, engineering, and implementation that will change behaviors and promote the premise that no lives should be lost on our roadways. At the onset and throughout the safety planning process, MPOs and local communities should consider establishing and fostering a culture of safety, which incorporates safety in decision-making and encourages roadway users to avoid risk-taking behaviors. Establishing a safety culture requires time as changes in values, beliefs, and attitudes build upon each other to affect behaviors. Throughout the safety planning process, MPOs and local communities will need to communicate and promote strategies for the larger community's participation.
MPOs and local communities may consider several resources available during this stage of the safety planning process. One such resource is the Toward Zero Deaths National Strategy that introduces a Traffic Safety Culture (TSC) model – a descriptive and predictive model that illustrates how social factors influence the acceptance of safety strategies (Figure 3). For more information on the TSC model and steps to establish a culture of safety, download the Toward Zero Deaths National Strategy.
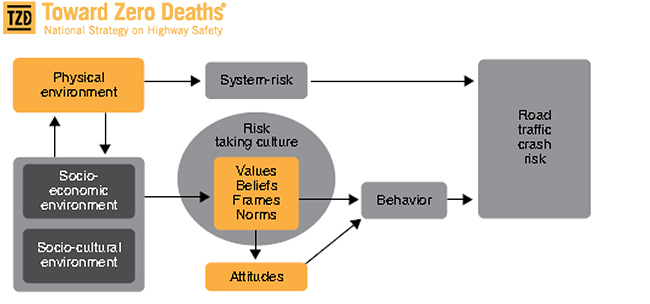
Figure 3. Toward Zero Deaths traffic safety culture model.
Source: Toward Zero Deaths National Strategy
Institute the Safe Systems Approach
As a core principle of the zero deaths approach, Safe Systems studies the interactions among roadways, vehicles, and road users; and recognizes that human errors are inevitable. Safe Systems encourages policy makers, planners, and engineers look for holistic solutions and design a transportation system that helps prevent such errors from resulting in serious or fatal outcomes. It prioritizes safety over other goals and ensures that in the event of a crash, the impact is tolerable to human bodies.
It is critical that Safe Systems is instituted during the safety planning process and followed through the implementation and evaluation stages. At the least, it should guide the selection of strategies and countermeasures to ensure that the safety improvements are systemic and targeting all road users, even when they make mistakes.
Know That Speed Matters
Safe speed is a pathway toward a safer transportation system and speed management is one way to institute the Safe Systems approach. One of the strategies of the Portland, Oregon's Vision Zero program is to manage speeds that result in safer conditions for all road users. As local communities are responsible for setting speed limits, it is natural that speed is regarded in the local safety planning process. Speeding is involved in roughly one-third of traffic fatalities yet speeding carries far less social stigma than drunk driving, a problem similar in scope. The National Transportation Safety Board (NTSB) study Reducing Speeding-Related Crashes Involving Passenger Vehicles examined the significant problem excessive speeds pose for traffic safety. The NTSB made recommendations for adjusting speed limits, enforcing speed limits, implementing automated speed enforcement, adopting vehicle technologies, and building greater awareness of speed as a traffic safety issue. These recommendations can help inform discussion of speed-related strategies for inclusion in a safety plan or other safety initiatives such as speed enforcement in school zones or work zones.
With this knowledge, MPOs and local communities can look to the State for partnership. The State SHSP may have strategies to address speeding. The State Highway Safety Plan (HSP) required by NHTSA also includes a performance metric, as required in 23 CFR § 1300.11(c), to measure the number of speed-related fatalities in the State. MPOs may develop a similar metric for the region and constituent jurisdictions and include it as part of the regional safety plan. Local communities can also adopt a metric to address speeding. MPOs and local communities are taking approaches to reduce travel speeds such as designing streets to address speed in high-injury locations, lowering speed limits to fit context, developing neighborhood calming programs, and if allowed, instituting automated speed enforcement programs. For example, Chicago's Vision Zero plan includes speed management and speed prevention as key strategies. The city also set an interim goal to reduce speed-related crashes—its greatest contributor of traffic deaths—by 25 percent by 2020. MPOs do not set speed limits; however, they can promote greater awareness about the negative impact of higher speeds in a crash. Regional safety planning efforts can include coordination of activities between constituent communities to address risky-driving behaviors such as speeding. For example, Pennsylvania has a State Speed Management Action Plan that involves the State MPO consortium.
Consider Additional Safety and Equity Factors
MPOs and local communities will need to acknowledge existing inequities within the transportation system to change the safety culture. This includes considering the most vulnerable users and underserved populations and identifying stakeholders and agencies that understand their needs, such as the public health community.
Crash statistics further illustrate the need for increased attention to socioeconomic disparities, with socioeconomically disadvantaged populations carrying a disproportionate burden of traffic-related fatalities and injuries. A study by the publication Governing based on National Highway Traffic Safety Administration (NHTSA) Fatality Analysis Reporting System (FARS) data showed that pedestrian deaths are much more common in poor neighborhoods in urban areas than in wealthier ones.
Communities are focusing their attention and resources to those areas with the greatest need and are also engaging in valuable and often difficult conversations to address the intersection of transportation safety and social justice issues. Active engagement and coordination in these communities helps to promote the shared responsibility of providing a safe and equitable transportation system for all stakeholders. Communities can address equity by prioritizing safety improvements in communities of concern—areas with low income and education levels, high concentrations of seniors, low rates of vehicles ownership, high obesity rates, and high numbers of schools and community centers. Also, as more people choose to walk and bike, means increased exposure to vehicles and other risks. The Vision Zero Network offers several equity-related online resources.
The Boston MPO has established a goal of making all transportation modes safe for all users. In 2016 and 2017, the Boston MPO undertook a Unified Planning Work Program (UPWP) study, Systemwide Title VI/Environmental Justice Assessment of TIP Projects , to develop a methodology for determining whether TIP programmed projects will cause disparate impacts for minority populations and disproportionate burdens for low-income populations.
As another example, Denver's Vision Zero effort recognized that increasing enforcement efforts (or even the perception of that), especially in communities of concern, could inadvertently exacerbate tensions and problems in the very communities the city is aiming to serve. The city decided to prioritize street design and education strategies rather than enforcement in these areas. Denver also incorporates equity and demographic considerations into law enforcement training that helps to build public trust.
2.E – ESTABLISHING A SAFETY PLANNING PROCESS FOR SUCCESS
This section outlines a six-step safety planning process, adapted from FHWA's Local Roads Safety Planning and SHSP processes, for MPOs and local communities to consider when developing, implementing, and evaluating safety plans. Although regional and local plans do not need to adhere to the requirements States follow for their SHSPs, the requirements help form a proven process to follow that MPOs and local communities can adapt to best meet their needs.
Figure 4 displays a sample process with the steps to develop a transportation safety plan. The following sections provide an overview of each step as well as a definition of key terminologies. Chapter 3 of this Guide discusses the components in greater detail and provides additional links to references and resources to help MPOs and local communities in the safety planning process.
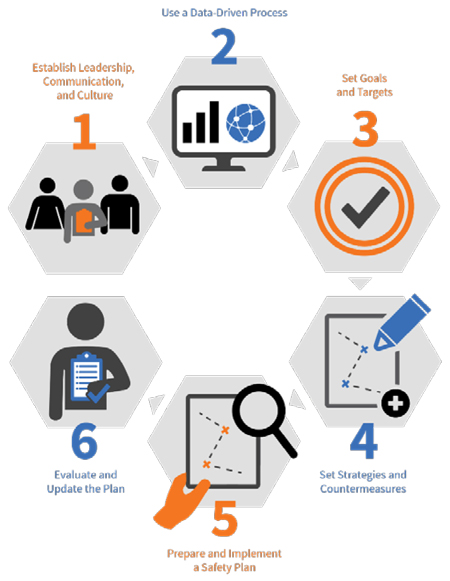
Figure 4. Steps to develop a safety plan.
Source: VHB
 1. Establish Leadership, Communication, and Culture
The first step of the safety planning process involves engaging stakeholders and identifying leaders, defining communication protocols, and identifying the necessary elements to instill a safety culture into the community. The stakeholders will define for the safety plan:
- Vision: A concise expression of what the plan is expected to accomplish.
- Mission: What stakeholders will do to reach the vision.
- Goal: A broad statement that describes a desired end state.
The overall vision statement in the MPO or local community safety plan should be supported by agency-wide goals and objectives. This first step also needs to identify leaders who will champion the overall effort and help to coordinate the day-to-day activities of the safety plan.Â
 2. Use a Data-Driven Process
MPOs and local communities should use a data-driven approach to understand transportation safety priorities. Data helps to drive strategic direction, vision and goal setting, project selection and prioritization, location selection, and crash factor identification. The collection and analysis of crash data helps to identify emphasis areas to before identifying strategies.
An emphasis area helps to achieve the safety plan vision and mission by addressing specific safety issues identified during the data analysis.
Each emphasis area is comprised of one or more strategies that help to resolve the identified traffic safety issue.
The data-driven decision-making process will push the safety plan toward emphasis areas and strategies with the greatest potential impact to reduce fatalities and injuries. The plans should use the best available safety data to identify critical highway safety issues and safety improvement opportunities on all public roads. The data are also used to track and evaluate the progress of the safety plan and helps to inform any adjustments that are needed to improve the plan's performance.
 3. Set Performance Measures and Targets
The safety planning process needs meaningful and realistic objectives and targets to meet the desired vision, mission, and goal. This helps to establish a performance-based approach to measure and evaluate the progress and success of safety planning programs. An agency should consider the following definitions when setting objectives and targets as part of the performance-based safety planning approach:
- Objective: A specific and measurable statement that supports achievement of a goal. Each emphasis area can have one or more objectives to address a safety issue.
- Performance measure: A metric used to assess progress toward meeting an objective.
- Target: A specific level of performance desired in a certain timeframe.
A consistent approach helps to set safety performance targets. Safety initiatives at State, regional, and local levels will be more effective if safety partners direct resources toward meeting the same target. FHWA's Safety Performance Management website provides additional information on target setting practices.
 4. Select Strategies and Countermeasures
The lead agencies can consult available resources to investigate and narrow the list of strategies down to a final set that has the best potential to reduce fatalities and serious injuries. While some of the resources are for a national or State audience, many of the techniques and recommendations are valid for regional and local application. Each strategy is accompanied by one or more activities, or countermeasures, that effectively reduce fatalities and serious injuries. The implementation of a countermeasure constitutes an action that is included in the safety plan.
 5. Prepare and Implement a Safety Plan
This step results in a publicly accessible safety plan that provides a prioritized list of strategies and actions, identified funding sources, and a method to track their implementation. The safety plan includes a summary of the identified needs, vision, goals, and objectives important to the MPO or local community. The safety plan document will identify a focus for future efforts, serve as a guide for stakeholders and partners, and will create a link between the goals and objectives of the plan.
The implementation of the safety plan also requires marketing efforts to engage the public in safety activities. Â
 6. Evaluate and Update the Plan
The final step of the safety planning process is to establish regular review cycles to measure progress, identify success, determine challenges to implementation, and identify opportunities to amend. Evaluation helps to re-prioritize existing resources to better align with safety goals. The transparency of an evaluation process is critical for accountability during the implementation of a safety plan.
LOCAL SAFETY PLANNING PROCESS CHECKLIST
This chapter introduced high-level concepts that an MPO or local community can consider when developing a safety plan. The following is a review of the concepts introduced in this chapter:
- Understand the benefits of a transportation safety plan.
- Understand the importance of a performance-based approach.
- Understand safety culture, equity, and speed.
- Review the Traffic Safety Culture model.
- Review equity resources, such as those found at Vision Zero Network's resource page.
- Review speed-related resources, such as NTSB's study Reducing Speeding-Related Crashes Involving Passenger Vehicles.
- Consult additional resources related to SHSP, TSP, and Vision Zero
- Study the six-step safety planning process:
- Establish and foster a culture of safety throughout the process and collaborate with diverse safety stakeholders, including engagement with the public to incorporate their experiences and needs.
- Use data-driven approaches to identify key safety issues.
- Set measurable targets.
- Select and implement effective strategies and countermeasures.
- Document the plan.
- Continue to evaluate and update plans.
Chapter 3 includes additional detail to help MPOs and local communities put the six-step safety planning process introduced in this chapter into action.