


Chapter 3: The Safety Planning Process
MPOs and local communities developing a safety plan may find themselves faced with several questions. What are the steps we need to take to get our plan in motion? How can we develop an implementable safety plan that is well-aligned with community and State safety priorities? This chapter expands on the six steps to support safety plans discussed in Chapter 2. Where applicable, this chapter shows tips and procedures specific to MPOs or local communities, respectively.
 3.A – ESTABLISH LEADERSHIP, COMMUNICATION, AND CULTURE
The following sections expand upon the concepts identified in Chapter 2 to further explore the importance of identifying leaders, engaging of a variety of stakeholders, and coordinating communication to promote a culture of safety in the planning process.
Identify Partners and Leaders
The 4 E's of Safety
The 4 E's of safety define the broad stakeholder partners involved in transportation safety. Stakeholders from the 4 E's are typically from the following:
- Engineering: highway design, traffic, maintenance, operations, and planning professionals.
- Enforcement: State and local law enforcement agencies.
- Education: prevention specialists, communication professionals, educators, and citizen advocacy groups.
- Emergency response: first responders, paramedics, fire, and rescue.
When developing safety plans, MPO and local communities will need to identify and engage all potential stakeholders with interest in the safety planning effort. The first step is to assess existing relationships and build on similar collaborative efforts. To do this, agencies should organize lists of stakeholders to make sure all types of potential participants are covered. Stakeholders include those actively engaged in traffic safety and those who have yet to realize their potential contributions to the effort. The traditional 4 E's of safety—engineering, enforcement, education, and emergency response—define the broad stakeholder partners engaged in safety and are responsible for making the roads safe for all users. Representatives of the 4 E's can bring a unique perspective to the safety plan: engineers approach a safety problem from the roadway and vehicle perspectives; law enforcement focuses on road user behavior; education concentrates on prevention; and emergency response personnel handle post-collision care. The stakeholder lists may include the types of participants by agency category, such as representatives of the 4 E's, businesses, advocacy groups, citizens, Tribal, and local governments. Newly developed safety plans have started to introduce additional E's in safety planning—equity, everyone, engagement, and evaluation—to acknowledge the importance of an inclusive process. Non-traditional partners include public health organizations, freight carriers, and technology companies. See Table 1 for more suggestions of partners. The goal of this step is to highlight any missing or underrepresented stakeholders and then broaden the base to form a multi-disciplinary team.
Some potential partners may not be as engaged or appear to be resistant in the safety planning process; however, transportation agencies can overcome or prevent that barrier by clearly defining expectations. No matter the size of a contribution, an agency's participation and contribution is always important. An inclusive safety planning process will allow for partners to be comfortable with their desired level of engagement. They will clearly understand how their involvement will benefit the community and their agency. Showing these partners the Benefits of Safety Planning and Safety Plans section in Chapter 2 of this Guide can assist MPOs and local communities to communicate additional benefits of safety planning.
The South Central Planning and Development Commission (Houma, LA), in its efforts to facilitate a safety stakeholder coalition, uses a 4 E approach to identify its stakeholders and to foster multi-disciplinary communication and coordination. The region also works closely with other coalitions across Louisiana as well as with the State SHSP to coordinate resources and priorities.
| Agency Category | Types of Agencies |
|---|---|
| Engineering | Public Works, Traffic Engineering, Transportation Planning |
| Enforcement | Local Community Police, County Police, State Police, Campus Police, Court System |
| Education | School Board, Department of Motor Vehicles, Driving Schools, Public Health Department |
| Emergency Response | Hospitals, Fire Department, Ambulance Services |
| Other | Transit Agencies, Modal Advocacy Groups, Non-Profits, Public Health, Freight Companies, School Districts, Office of Senior Services, Traffic Records Coordination Committee |
Once MPOs and local communities identify partners, they will need to establish leadership responsibilities for facilitating the safety plan. This is critical to the success of the safety plan and may take the shape of an executive committee representing leadership from a variety of agencies responsible for championing, promoting, and shepherding safety initiatives and culture. Participating partners should identify how their agency can contribute to the implementation of the plan in terms of resources and technical expertise. The group can meet periodically to address issues related to safety planning development and implementation and provide recommendations for further action. This group can also provide the final input or recommendations for project prioritization before decision-making groups review and approve.
Safety planning leaders provide direction through their enthusiastic support of safety initiatives, bring organizational skills to the effort, and actively encourage commitment and participation from all stakeholders. Leaders help secure the necessary resources, visibility, support, and commitment of all partners. Once the plan is complete, leaders guide the implementation and evaluation of the plan and promote the safety mindset the community is working to achieve.
Some jurisdictions appoint full-time safety coordinat orsto support the plan and report progress to executive officials and working group members. Some coordinators are located at a central office, while some are in agencies such as a transportation department or planning department. An MPO or local community can also assign a designated leader for the safety plan and identify leaders for any emphasis areas within the plan.
To help identify leaders, transportation agencies should consider the following list of characteristics, roles, and responsibilities.
Characteristics of a Leader:
- Creative, energetic, and passionate about safety for all.
- Forward-thinking.
- High-level of interpersonal communication skills.
- Understanding and respect of other point of views.
Roles and Responsibilities of a Leader:
- Provide enthusiasm for the vision and mission.
- Bring organizational skills.
- Promote relationship building and sustain stakeholder engagement.
- Maintain the focus and direction of the safety plan.
- Be a point of contact for safety plan related activities, programs, and projects.
- Manage or designate meeting coordination and oversight of emphasis area working groups.
- Provide assistance to overcome barriers affecting the plan.
- Coordinate the data-driven process to support the plan.
- Supply routine updates to stakeholders (including the public).
- Engage the public throughout the process.
Local agencies with successfully adopted safety plans report that buy-in from the executive level, such as a mayor, a regional commissioner, and elected officials is an essential step to advance safety efforts. Political buy-in can advance safety through changes in policy and institutional practices, such as issuing executive orders or initiating pledges to support the safety plan. However, these positions may experience turnover due to changes in administration and election cycles. Therefore, individual agencies should consider establishing provisions that establish continuity of transportation safety programs and culture. When leaders or stakeholders depart, their replacements should be engaged in the process as soon as possible.
Several communities are using public health tools to advance their safety planning efforts.San Francisco is using hospital data to better inform safety decision-making. Chicago aligned its Vision Zero effort with its citywide public health plan. New York engaged public health agencies to identify research and evaluation topics to better understand how best to implement Vision Zero. In an effort to bridge the gap between potential partners, the American Public Health Association has developed several resources and case studies to show the linkage between transportation policy and health outcomes.
The Vision Zero Network's Collaborating Across Departments for Vision Zero case study provides examples of communities that conduct regular multi-agency collaborative meetings and develop shared goals and accountability measures to advance the implementation of safety plans. This includes New York City's task force, steering committee, and working group. At the regional level, the Central Texas Council of Governments (Dallas, Texas) has a regional safety advisory committee that meets quarterly to discuss and prioritize regional safety initiatives.
Engage Member Organizations and Jurisdictions.
Eugene, Oregon has a Vision Zero Task Force to guide the development of its safety plan. Those who serve on the task force act as liaisons to the communities, organizations, and agencies they represent. In addition, the city has a Vision Zero Technical Advisory Committee whose members offer technical expertise in the development, implementation, and evaluation of the various actions contained in its plan.
Ongoing and frequent meetings have worked for several agencies. For example, the Tri-County Regional Planning Commission (Lansing, Michigan) Traffic Safety and Operations Advisory Working Group has a framework to meet monthly to quarterly to discuss highway safety planning, congestion management, signal operations, and Intelligent Transportation System (ITS) planning among other issues. The Houston-Galveston Regional Council(Houston, Texas) regional safety council meets quarterly to discuss regional safety issues and developed a set of bylaws and operating procedures to govern regional traffic safety activities in the region.
As MPOs and local communities identify stakeholders, they should begin to define an organizational strcture to support the safety plan development, implementation, and evaluation. This process will define stakeholders' roles and level of engagement in the safety planning process. Defining an organizational structure does not need to be a complex process. This can be as simple as establishing a three-tiered structure of stakeholder engagement: communication, planning, and decision-making.
The communication level is the broadest and includes all stakeholders that can provide input and add support to the safety planning process. This includes identifying opportunities to continually inform the public of safety programs and the development, implementation, and evaluation of safety plans. The planning level engages a more focused group of stakeholders, such as technical experts, more intimately involved in the day-to-day processes. The decision-making level should encompass stakeholders from agencies or institutions with the ability to influence transportation system and policy changes that improve safety.
After stakeholders are identified, MPOs and local communities will need active collaboration from the partners. The success of the safety plan relies on a collaborative environment: one agency or individual alone cannot be responsible for the initiatives laid out in a safety plan. Every stakeholder will need to contribute to implementation, which is best achieved when stakeholders have vested interest in the vision of safety and associated initiatives.
MPOs and local communities can use one or more of the following mechanisms to encourage active participation and institutionalize safety:
- Establish a safety planning committee with governing by-laws.
- Develop a memorandum of understanding among agencies.
- Establish reporting procedures that require regular updates and reporting from partner agencies.
- Identify a leader from each agency responsible for maintaining momentum for safety efforts at their respective agency.
- Institute a standing agenda item at policy boards or other relevant committee meetings.
- Develop a one-page summary or pamphlet that describes the importance of transportation safety.
Agencies may consider establishing a technical committee to manage the development and implementation of the safety plan. This group reports to the executive committee and provides oversight on implementation of actions within the safety plan. The working group is comprised of representatives from different technical disciplines and represents the different emphasis areas addressed in the safety plan. An MPO comprised of many jurisdictions may consider establishing sub-regional safety groups to manage communication, while a local community with many districts or wards may need to split into subarea groups.
Ultimately, stakeholders and partners need to institutionalize safety in their transportation planning processes. NCHRP Report 811: Institutionalizing Safety in Transportation Planning Processes: Techniques, Tactics, and Strategies provides a good overview of approaches to institutionalize safety. Organizational training also has value to help expand safety planning efforts and MPOs can play a useful role in coordinating training resources and opportunities for local community staff working on safety improvement programs.
Engage the Public and Adopt a Vision, Mission, and Goal
Jurisdictions with adopted safety plans often publicize clear vision, mission, and goal statements of eliminating traffic fatalities and serious injuries from the onset. In communities across the country, mayors and top decisionmakers are engaging directly in traffic safety initiatives by committing publicly to a vision for safety and encouraging increased attention and collaboration across local community agencies. This helps establish conditions under which the safety plan takes place. Participants in the safety planning process will follow this vision as they engage in the various actions in the plan. The public should also have a voice at committee or safety project meetings during every phase of the safety planning process. Early engagement will shape the strategies and build public understanding of the value of a safety plan.
Communities are encouraging their executive leaders, agencies, and the public to commit to safety. Portland's Vision Zero website includes a web-based pledge form comprised of questions as well as supporting statistics that explains crashes in the city. The Alamo Area Metropolitan Planning Organization (San Antonio, Texas) developed a resolution in support of Vision Zero for San Antonio and other communities in the region
In several jurisdictions, the public provided input via surveys and answered questionnaires to enumerate concerns with safety and to commit to a vision, mission, and goal for safety. In New York City, the public had access to an interactive map to pinpoint safety concerns. Similar to the previous discussion of agency stakeholders, for large jurisdictions, it is beneficial to conduct multiple public meetings to cover the different steps of the safety planning process. Multiple meetings also cover the various areas of the MPO or local community and to gain perspectives from different audiences.
The Sun Corridor MPO (Casa Grande, Arizona) Strategic Transportation Safety Plan includes an appendix that contains all the information and feedback from public meetings, stakeholder meetings, Board of Supervisor presentations, executive board presentations and city council presentations as well as newspaper articles and online mapping tool results.
Coordination with Other Plans and Efforts
Safety initiatives are more effective when they capitalize on resources of other planning and programming activities such as overall transportation, congestion, and air quality. MPOs and local communities can look for opportunities to incorporate or link to other regional, local, State DOT, State Police, and State Highway Safety Office (SHSOs) efforts. This includes links to the SHSP and the HSP. Developing a standalone transportation safety plan adds a more prominent public-facing element to safety planning instead of embedding safety within another plan.
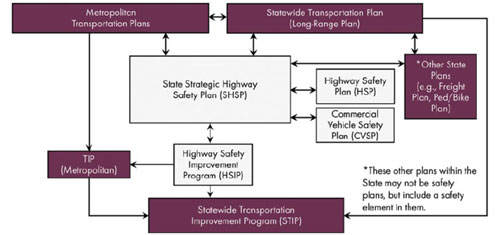
Figure 5. Relationships Between Required Safety Plans
Source:SHSP Champions Guide, FHWA.
There are several related plans at the State and regional level such as the Metropolitan Transportation Plan (MTP), the Statewide Transportation Improvement Program (STIP), and the Transportation Improvement Program (TIP). An MPO or local community safety plan should also engage stakeholders involved with these and other safety planning and programming processes. These stakeholders can help to incorporate the goals and strategies of the SHSP into the MPO or local community safety plans, as appropriate. MPOs and local communities should also consider related efforts, such as emergency response planning and modal planning. In turn, the SHSP should consider the results of the MPO and local community safety planning processes and outcomes. Figure 5 displays relationships between required safety plans in the non-shaded boxes and other transportation plans shown in shaded boxes.
MPOs and local communities should involve stakeholders with knowledge of existing plans to better link priorities and actions and increase effectiveness through coordinated efforts. Examining existing plans can also provide ideas for the potential emphasis areas, strategies, and actions. An emphasis area is an area of focus in a safety plan that highlights a key crash type as identified by data. Example emphasis areas in State-level safety plans include impaired driving, distracted driving, and intersection crashes. A strategy details how the jurisdiction will achieve a goal under an emphasis area. An example strategy is to conduct high-visibility enforcement to combat impaired driving. An action is an activity to implement a strategy and is measurable. Following the example strategy, an example action is the number and/or location of high-visibility enforcement campaigns.
The following provides examples of roles that MPOs and local communities can play when coordinating safety planning with other similar efforts.
MPOs:
- Coordinate safety efforts with localities in the region.
- Invite and sustain municipal participation in regional safety efforts.
- Set and monitor regional safety goals.
- Develop performance targets or adopt State targets and track progress.
- Administer transportation grants, funding, and programs.
- Participate in county and local community safety efforts.
- Provide data access to local, county, and community agencies.
- Interact with local, regional, and State organizations.
Local Communities:
- Coordinate safety efforts at the municipal level, including the development of a safety plan.
- Participate in regional and State efforts such as safety partnerships, safety performance target setting, data analysis, and marketing.
- Integrate safety into other local transportation plans, including modal transportation plans.
- Interact with other local organizations.
MPO Perspective
As part of the outreach effort to engage safety partners across the region, MPOs will identify the varied safety needs from constituencies in the region. These needs, combined with a data analysis of safety issues in the region, helps to identify the key concerns that will drive investment in safety initiatives, both in infrastructure and in behavioral programs. MPOs should review the State SHSP, HSP, and HSIP to become familiar with statewide needs. Safety plans that align with the projects in the MTP, TIP, and SHSP can better advance safety planning efforts in a coordinated manner. MPOs can also use the emphasis areas identified in the SHSP to guide the types of activities that included in the UPWP. The SHSP Implementation Process Model describes how transportation agencies can integrate the State SHSP into regional long-range planning efforts and TIPs.
Local Community Perspective
With so many State, local, and regional plans, local communities must determine how best to incorporate and link the safety-related issues. This is a two-way relationship: the local community safety plan should acknowledge the goals and actions of other plans and those plans should include the local community plan's considerations. Transportation agencies at all levels should coordinate their planning efforts, resources, and implementation strategies to capitalize on the joint efforts. For example, Montgomery County, Maryland's Vision Zero plan connects its emphasis areas to the emphasis areas in Maryland's SHSP.
Prepare for Long-Term Success with Staff Turnover
An MPO or local community needs a consistent approach toward safety to maintain momentum throughout implementation, but staff turnover frequently presents a challenge. The lead MPO or local community responsible for the safety plan should establish provisions that lays the foundation for continuity of safety programs, such as identifying replacement staff and engaging new staff in safety initiatives as soon as possible. In addition, the lead agency can educate other safety partners and even contractors on safety policies and programs, so they can serve as an extension of the safety program.
Stakeholders should make every effort to maintain involvement and build institutional knowledge of safety within the agency or organization.
Minnesota DOT created a Traffic Safety Fundamentals Handbook to guide transportation practitioners, new and experienced, in both the public and private sector to maintain consistency in safety fundamentals. This handbook helps to inform the local transportation practitioner about crash characteristics, procedures to improve safety planning, crash analysis techniques, and the importance of consistency with the State SHSP. Each county in Minnesota develops its own county road safety plan.
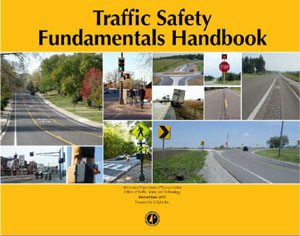
Figure 6. Minnesota Traffic Safety Fundamentals Handbook.
Source: Minnesota DOT
Conduct Strategic and Coordinated Outreach and Communication
Once stakeholders and the public are involved with the safety planning effort, MPOs and local communities need to sustain their participation. Maintaining communication is a key element of sustained engagement and should result in the optimization of stakeholder and public engagement throughout the safety planning process. MPO and local communities can use communication approaches to encourage greater interaction, provide updates, foster a culture of safety, and promote noteworthy achievements. Regular updates remind stakeholders of safety planning efforts, encourage continued participation, and celebrate successes. It is important to note that MPOs must conduct public involvement on Federally funded projects but local communities are not required to do the same.
Develop a Marketing Plan
MPOs and local communities need to market the development and implementation of the safety plan and promote cultural change on an ongoing basis to impact attitude and behavioral change in the community. Effective marketing can help promote the vision and goals of the safety plan to the public and encourage their involvement in implementation. This also encourages safety stakeholders to understand the vital role they play in saving lives and the importance of continued involvement. Agencies can develop marketing plans concurrent to the safety plan and may choose to initiate marketing efforts during the initial communication and stakeholder recruitment to publicize safety efforts at the start of the safety planning effort.
Marketing efforts should focus on education that helps reduce fatalities and serious injuries. Marketing can help promote the goals of the safety plan to the public and encourage them to become more involved in its implementation. This also encourages safety stakeholders to understand the vital role they play in saving lives and why their continued involvement is important. The importance of "one" message is critical to a successful marketing strategy. Stakeholders need to understand the foundational message that no fatality is acceptable on their roadways. Many stakeholders involved in the process have their own marketing methods and messaging. Every partner needs to agree to promote a shared vision for the plan and the future of the community. An MPO or local community may even consider engaging a marketing manager to promote safety plan efforts.
San Antonio developed a brochure for its Vision Zero effort to explain the purpose and need of safety efforts in the city. The city averages three outreach events per month from neighborhood meetings, school meetings, city-wide events, and more.
Attitude and behavioral change also play a key complementary part in the reduction of fatalities and injuries. The outreach components of the safety plan include actions that address road users and seek to modify behavior or attitudes. Some of these actions will likely need to be reinforced by the marketing efforts, which should promote the goals of the safety plan and participation by the public.
Marketing does not have to take place after the development of the plan. In fact, marketing can start with the initial stakeholders and public engagement at the beginning of the safety planning process. Marketing safety efforts early in the process introduces stakeholders and the public to the safety planning process and builds their engagement with safety activities.
The FHWA Implementation Process Model (IPM) Chapter 6 provides more information on how to market a safety plan.
Communicate the Value and Contribution of Safety Planning
During safety plan marketing efforts, an MPO or local jurisdiction should clearly detail the expectations for stakeholder participation but emphasize the value of collaboration and contribution. Developing a summary, pamphlet, or brochure can help to describe the importance of safety and communicate these messages.
The Network of Employers for Traffic Safety maintains a report that shows the cost of traffic crashes to employers in the United States. In 2013, this estimated figure was $47.4 billion. This emphasizes the potential benefit to society if improvements to safety are planned and implemented.
Columbia, Missouri's Vision Zero plan included public outreach with several town hall meetings and announcements.
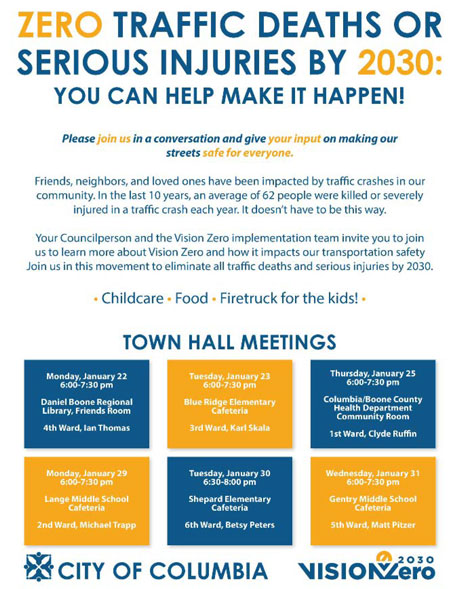
Figure 7. Public Engagement Flyer Example.
Source:City of Columbia, Missouri
Engage Regional and Local Media
The MPO and local community should consider how media reports on traffic safety issues in their region. Media can influence how the public understands traffic safety and may reinforce general perceptions of issues and solutions. Recent safety plans are moving towards presenting traffic safety as a community issue and not one solely based on individual responsibility. There is also the opportunity to engage with underserved communities and vulnerable populations to tailor messaging to their specific issues and connect with their media outlets.
A public information officer or communications staff at an MPO or at a local jurisdiction can establish and develop safety campaigns. The SHSO is an initial resource familiar with implementing traffic safety campaigns, some of which are funded by NHTSA. They are also familiar with strategic approaches to implement year-round efforts. NHTSA's Traffic Safety Marketing website is a useful tool for MPOs interested in learning about the basics of developing a communications program.
Traditional, formal approaches such as meeting reports, media events, newsletters, presentations, and informal approaches such as blogs, web sites, social media, and email blasts are all effective strategies as well. These communication approaches encourage greater interaction, provide updates, and promote noteworthy achievements. Regular updates remind stakeholders of safety planning efforts and encourage their continued participation and celebrate their successes.
A strong communication campaign for traffic safety is consistent and easily recognized. The New York City Vision Zero effort developed an internal document that outlined preferred language and terminology and graphic guidelines. Creating unified language for multiple agencies helps to create long-term engagement and buy-in for maintaining a consistent transportation safety planning approach. This required buy-in from city leaders and partner agencies. New York City also implemented a communications approach that resulted in motivational, positive messages and showed residents how to make safe transportation decisions. Additionally, San Francisco recognized that cultural change is the result of influences from policy to organizational practices to community education. The city took a proactive approach to change the culture of safety by crafting messages that appeal to different portions of the Spectrum of Prevention. The Prevention Institute, a non-profit organization that addresses equity, health, and safety by developing approaches for disease prevention, developed the Spectrum of Prevention and identifies six levels of intervention to help people move beyond the perception that prevention is merely education.
Communication Strategies to Advance Safety Planning: The Vision Zero Network's primer Communication Strategies to Advance Vision Zero shows examples of engagement with local media in New York City and San Francisco. The Vision Zero Network also developed the white paper Elevating Equity in Vision Zero Communications to show approaches that address equity through communications.
The Spectrum of Prevention
This was developed by the Prevention Institute and used by San Francisco's Vision Zero plan to craft messaging to different audiences.
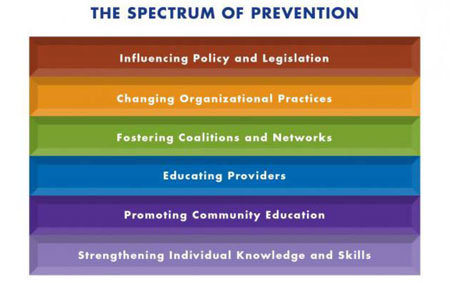
Figure 8. The Spectrum of Prevention.
Source: Prevention Institute.
Timing Outreach
The timing of outreach efforts affects the message conveyed to the public. Reactive outreach occurs in response to a crash. This outreach focuses on reminding the public about changing dangerous behaviors. An MPO or local community should consider this approach carefully—focus outreach on community organizations or institutions the crash affected and consider the best methods for reaching these groups.
Proactive outreach is a preventative technique to prevent crashes from happening. NHTSA conducts several campaigns throughout the year to elevate awareness of specific behaviors such as impaired driving, occupant protection, and teen driving. An MPO or local community can use established campaigns from NHTSA or develop material specific to their geographic area and issues.
Regardless of the selected method, the MPO or local community should use a data-driven approach—discussed in more detail in the next section—and examine the crash data to identify the target audiences and work with those communities to build positive outreach.
Establish Leadership, Communication, and Culture Checklist
- Understand and adopt approaches to coordinate communication:
- Review the stakeholder table and identify specific partners within each category to engage in transportation safety efforts.
- Identify a safety leader at each agency.
- Establish committees to address traffic safety issues and monitor implementation.
- Engage stakeholders and the public:
- Establish a standing safety item on policy board and technical committee agendas.
- Set-up by laws or a memorandum of understanding to formulate a decision-making process and authority concerning the safety plan.
- Solicit input from the public using surveys, questionnaires, and other interactive feedback tools.
- Hold public meetings in multiple phases of a safety plan and in different geographic areas.
- Coordinate with other plans to incorporate safety across all partners:
- Coordinate safety efforts across all plans that have a connection to safety.
- Foster collaboration and training in transportation safety planning activities.
- Prepare for long-term success and take steps to minimize knowledge gaps when there is staff turnover.
- Use marketing techniques to promote safety efforts:
- Engage the public information officer and/or communications staff in safety.
- Coordinate safety messaging with SHSO.
- Review NHTSA's Traffic Safety Marketing website.
- Develop traffic safety branding.
- Identify target audience.
- Apply positive messaging.
- Work with partner agencies to promote campaigns.
 3.B – USE A DATA-DRIVEN PROCESS
This step reinforces the importance of using data to inform safety planning. While engaging the various stakeholders involved in safety planning, a transportation agency will likely hear many competing ideas on how to invest limited transportation safety dollars. A data-driven approach, the hallmark of a successful safety plan, will help the MPO and local community narrow the focus of their efforts.
For information related to using data and analysis in the planning process, see Applying Safety Data and Analysis to Performance Based Transportation Planning.
Collect Safety Data
The first step is to collect and analyze available data. The types of data include information on crashes, roadway conditions, traffic volume, and other statistics that help explain safety factors. Before collecting the data, safety planning stakeholders will need to consider how they will use the data and what questions they need answered. Considerations may include the following questions:
- What do we want to know?
- What information is valuable for identifying needed actions?
- What level of analysis do we need?
- What data do we need? What data is available? How do we fill existing gaps?
- How could anecdotal information supplement traditional data?
Table 2 shows the types of primary data that agencies could collect and analyze to determine the trends and factors that affect regional traffic safety.
| Data Type | Federal | State | Local |
|---|---|---|---|
| Crashes | NHTSA or FHWA | State Police and/or Department of Transportation | Police Department/Emergency Medical Services |
| Roadway Conditions | FHWA | Department of Transportation | Department of Transportation |
| Traffic Volume | FHWA | Department of Transportation | Department of Transportation |
MPOs and local communities should collect many different data types to help with safety decision-making. Access to data will vary across State, region, and local community. For example, reports submitted by law enforcement officers generate crash data that may be managed by the State law enforcement agency, SHSO, or the DOT. DOTs maintain roadway and volume data. Other agencies may have data that could inform stakeholders about crash factors. This includes Departments of Motor Vehicles that maintain driver and vehicle records, Departments of Health that maintain injury surveillance, and court systems that maintain citation, prosecution, and adjudication data. If resources are available, agencies will benefit in the long-term from integrating data into a single source to assist with data analysis and progress reporting.
MPOs are using tools to inform their safety analyses.
The Southeast Michigan Council of Governments (SEMCOG) in Detroit, Michigan developed a Traffic Safety Manual to help its communities to identify information that is relevant to safety analysis, high crash location, significant crash patterns and causes, countermeasure service life and safety project benefit/cost ratios.
A State Traffic Records Coordinating Committee (TRCC) helps to maximize the overall quality of safety data and analysis across six core systems: crash, vehicle, driver, roadway, citation & adjudication, and injury surveillance.
States are required to collect a set of fundamental data elements for safety data analysis. MPOs and local communities should coordinate with their State for analytical tools or reports that already combine data sets. State resources include State DOTs and the Local Technical Assistance Program (LTAP). A Local Technical Assistance Program (LTAP) helps local agencies to broaden their transportation expertise through technical and management training and guidance. The FHWA Roadway Safety Data Program website provides more information on local data integration.
To complement data collection, an MPO or local community may engage stakeholders and the public with open data platforms. These tools allow the public to drop ‘pins' or comment on locations of concerns, supplementing a transportation agency's data collection efforts. Open data efforts in Washington, DC and New York City not only allows the public to contribute supplemental data for use in crash analyses, but also allows the public to conduct analyses.
Ultimately, transportation agencies will want to accomplish the following:
- Inventory the quality and availability of data resources.
- Develop data partnerships.
- Promote data sharing agreements.
Data integration is the method by which multiple data sets (e.g., crash, roadway, volume) from a variety of sources can be combined or linked to provide a more unified picture of what the data mean and how they can be applied to solve problems. Integrated data help agencies make informed decisions that relate to the stewardship of transportation infrastructure assets. The following are examples of agencies that have performed data integration to improve their safety data capabilities.
- The Delaware Valley Regional Planning Commission (DVRPC)Â Â in Philadelphia, Pennsylvania adopted innovative traffic data sharing practices.
- Arizona DOT developed procedures to import local and tribal data for safety analysis.
- Michigan DOT worked with local agencies to encourage a data-driven approach to local roadway safety.
- Louisiana DOT reduced data-collection costs to local agencies while ensuring data consistency.
- Ohio DOT developed the GIS Crash Analysis Tool (GCAT) that provides spatially-located data for use by State, regional, and local transportation practitioners.
- In Michigan and Washington State, the State DOT provides data analytics for their MPOs.
- In Maryland, transportation practitioners have access to the Risk Analysis of Vehicle Environmental Networks (RAVEN) tool to analyze crash and citation data overlaid onto the Maryland roadway network.
Presenting Data Analysis Results
Once the data analysis is complete, MPOs and local communities need to summarize the results in a manner that provides meaningful and useful information. The results of the data analysis will also contribute to developing interim goals and targets that will drive the performance of the safety plan and move it toward the overall vision, mission, and goal. MPOs and local communities will also use the data inform the selection of their final countermeasures. A high-injury or crash network map as previously described provides valuable insight into the geography of crashes. MPO and local communities can also organize the results of the data analyses by the selected emphasis areas. Ultimately, the generated data reports will describe crash frequency, crash averages, crash trends, and crash rates. The FHWA Roadway Safety Information Analysis resource provides an overview of how to analyze and summarize data.
Southeast Michigan Data Portal
SEMCOG partnered with the Michigan DOT on data access. This portal includes interactive maps, a crash data search engine, and community profiles.
As described earlier, open portals provide stakeholders and the public access to data as part of an effort to promote transparency. Some jurisdictions or agencies provide raw data as well as filtered datasets that can be readily used by stakeholders. An MPO or local community can host the website and work with IT and geographic information systems (GIS) staff to develop interactive features such as maps. This website can also house electronic reports of any analyses completed by the MPO, local community, or partners. The website may also link users to other data source partners, such as the SHSO or the State DOT. This increased access to data may result in more efforts to improve data quality and accuracy.
A small local agency may have staff with multiple responsibilities beyond safety and fewer resources than larger agencies. Therefore, they should collaborate with their MPO to identify and access safety data resources. In this way, MPOs can help ensure attention, funding, and safety resources are allocated to prioritized projects or programs and not just to the agency with the most resources to conduct analyses.
The Maricopa Council of Governments (Phoenix, Arizona) provides mapping to the public on its website. Shown here is a map of the Top 100 intersections ranked by crash risk.
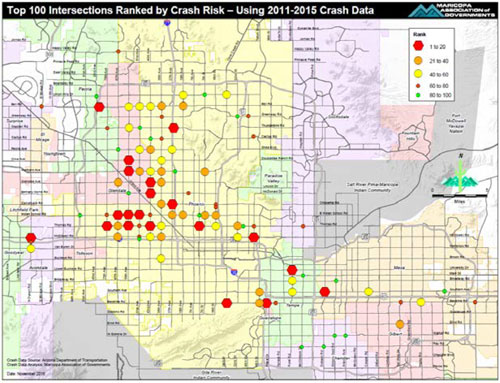
Figure 9. Phoenix-area mapping.
Source: Maricopa Association of Governments
New York City's Vision Zero website includes a mapping portal for the public to view fatality and injury data.
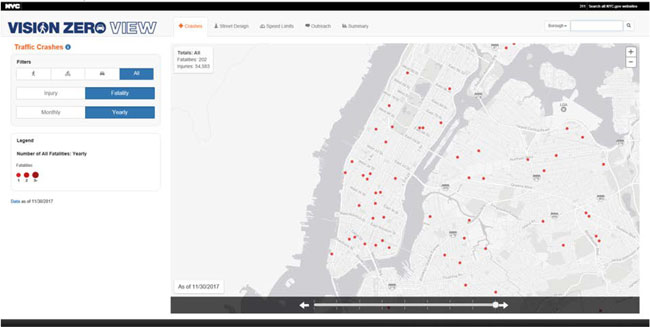
Figure 10. New York data mapping.
Source: City of New York
Identify Emphasis Areas and Potential Strategies and Countermeasures
Data analysis can determine the number of fatalities and serious injuries in categories of crashes such as pedestrians, intersections, roadway departure, impaired driving, distracted driving, aggressive driving, commercial motor vehicles, and motorcycles. Ranking the crash categories from the highest number of fatalities and serious injuries to the lowest can help to determine which crash factors are most prevalent and would become emphasis areas in the safety plan. For additional examples of emphasis areas, the American Association of State Highway and Transportation Officials (AASHTO) SHSP identified 22 key emphasis areas and contains strategies designed to address each area's key crash factor. If data are unavailable, emphasis areas may address concerns of the various stakeholders and the community. It is important that the public have the chance to identify areas of concern. Methods to reach out to citizens may include public meetings, web-based surveys, or through an advertised request for comments.
Once emphasis areas are finalized, stakeholders can begin to enumerate potential strategies and countermeasures for the safety plan. A method of identifying strategies is to consider the 4 E's of transportation safety. Stakeholders can consider strategies that have a focus on one of education, enforcement, engineering, or emergency response:
- Education strategies provide drivers information about making good choices, such as not texting while driving, avoiding driving while impaired, or wearing a seatbelt.
- Enforcement strategies focus on enforcing traffic laws and a visible police presence to deter motorists from unsafe driving behavior.
- Engineering addresses roadway infrastructure improvements to prevent crashes or reduce the severity of crashes.
- Emergency response strategies improve response and quality of care when responding to crashes.
Alabama MPO Safety Planning Tool
The Alabama DOT commissioned the development of ALSAFE, a spreadsheet-based safety tool used by its MPOs for short- and long-range transportation safety planning. As a short-range safety planning tool, MPOs can use ALSAFE to develop benchmarks, evaluate crash trends and characteristics, identify and evaluate crash types, and identify countermeasures. As a long-range safety planning tool, MPOs can use a set of built-in equations to evaluate and understand the impacts of long-term demographic changes, land uses changes, and planning decisions on transportation safety.
If there is opportunity to combine the efforts of multiple strategies, such as education and enforcement, the likelihood of success in improving safety can increase. Ultimately, the emphasis areas that are identified for the safety plan should reflect a balance issues identified by stakeholders and the resources (financial, expertise, and time) available to put them into practice. If an emphasis area is critical but does not currently have resources, it should still be included with the constraints listed. Step 4 in the Guide expands on how transportation safety stakeholders can select the appropriate countermeasures for final inclusion in the safety plan.
Using Data to Focus on Key Locations
After identifying the emphasis areas and potential countermeasures, transportation agencies can conduct another layer of data analysis to determine the locations where safety investments are needed. This helps to pinpoint the areas where there is the greatest potential to decrease fatalities and serious injuries. Limited funding means there is a need to prioritize safety investments.
Transportation agencies can determine the locations of their safety investments within each emphasis area using two different approaches, hot spot and systemic. Hot spot analyses—the traditional method for identifying key locations for safety investment—involves finding clusters of crashes. This is often illustrated using high-crash or high-injury network maps, which show that a small percentage of roadways or corridors account for a large majority of crashes. MPOs and local communities can use those visualizations to prioritize investments that will address those areas. However, the hot spot method addresses crashes that have already occurred. Systemic analyses move agencies from a reactive approach to a more proactive approach to identify projects to address high-risk features before crashes occur. The FHWA Data Driven Safety Analysis website provides more information about these analytical procedures.
MPOs and local communities can also use State-developed resources to conduct more advanced analyses, such as the use of safety performance functions (SPF). An SPF is a prediction model used to estimate crash frequency for a specific site type, with specified base conditions. States are calibrating geographic-specific SPFs to allow different regions and communities to conduct analysis that are more appropriate for their area. The FHWA Roadway Safety Data Program provides more information on roadway safety data tools. These tools may involve simple statistical investigations of crash trends and types or sophisticated tools such as AASHTOWare Safety Analyst and the Highway Safety Manual.
More than half of deadly crashes in Portland, Oregon occur on 30 high crash streets, representing eight percent of its street network. The city developed a map to illustrate this statistic (see Figure 11).
Examples of High-Injury or High-Crash Network Analysis and Mapping
- Vision Zero Network prepared a case study paper on the use of High Injury Networks.
- Philadelphia devised a methodology for identifying its high injury network.
- San Francisco prepared an interactive high injury network map.
- New York City's left-turn study presents a proactive approach for implementing real changes.
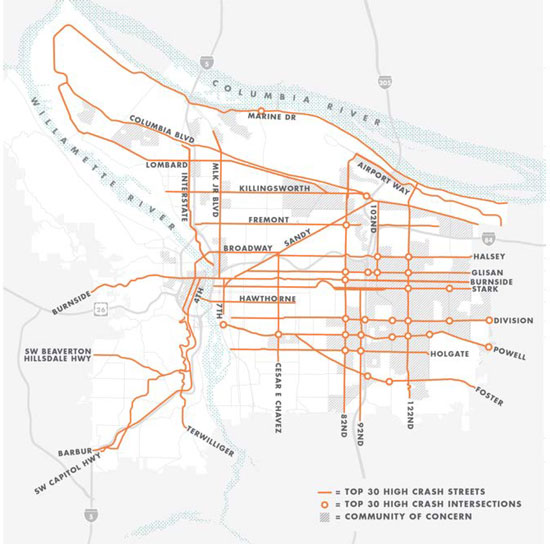
Figure 11. High-injury or high-crash network mapping.
Source: City of Portland
The Sun Corridor MPO (Casa Grande, Arizona) developed a Corridor Projects Report that identified safety corridors for the MPO, specific crash data for the corridors, detailed maps for proposed safety improvements to each corridor, a cost estimate worksheet for each corridor, and HSIP cost/benefit ratios.
The Vision Zero Hillsborough (Tampa, Florida) data analysis effort included the development of corridor profiles to help prioritize safety investments. Each profile is one-page in length, with summaries of key crash findings suitable for public consumption.
Use A Data-Driven Process Checklist
- Collect data to identify safety issues:
- Collect crash, roadway, and traffic volume data at a minimum. Other datasets such as injury surveillance, driver records, and court records may also be useful, if available.
- Check for available State analytical tools that combine some or all these data sets.
- Summarize data analysis results in meaningful formats for the public.
- Provide data access to stakeholders and the public, such as a website.
- Develop interactive maps.
- House safety data reports and links to other sources of data.
- Review FHWA's Applying Safety Data and Analysis to Performance-Based Transportation Planning.
- Conduct data analysis to identify the key safety issues for the jurisdiction:
Crash Types
The Central Lane MPO (Eugene, Oregon) summarizes its safety information based on NHTSA's core performance metrics.
- Conduct a data analysis to determine the key crash factors which in turn become the emphasis areas of a safety plan.
- Conduct hot spot and systemic analyses for each emphasis area to determine the locations that have the greatest potential safety benefit.
 3.C – SET PERFORMANCE MEASURES AND TARGETS
A performance-based approach requires establishing quantifiable targets for the strategies and actions in the safety plan. This section elaborates on how MPOs and local communities can develop their targets to measure implementation progress and outcomes of the actions in the next step of the safety planning process. Evaluation, which is the sixth step of the safety planning process, will measure the progress and success of safety plan implementation against these targets. Is it also important to engage all stakeholders and the public in selecting performance measures and setting targets. Safety plan participants need to agree that the chosen measures and targets are realistic and achievable, otherwise, the safety plan may be able to fulfill unattainable goals.
Before setting any targets in the safety plan, it is useful to set specific objectives that support the vision and mission of the safety plan. For example, if there is an overarching goal of zero for the safety plan, stakeholders may identify an objective for each emphasis area to move toward that goal, such as reducing fatalities and serious injuries by half by a certain date. Annual targets can then be set to drive safety plan actions to meet the objectives.
The targets that are set in a safety plan depends on the types of performance measures that are chosen for each strategy and action. There are output measures that are used to track the implementation of safety plan actions and there are outcome measures that are used to track the effect of these actions such as the number of fatalities in the jurisdiction, number of fatalities for each emphasis area, public attitude toward safety issues, and public awareness of safety outreach. Table 3 describes the types and examples of output and outcome performance measures for inclusion in a safety plan. When selecting an appropriate output and outcome measure for an action, safety plan stakeholders will have to determine if data is available for the measures.
In descending order of importance. Adapted from the FHWA Evaluation Process Model
| Measure Type | Example Measures |
|---|---|
| Primary Outcome Measures | Reductions in the number and rate of fatal and serious injury crashes by Emphasis Area. |
| Secondary Outcome Measures (also called Proxy Measures) | Changes in observed behavior, such as safety belt and helmet use, speeding, red light running, pedestrians who jaywalk, changes in average speeds due to traffic calming countermeasures, and other observed behavior changes. |
| Self-Reported Outcome Measures (what people say) | Have you ever driven after having too much to drink? How often do you wear your safety belt? |
| Attitudinal Outcome Measures (what people believe) | Support for legislative initiatives; knowledge of safety belt laws; teen attitudes about drinking and driving; and attitudes toward roundabouts, rumble strips, and other infrastructure safety improvements. |
| Awareness Outcome Measures (what messages people have heard) | Awareness of high-visibility enforcement, perceived risk of getting a traffic ticket. |
| Activity Output Measures (program implementation) | Miles of rumble strips, pavement markings, signage, and other infrastructure improvement; citations issued by the police, special police patrols, and check points; presentations; training programs; media coverage; legislation. |
There are cases where performance measurement is required and specific performance measures are defined. The Federal government requires MPOs to adopt five safety outcome performance measures and to establish an annual target for each. MPOs have the option to adopt targets established by the State or develop their own, as described in 23 CFR 490Safety Performance Measurement Final Rule, subpart B. Regardless of their decision, the MPOs must report against their targets of the following five performance measures to the State:
- Number of fatalities.
- Rate of fatalities per 100 million vehicle miles traveled.
- Number of serious injuries.
- Rate of serious injuries per 100 million vehicle miles traveled.
- Number of non-motorized fatalities and non-motorized serious injuries.
Washington State DOT developed the Federally required five safety targets in coordination with its MPOs, the Washington State Traffic Safety Commission, and other partners. MPOs in Washington State agreed to adopt the State targets. Washington State DOT published a factsheet to show how targets in the State were developed.
While MPOs must report the performance toward their targets, local communities do not have the same requirement. However, a local community can adopt similar targets to establish benchmarks for safety performance. Additional resources on the safety performance final rule is found at the FHWA HSIP Rulemaking webpage.
A rule of thumb for performance measures and targets is that they should be SMART—Specific, Measurable, Achievable, Realistic, and Time Bound. FHWA's Safety Performance Management resource page provides more resources on how to set targets. This website shows several options to adopt targets that account for fatality and serious injury reduction, including linear reduction, forecast outputs, vehicle-miles-traveled relationships, and zero-goal trajectories. In addition, the use of five-year rolling averages is introduced to smooth out the unpredictable variation of shorter-term safety data.
The MPO or local community may also set interim milestones for their output and outcome performance measures. MPOs and local communities can align single- and multi-year objectives with an overall long-term goal.
MPOs should note that:
- All MPOs must set a target for each of the five HSIP Safety Performance Measures.
- MPOs may adopt and support the State's HSIP targets, develop their own HSIP targets, or use a combination of both.
- MPOs must establish their HSIP targets by February 27 of the calendar year for which they apply.
- MPO HSIP targets are reported to the State DOT.
- MPO HSIP targets are not annually assessed for significant progress toward meeting targets. State HSIP targets are assessed annually.
- MPOs can learn more at the FHWA Safety Performance Management MPO Factsheet website.
Set Measurable Targets Checklist
- Work with stakeholders and the public in the development of goals, objectives, performance measures, and targets.
- Understand there are output and outcome measures.
- Output measures relate to the amount of activity for an action.
- Outcome measures relate to the impact of an action.
- Review the FHWA Safety Performance Management resource page.
- Understand MPOs are required to track five performance measures and establish annual targets.
- Local communities are not subject to the same requirements; however, it is useful to adopt similar measures for consistency.
- Use 5-year rolling averages to smooth out the unpredictable variation of shorter-term safety data.
- Make sure the performance measures and targets are SMART (Specific, Measurable, Achievable, Realistic, Time Bound).
 3.D - SELECT STRATEGIES AND COUNTERMEASURES
After MPOs and local communities understand their emphasis areas, locations where the greatest safety benefits can be achieved, and potential performance metrics, they are ready to select the most appropriate countermeasures that will best meet achieve the overarching vision, mission, and goal of the safety plan.
Identify Strategies and Countermeasures
The final strategies and actions in the safety plan should focus on addressing the identified emphasis areas as well as locations with the potential for the greatest safety benefits as identified in the hot spot, systemic, and predictive analyses. MPOs and local communities will need to use data and research to prioritize effective strategies and select appropriate countermeasures to form actions that address the critical crash factors. MPOs and local communities should first identify countermeasures the jurisdiction is currently implementing and evaluate their effectiveness. This also helps to achieve "quick wins," or cost-effective strategies with the greatest impact on the leading crash causes.
Fremont, California developed a pamphlet to highlight the strategies in its Vision Zero plan.
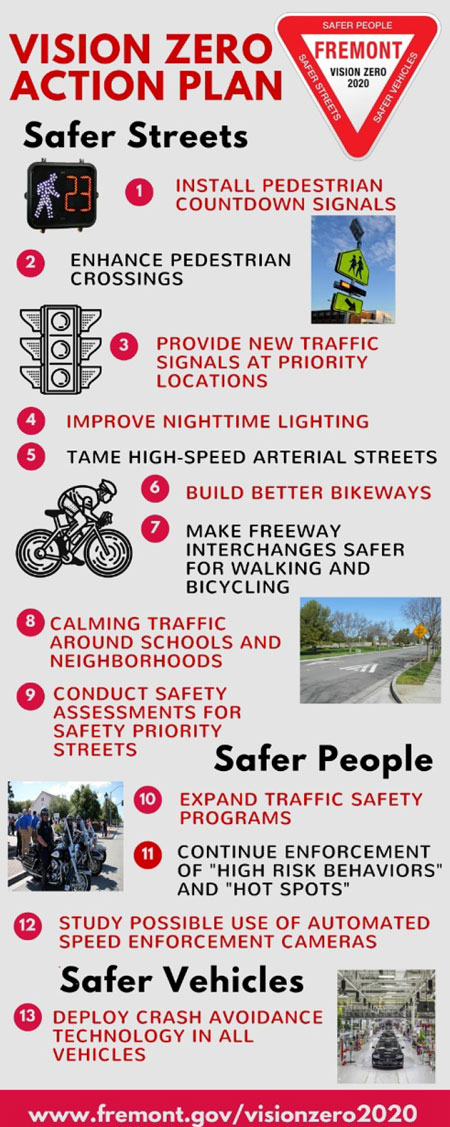
Figure 12. Engaging community pamphlet example.
Source: City of Fremont
Strategy and action selection will also be based on effective and validated countermeasure implementation and practices. There are many resources available to transportation agencies to assist with this step. The following list of resources all provide more information on effective countermeasures:
Safer Vehicles
Fremont, California's Vision Zero program includes a strategy to coordinate with the dozen auto dealers in the city to discuss how to encourage the purchase of vehicles with safety technology. It is noted that these technologies will be standard in most all new vehicles by 2022. However, Fremont has learned that people are disabling the technology due to lack of education about their benefit and use. This is an area where Federal, State, MPOs, and local communities can coordinate efforts to encourage people to replace older vehicles with safer vehicles and then use the new technologies.
- FHWA Office of Safety Proven Safety Countermeasures: The FHWA Office of Safety compiled this list of 20 proven engineering countermeasures to address crashes that involve intersections, pedestrians, and roadway departure.
- NHTSA Countermeasures That Work: This publication is a basic reference to assist SHSO in selecting effective, evidence-based countermeasures for nine behavioral traffic safety problem areas.
- NCHRP 500 Series: Guidance for Implementation of the AASHTO Strategic Highway Safety Plan Transportation Research: NCHRP has a series of guides to assist State and local agencies in reducing injuries and fatalities in the targeted areas identified in the AASHTO SHSP.
- NCHRP 622: Effectiveness of Behavioral Highway Safety Countermeasures: The purpose of this report is to develop a roadmap for States and a best practice guide for the use and assessment of behavioral countermeasures.
- Toward Zero Deaths: A National Strategy on Highway Safety: This resource presents a series of strategies to address highway safety.
- FHWA Crash Modification Factors Clearinghouse: The CMF Clearinghouse offers transportation professionals a central, web-based repository of CMFs, as well as additional information and resources related to CMFs.
- Vision Zero Network: This website includes case studies that highlight the application of safety countermeasures at the local level, including low-tech solutions.
- ITE Safety Resources Toolbox: This website is comprised of a regularly updated collection of resources to assist with safety planning and programming, including links to countermeasure resources.
- State SHSP. The State may have already identified appropriate countermeasures that are included in the State SHSP.
Examples of Countermeasure Selection Tools
- SEMCOG (Detroit, Michigan) provides lists of proposed engineering countermeasures with associated effectiveness and costs.
- Pima Association of Governments in Tucson, Arizona is pursuing and evaluating a Safety Design Guide to ensure project designs are consistently pursuing the safety design possible. They also provide a toolbox of ideas for project owners.
- NCTCOG (Dallas, Texas) provides a link to engineering tools to serve as a resource for member agencies.
- The Tri-County Regional Planning Commission (Lansing, Michigan) Regional Transportation Safety Plan provides a summary of its countermeasures.
A multidisciplinary team of stakeholders will result in a wide range of perspectives and potential solutions. Therefore, MPOs and local communities are challenged to select the most appropriate countermeasures. The strategies and actions to apply these countermeasures should match the leading causes and locations of fatal and serious injury crashes as identified in the data analysis. This stage also offers an opportunity for the stakeholder group to decide whether to pursue pilot strategies to evaluate effectiveness and appropriateness.
When selecting countermeasures for the actions in the safety plan, MPOs and local communities need to be aware of the three main types of approaches to countermeasure implementation and are similar to data analysis techniques described earlier. These are spot location, systematic, and comprehensive. The quality and availability of data helps to determine the most appropriate approach.
The spot location approach is reactive in nature and is the most dependent on data availability and quality. This approach results in implementing countermeasures at locations with a history of crashes. However, this assumes the past equals the future and the benefits are localized.
A systemic approach to safety involves widely implemented improvements based on high-risk roadway features correlated with specific severe crash types. The approach helps agencies broaden their traffic safety efforts at little extra cost. The systemic approach provides a proactive approach to countermeasure implementation.
A comprehensive approach to countermeasure implementation recognizes that not all locations are addressed by infrastructure or behavioral improvements. For example, if there is a set of locations with high numbers of speeding crashes, enforcement initiatives can complement engineering solutions to provide a comprehensive approach to address the crash issue.
MPO Perspective
MPOs are in a unique position to help identify appropriate countermeasures for a region. While the core part of the region is urban, the periphery of the region is typically suburban or even rural in character. This means the region will consider a more extensive set of countermeasures than those considered by an individual community as the set includes urban and rural countermeasures. MPOs should engage local communities to attain broad support for both urban and rural countermeasures.
Local Community Perspective
Local communities should review the variety of resources—as well as the countermeasures identified in the State and regional plans—to assist in identifying effective countermeasures and coordinate existing efforts. The Urban Street Design Guide published by the National Association of City Transportation Officials (NACTO) and success stories from the USDOT Mayors Challenge provide recommendations on design street environments that are safe for all users and informs the selection of appropriate countermeasures. The resource A Vision for Transportation Safety: A Framework for Identifying Best Practice Strategies to Advance Vision Zero provides an example matrix of countermeasures.
Once all countermeasures are finalized, stakeholders will need to develop the language of the action that is included in the final safety plan to describe the implementation of a countermeasure.
Strataegy and Countermeasure Prioritization
The proposed strategies and actions in each emphasis area can be prioritized by comparing the benefits and costs of implementation. This comparison helps to identify the strategies and actions that provide the highest benefit, such as the reduction in fatalities, for the least cost. Costs and benefits are not the only considerations. Other prioritization considerations include the availability of manpower and the schedule for implementation. Stakeholders and the public can determine an agreed upon priority for each strategy and action with these considerations in mind.
The MPO Guidebook for Using Safety as a Project Prioritization Factor illustrates several methods to prioritize projects during the planning process. This guidebook introduces the following methods for project prioritization:
- Cross-modal.
- Mode specific.
- Funding source based.
- Goals and objectives based.
- Program based.
- Scenario based.
The MPO and local community should share the methodology and the results of project prioritization. This promotes an environment of transparency with the public. Holding stakeholder workshops is important to gather public input on prioritization.
Select Strategies and Countermeasures Checklist
- Use the results of the data analysis to focus the selection of countermeasures to match emphasis areas and locations with the greatest potential safety benefit.
- Consider the Safe Systems approach.
- Review safety countermeasure resources.
- Review best practice research on effective countermeasures.
- Review countermeasure selection tools used by MPOs and local communities.
- Review State SHSP and other plans for potential strategies to include in MPO or local safety plan.
- Develop a list of appropriate strategies and actions. Consider systemic, spot location, and comprehensive approaches to implement the actions.
- Identify an appropriate method for project prioritization.
 3.E – PREPARE AND IMPLEMENT A SAFETY PLAN
In this step, MPOs and local communities will finalize, prioritize, and document the strategies and actions stakeholders will implement during the life of the safety plan. A public-facing safety plan along with supporting materials promotes continued stakeholder and public engagement.
Develop the Public-Facing Safety Plan Document
An accessible safety plan document is meant to be a public-facing vision for the community. Therefore, the plan should describe each step of the safety planning process and include pertinent information such as the key fundamentals of a data-driven approach; the plan's stakeholders, goals, objectives, and strategies; selected countermeasures; and the implementation and evaluation processes. This helps to promote the transparency of the safety planning process.
When writing the plan, transportation agencies and their partners should consider the following questions:
- Are we providing a compelling argument to support and communicate our safety vision?
- What do we want to express to the community?
- How can we best highlight key information and concepts?
- What community values can we highlight to promote that this plan is representative of us all?
The following are suggested sections for an MPO or local community safety plan:
- Executive Summary.
- Introduction.
- Vision, Mission, and Goals.
- Supporting Data
- Stakeholder Engagement.
- Emphasis Areas, Strategies, and Actions Summary.
- Detailed action list or matrix that shows strategies and actions and their accompanying responsible agencies, implementation timeframe, cost, performance metrics, and evaluation plan.
Visually stimulating and captivating graphics are important to make the plan an attractive and engaging document. Graphics must be relevant and communicate key aspects of the safety plan, with a clearly defined and strategic purpose. Useful graphics include goal statements or a data summary illustrating prevailing trends affecting traffic safety. The plan can also highlight differences between geographies within the safety plan coverage area and other comparable locations elsewhere in the State or nationwide. It may be helpful to develop a simple narrative about individual traffic fatalities to complement crash data statistics. Public impressions about safety issues and priorities are often overly skewed toward neighborhood streets and concerns related to children.
In addition to providing a traditional publication, MPOs and local communities may consider establishing a website dedicated to serve as an easily accessible representation of the safety plan. A dedicated website also provides MPOs and local communities a portal to information related to the plan, including performance management dashboards, links to other relevant resources, links to partners, and other similar information. Performance management dashboards and tracking tools provide decisionmakers and the public with visual representations of up-to-date information on the progress of safety plan implementation. All participating stakeholders should know the location for easy access and sharing with their respective partners.
MPOs and local communities will have to address the following questions when publishing the plan on a website:
- Who will fund, host, create, and update the website?
- Is there an existing web platform to publish a dedicated page?
- Can the website provide a meaningful user experience (not just a static page informing the community that the plan exists)?
- Which stakeholders can serve as a technical committee to support the site?
- Are resources available to consistently update and provide content to the website that meet the needs of the plan and community?
Prioritize Actions
A safety plan can also provide specifics such as detailed action plans that include data needs, resources, a timeline, responsible parties, a budget, funding sources, project-level details, performance and process measures, and evaluation criteria for assessing outcomes. The Vision Zero Network provides sample safety plans from a growing number of communities across the country.
General considerations for organizing the actions in the safety plan include the following:
- Assess available resources to help establish realistic timelines for each action.
- Gather input on each action from many stakeholders, including the public, to reinforce collaboration and information sharing.
- Connect implementation actions across emphasis areas.
Steps for implementing your plan:
- Organize the safety plan and prioritize actions with specific timeframes for action/accountability.
- Assign responsibility.
- Identify funding sources.
- Develop the public-facing safety plan document and gather input on drafts prior to finalizing.
- Publish and distribute the plan document.
- Develop tracking tools and dashboards.
- Conduct stakeholder and public meetings and market the plan.
The safety plan organization process should identify a leader responsible for monitoring and implementing individual actions. Some safety plans also have accompanying spreadsheets or tools that display information and structure the collection of data to support performance measurement.
MPOs and local community plans should provide actions with timeframes (e.g., short, medium, long) to support the more general strategy timeframes. For example, if a strategy is to "implement infrastructure improvements to reduce factors contributing to pedestrian fatalities" with a designated medium timeframe, a corresponding action may be "identify locations for the application of high-visibility crossing treatments," which could have a designated short timeframe. The MPO and local community can also classify the action as a low-, medium-, or high-cost activity. Using cost and timeline to implement is a good initial step for the prioritization of safety plan strategies as the ‘quick wins' will likely spur momentum and support more comprehensive strategies in the future.
Ultimately, agencies can revisit and amend the actions as necessary. As with other documents, the MPO or local community should post the actions on a website to promote accessibility and transparency during the safety plan implementation process. Stakeholders—with consensus—may add, remove, or revise strategies and actions to maintain relevancy of the safety plan. Some agencies provide the actions as a standalone document outside of a safety plan and includes strictly the strategies and countermeasures. For example, an agency can develop an "action plan" for an emphasis area. The FHWA Implementation Process Model shows how to develop an emphasis-area specific "action plan." The Vision Zero Network also provides a resource on how to develop "action plans."
Denver's Vision Zero Action plan shows timeframes and partners with associated actions.
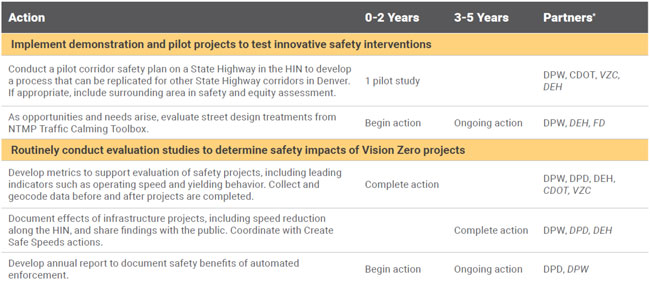
Figure 13. Denver Vision Zero action table.
Source: City of Denver
Assign Responsibilities for Actions
Alexandria, Virginia's Vision Zero plan includes matrices that describe timeframe, funding, and responsibilities for each action.
Clearly assigned responsibilities establish a feedback loop to report on successes and challenges to implementation. Certain actions may be primed for a specific stakeholder; for example, enforcement initiatives are associated with law enforcement agencies. Some activities—though easily associated with a certain agency—may require or benefit from input by other stakeholders. For instance, an action that involves a road diet is usually assigned to a traffic engineer. However, the traffic engineer needs to engage the fire department as a road diet may have impacts to response times. MPOs and local communities can also assign responsibilities for actions to existing task forces or committees to avoid duplication, promote buy-in from the implementing agencies, and provide an opportunity to leverage existing programs and resources.
Identify Funding Sources
Stakeholders should evaluate their agency's financial resources and investigate options for shifting funds to safety-based actions. MPOs and local communities should also explore additional State, regional, and private grants as funding sources to support implementation. It is also useful to coordinate funding with phases of implementation so that stakeholders can complete their actions incrementally, especially if limited dollars restrict the possibility of funding an action all at once. FHWA Office of Safety's website provides an overview of available Federal safety funding.
As indicated in the previous prioritization discussion, MPOs and local communities can categorize the estimated cost of projects by low, medium, or high. During this phase, actions should be assigned to agencies with appropriate funding streams. Federal, State, regional, and private grants are potential funding sources.
Funding conversations increase knowledge sharing between partners and may result in agencies identifying opportunities to jointly request funds. Different partners may be eligible for funds from different sources and should be encouraged to pool those funds for the projects when appropriate. Additionally, stakeholders can elevate safety during other general project solicitation and funding decisions.
Examples of Safety Plan Funding Sources
- The District of Columbia sets aside $500,000 in annual funding for Vision Zero grants. These funds come from a portion of revenue generated from automated traffic enforcement dedicated to Vision Zero. These grants are provided to local non-profits, 501(c)(3) organizations and District government agencies.
- Columbia, Missouri's Vision Zero plan was initially funded from a Missouri Foundation for Health Grant.
- The Fremont, California city council reallocated $2.5 million in city funding to pursue "quick win" safety improvements such as a systemwide completion of pedestrian countdown signals, new traffic signals at high crash locations, and neighborhood traffic calming.
- Los Angeles provides an example of multiple departments collaborating on joint funding request for Vision Zero.
Develop Tracking Tools and Dashboards
DC's Data Portal
Washington, D.C. provides access to its crash data through its Vision Zero Safety portal as part of its open data policy to streamline internal data sharing and encourage transparency.
MPOs and local communities can use dashboards and tracking tools to provide decisionmakers and the public with up-to-date information on the progress of safety plan implementation and also serves as inputs for evaluation procedures in the next step of the safety planning process. It may be useful to show data by geography. MPOs can provide filters for users to aggregate information at region-wide, county, or local community levels. Local communities similarly can show information by district, ward, or neighborhood. The MPO or local community can provide access to the tracking spreadsheets or web-based tools used to document progress on the safety plan by uploading them to the safety plan website. If there are concerns related to the access of sensitive information, implementing password protections for the dashboards or tools is an option. FHWA hosts a visualization resource webpage that shows procedures and techniques to make information clear and understandable to the public or to decision makers.
North Carolina Statewide Vision Zero provides data and dashboards for communities to use for their local efforts.
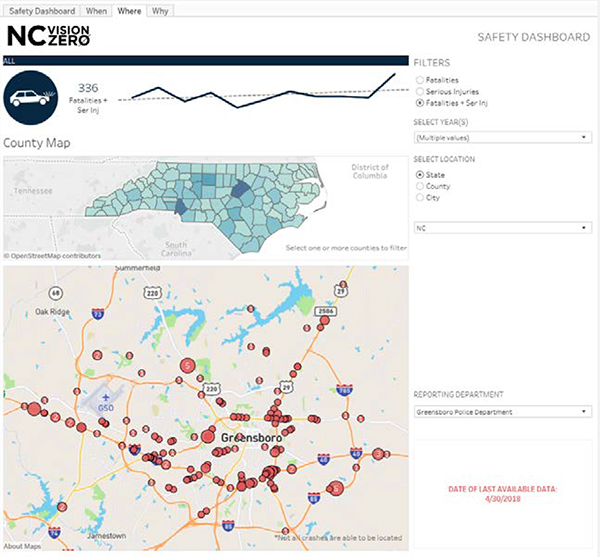
Figure 14. Example dashboard.
Source: Noth Carolina Vision Zero
Partnering Responsibility
The DVRPC Regional Safety Task Force documents the persons responsible for actions identified during quarterly meetings. At each subsequent meeting the status of the action is reviewed. DVRPC also polls attendees on the effectiveness of its meetings.
Continue Stakeholder and Public Meetings and Market the Plan
The success of safety plan implementation involves continued stakeholder engagement and should continue the early efforts in the safety planning process to market the plan. The continued public meetings can help maintain or grow momentum in changing the safety culture in the community but also can help build awareness of the final adopted safety plan. Continued stakeholder engagement can be accomplished through regularly scheduled meetings. MPOs and local communities who have successfully implemented safety plans report that frequent meetings facilitate discussion on the progress of safety plan implementation and promotes continued accountability in the implementation process. Proactive planning and scheduling will help provide a foundation for engaging and open discussions. MPOs and local communities can consider the following steps for stakeholder meetings:
- Communicate the value and need of stakeholder attendance and engagement.
- Set regular meeting dates and times.
- Select a venue(s) that allow for the most stakeholders to attend.
- Consider using tools to allow "virtual" participation to increase attendance.
- Provide advanced meeting and post meeting notes to stakeholders.
- Use existing communication channels, where possible.
Stakeholder Engagement After adoption of the Fremont Vision Zero plan, staff met with existing civic organizations to seek input on priorities, specific projects, and partnerships. A Vision Zero presentation and discussion was held with the city's Planning Commission, Bicycle and Pedestrian Committee, Environmental Sustainability Commission, Youth Commission, and Senior Commission. Vision Zero information and feedback opportunities were integrated into the city's website and quarterly newsletter (sent to all city residents). Vision Zero was highlighted as part of a city booth provided at community festivals and fairs.
Prepare and Implement a Safety Plan Checklist
- Develop the public-facing safety plan document:
- Identify and present trends (safety data as well as demographic), hotspots, emphasis areas, and impact of strategies.
- Consider the use of visually-stimulating graphics.
- Develop factsheets or pamphlets to accompany the safety plan.
- Consider resources needed to support a website for the safety plan.
- Prioritize actions.
- Identify leader(s) to monitor specific action in the safety plan.
- Work with stakeholders to identify cost and implementation timeframes.
- Assign responsibilities for actions.
- Identify funding sources for each action and encourage departments and agencies to jointly submit project requests.
- Develop tracking tools.
- Continue public engagement with scheduled meetings and build awareness of the completed plan.
 3.F – EVALUATE AND UPDATE THE PLAN
Establishing an evaluation framework for the safety plan is an important step for updating constituents on implementation progress and effectiveness. In this step, the MPO or local community will need to establish regular opportunities to review progress, identify success, determine challenges to implementation, and identify opportunities for improvement. As emphasized throughout the Guide, transparency is critical for accountability. Transportation agencies will use the results of an evaluation process to improve safety plan implementation and ultimately, overall performance. MPOs and local communities can also use the results to inform agency executives, other elected officials, stakeholders, and the public on the performance of the plan as a measure of transparency. Documented evaluations formalize reporting procedures, maintain a focus on original objectives, establish a level of accountability, and serve as a reference for new leadership and staff.
The Centers for Disease Control and Prevention's workbook, Developing an Effective Evaluation Plan, provides guidance for developing a living "Evaluation Plan," helping program administrators identify answers to the purpose, process, and rationale about their program.
Most transportation agencies already perform some level of evaluation. Organizing and institutionalizing these elements into a comprehensive program evaluation, such as that of the SHSP Evaluation Process Model (EPM) developed for State-level plans, provide additional benefits. Program evaluation considers the overall safety plan and will identify where overall plan and strategic goals are met or unmet and point toward likely strengths or shortcomings.
Agencies can use the evaluation results to update individual elements or the whole plan and improve implementation and performance. The evaluation results are provided to leadership to prioritize funding and support for changes to correct deficiencies. As a State is required to update its SHSP every 5 years, there may be opportunities to align a full update of the MPO or local community safety plan within a similar timeframe.
Plan for Evaluation
MPOs and local communities should have already considered evaluation practices during prior steps in the safety planning phases, particularly with the development of output and outcome performance measures. Stakeholders will want updates on the chosen measures as they will learn about the actions resulting in the best outcomes for the cost.
When setting up evaluation of the safety plan, consider the following steps:
- Assign roles and responsibilities that identify who will report on progress during evaluation for each action in the plan.
- Set up data collection and analysis efforts on an ongoing basis that help provide current data for evaluation.
- Establish safety plan implementation tracking to monitor progress toward reaching goals and objectives and use to populate an evaluation report.
While evaluation is typically conducted at fixed intervals (e.g., quarterly), it can take place at any time. Evaluation intervals may tie into the timing of a general safety plan update, the completion of significant implementation activities, or prompted by a status update request from agency leadership.
MPO Perspective
As part of the Federal target setting requirements, an MPO will need to submit a system performance report to document progress achieved toward meeting the five safety performance targets. The frequency of reporting promotes a culture of consistent documentation of safety performance and provides transparency to the public. The MPO should also apply this manner of annual reporting to other performance metrics in the regional plan, including process and outcome measures. These metrics will also help inform future project prioritization efforts not only in the regional safety plan but also in the MTP, TIP, and UPWP. Annual reports can also stimulate competition between jurisdictions to generate investment for safety.
Local Community Perspective
The local community should report on performance metrics in the safety plan, including overall progress toward the stated goal, as well process and outcome measures. These metrics will also help inform future project prioritization efforts in the local community transportation plan and feed into the MTP, TIP, and UPWP.
Perform Evaluation
Annual (or another desired interval) evaluation reports are not only a helpful product to document progress on the plan but are a good resource to influence leadership and the public. The MPO or local community can upload annual reports to an agency website or dedicated transportation safety plan page.
- Process Evaluation
- A process evaluation provides insight into safety plan management elements, such as organizational structure; coordination; the use of data in determining emphasis areas, goals, objectives, strategies and actions; and the alignment of agency priorities. The following elements should be assessed for a comprehensive process evaluation as identified in the SHSP Implementation Process Model (IPM):
- Safety plan organizational structure.
- Multidisciplinary, multimodal collaboration.
- Safety plan goal and objective setting methods.
- Data driven and evidence-based emphasis areas, strategies, and actions.
- Aligned agency priorities.
- A process evaluation provides insight into safety plan management elements, such as organizational structure; coordination; the use of data in determining emphasis areas, goals, objectives, strategies and actions; and the alignment of agency priorities. The following elements should be assessed for a comprehensive process evaluation as identified in the SHSP Implementation Process Model (IPM):
- Output Evaluation
- This type of evaluation measures progress and productivity of the strategies and actions of the safety plan. It helps determine the status of or the extent to which safety plan strategies and actions are implemented. Actions that require multiple years for completion may need an interim progress milestone against which progress is tracked. These milestones serve as a measure on progress towards a meeting a performance measure.
- Outcome Evaluation
- Outcome evaluation is challenging because the link between safety plan implementation and crash reduction is indirect. Causality is difficult to establish because scientific evaluation conditions and controlled studies are simply not possible in the transportation safety field. However, while it is not possible to conclusively demonstrate that action A "caused" condition B, correlations between conditions A and B can be identified and used in outcome evaluation. As described earlier, outcome performance measures include primary, secondary, attitudinal, and awareness measures These measures reveal the extent to which actions are affecting safety outcomes. Performance evaluation compares the outcomes to baseline information to determine the degree to which objectives are met.
Data may not always be readily available to measure the desired measures. This lack of data should not preclude an evaluation. Transportation agencies can perform qualitative evaluations.
While the MPO and local community safety plan document processes and outcome measures are based on the geographic boundaries of its jurisdiction, safety stakeholders should give additional consideration to equity within different regions of the community. An MPO may consider disaggregated measures at the local community level to identify intra-regional disparities. A local community can disaggregate information based on districts or neighborhoods.
Evaluation Progress Report Example. Seattle produces a Vision Zero Progress Report that shows improvements that have been made since the adoption of their original Vision Zero plan. Other examples include the Mid America Regional Council (Kansas City) quarterly fatality reports, a New York City annual report webpage, and an Austin, Texas report card
Update the Plan
Evaluation identifies successes and deficiencies in the safety plan as the guiding document for the overall safety effort. Evaluation products include the implementation of changes to correct deficiencies in the plan. It also informs elected and appointed officials so they consider additional funding and support for safety efforts.
MPOs are familiar with plan updates—MTPs, TIPs, and UPWPs are all updated on set schedules to reflect changes in priorities and policies in a region. Local communities also have comprehensive plans and other documents that are regularly updated. While some plans require updates within specific timeframes, a safety plan does not have the same requirement. However, it is beneficial to identify a timeframe for safety plan updates to reflect changes in conditions, priorities, and policies. As a comparison, State DOTs or the State SHSO update SHSPs every 5 years. The influence of safety in the projects and initiatives identified in the MTP, TIP, and UPWP and local plans is best achieved with scheduled updates to the safety plan. This way, the safety plan helps to inform safety priorities that require updates in other plans.
Evaluation and Update the Plan Checklist
- Plan for Evaluation:
- Report annually on the five or more safety performance measures.
- Report annually on the process and outcome measures identified in the safety plan.
- Develop a process to evaluate the impact of projects.
- Perform Evaluation:
- Report on process, output, and outcome results for each overall performance metric as well as for each action in the plan.
- Update the Plan:
- Identify an established timeframe for the plan update.
- Ensure the updated safety plan informs updates to other plans.
CONCLUSION
This Safety Planning Reference Guide for MPOs and Local Communities supports the development, implementation, and evaluation of performance-based strategic safety plans for MPOs, local communities, and affiliated transportation agencies and stakeholders. The Guide provides references to key information, noteworthy practices and examples, and links to detailed resources.
As many MPOs and local communities adopt the vision of zero deaths in their unique ways, they can apply, as appropriate, the six steps of the safety planning process and other considerations presented in this Guide to develop and implement a safety plan to guide safety investments in an equitable and strategic manner. The data-driven and collaborative nature of the plan will help prioritize the greatest safety needs and identify a series of actions that will help save lives. By working together toward a common vision, stakeholders will have a successful safety plan to direct their efforts to move toward eliminating fatalities and serious injuries.