U.S. Department of Transportation
Federal Highway Administration
1200 New Jersey Avenue, SE
Washington, DC 20590
202-366-4000
PDF (925 KB)
This document is disseminated under the sponsorship of the U.S. Department of Transportation in the interest of information exchange. The U.S. Government assumes no liability for the use of the information contained in this document. This report does not constitute a standard, specification or regulation. The U.S. Government does not endorse products or manufacturers. Trademarks or manufacturers' names may appear in this report only because they are considered essential to the objective of the document.
The Federal Highway Administration (FHWA) provides high-quality information to serve Government, industry, and the public in a manner that promotes public understanding. Standards and policies are used to ensure and maximize the quality, objectivity, utility, and integrity of its information. FHWA periodically reviews quality issues and adjusts its programs and processes to ensure continuous quality improvement.
| 1.
Report No. FHWA-SA-18-031 |
2. Government Accession No. | 3. Recipient's Catalog No. | |
| 4. Title and Subtitle HSIP 2017 National Summary Report |
5. Report Date May 2018 |
||
| 6. Performing Organization Code |
|||
| 7. Author(s) Kari Signor and Daniel Carter |
8. Performing Organization Report No. | ||
| 9. Performing Organization Name and Address University of North Carolina |
10. Work Unit No. (TRAIS) | ||
| 11. Contract or Grant No. DTFH61-11-C-00050 |
|||
| 12. Sponsoring Agency Name and Address Federal Highway Administration (FHWA) Office of Safety 1200 New Jersey Ave, SE Washington, DC 20590 |
13. Type of Report and Period Covered Summary Report 2017 |
||
| 14. Sponsoring Agency Code FHWA |
|||
| 15. Supplementary Notes | |||
| 16. Abstract The HSIP 2017 National Summary Report compiles and summarizes aggregate information related to the States' progress in implementing HSIP projects. Progress in implementing HSIP projects is described based on the amount of HSIP funds available and the number and general listing of projects obligated during the 2017 reporting cycle. The HSIP 2017 National Summary Report is not intended to compare states; rather to illustrate how the states are collectively implementing the HSIP to reduce fatalities and serious injuries on all public roads across the nation. The HSIP 2017 National Summary Report also presents a national benefit cost ratio for the HSIP. |
|||
| 17. Key Words: Highway Safety Improvement Program, reporting guidance, improvement category, Strategic Highway Safety Plan, emphasis area, national summary |
18. Distribution Statement No restrictions. |
||
| 19. Security Classif. (of this report) Unclassified |
20. Security Classif. (of this page) Unclassified |
21. No. of Pages 32 |
22. Price N/A |
Form DOT F 1700.7 (8-72) Reproduction of form and completed page is authorized
Executive Summary
Background
HSIP Funding Approach
Data-Driven Safety Decision Making.
State Safety Programs Administered Under HSIP.
Methodology Types for Selected Programs Administered
Under HSIP.
HSIP Projects Overview
Project Cost
Functional Class and Ownership
Improvement Categories and Subcategories.
SHSP Emphasis Areas
2013-2016 Comparison
Comparison to Previous Years.
Benefit-Cost Analysis of the HSIP.
Summary
References
Appendix A: Full Description of HSIP Improvement
Categories and Sub Categories for 2013 HSIP Reporting Guidance
Appendix B. Detailed Tables of Project Costs
Summaries.
Table 1. Total number of projects and project cost
breakdown, 2013-2016
Table 2. Number of projects and average total project
cost for various project types, 2013-2016.
Table 3: Total Number and Cost of Projects by Year.
Table 4. Weighted BC Ratio for Segment and
Intersection Based Projects (weight based on total project cost)
Table 5: Number and Cost of 2016 Projects by
Improvement Category.
Table 6: Number and Cost of Projects by Subcategory
for Intersection Geometry.
Table 7: Number and Cost of Projects by Subcategory
for Intersection Traffic Control
Table 8: Number and Cost of Projects by Subcategory
for Pedestrians and Bicyclists.
Table 9: Number and Cost of Projects by Subcategory
for Roadway.
Table 10: Number and Cost of Projects by Subcategory
for Roadside.
Figure 1: FAST Act Annual Program Apportionments.
Figure 2: Number of State Safety Programs (top 9)
Figure 3: Number of State Safety Programs (bottom 9)
Figure 4: Count of PIM selected for programs
administered under HSIP.
Figure 5: Number of Projects by Project Cost.
Figure 6. Number of Projects by Functional Class.
Figure 7. Average Total Cost of Projects by Functional
Class.
Figure 8. Number and Average Total Cost of Projects by
Urban/Rural Designation.
Figure 9. Number of Projects by Road Ownership.
Figure 10. Average Total Cost of Projects by Road
Ownership.
Figure 11. Number of Projects by Improvement Category
(Top 11)
Figure 12. Number of Projects by Improvement Category
(Bottom 11)
Figure 13. Average Total Cost of Projects by
Improvement Category (top 11)
Figure 14. Average Total Cost of Projects by
Improvement Category (bottom 11)
Figure 15: Number of Intersection Geometry Projects by
Subcategory.
Figure 16: Number of Traffic Control Projects by
Subcategory. 15
Figure 17: Number of Pedestrian and Bicyclist Projects
by Subcategory.
Figure 18: Number of Roadway Projects by Subcategory.
Figure 19: Number of Roadside Projects by Subcategory.
Figure 20: Number of Projects by SHSP Emphasis Area.
The Highway Safety Improvement Program (HSIP) is a core Federal-aid highway program with the purpose to achieve a significant reduction in fatalities and serious injuries on all public roads. Under the Fixing America's Transportation System (FAST) Act, Congress authorized up to $2.4 billion per year for States to achieve this goal through the implementation of highway safety improvement projects. The States not only met this challenge, but far exceeded it obligating over $4 billion for over 4,600 highway safety improvement projects in 2017.
These highway safety improvement projects come in all shapes and sizes. Some HSIP projects are much bigger in scope than others, while other projects include countermeasure installations across multiple sites. The 2017 HSIP National Summary Report provides an aggregate summary of the type and cost of projects across all States. Provided below are highlights of the States' 2017 HSIP implementation efforts.
While the spending patterns don't change much from year to year, the number and cost of HSIP projects has continued to increase. There were 1,684 projects with a total cost of $1.61 billion in 2009, which rose to 4,616 projects with a total cost of $4.3 billion in 2017. Over the past eight years, States obligated $24.9 billion for more than 29,000 highway safety improvement projects. Based on a sample of 2017 HSIP projects, FHWA estimates that the benefits of the HSIP outweigh the costs on a scale ranging from 6.09 to 11.24.
The Highway Safety Improvement Program (HSIP) is a core Federal-aid highway program with the purpose to achieve a significant reduction in traffic fatalities and serious injuries on all public roads through the implementation of highway safety improvement projects. The HSIP, like other Federal-aid highway programs, is a federally-funded, state administered program. The FHWA establishes the HSIP requirements via 23 CFR Part 924, and the States develop and administer a program to best meet their needs.
The HSIP requires a data-driven, strategic approach to improving highway safety on all public roads that focuses on performance[1]. To obligate HSIP funds, each State shall:
States are also required to submit a report that describes the progress being made to implement highway safety improvement projects and the effectiveness of those improvements. [23 U.S.C. 148(h)] States prepared the 2017 reports using the HSIP Reporting Guidance, dated December 29, 2016. The HSIP Reporting Guidance outlines the content and schedule for the annual HSIP report. The HSIP report should include, at a minimum, a discussion of each State's:
The HSIP 2017 National Summary Report compiles and summarizes aggregate information related to the States progress in implementing HSIP projects during the 2017 reporting cycle. Progress in implementing HSIP projects is described based on the amount of HSIP funds available and the number and general listing of projects obligated as documented in the 2017 HSIP reports. The HSIP 2017 National Summary Report is not intended to compare states; rather to illustrate how the states are collectively implementing the HSIP to reduce fatalities and serious injuries on all public roads across the nation. The HSIP 2017 National Summary Report also presents a national benefit cost ratio for the HSIP.
A summary of available funding and the number and general listing of projects from prior years is available in the HSIP National Summary Baseline Report: 2009 -2012, HSIP 2013 National Summary Report, HSIP 2014 National Summary Report, HSIP 2015 National Summary Report, and HSIP 2016 National Summary Report.
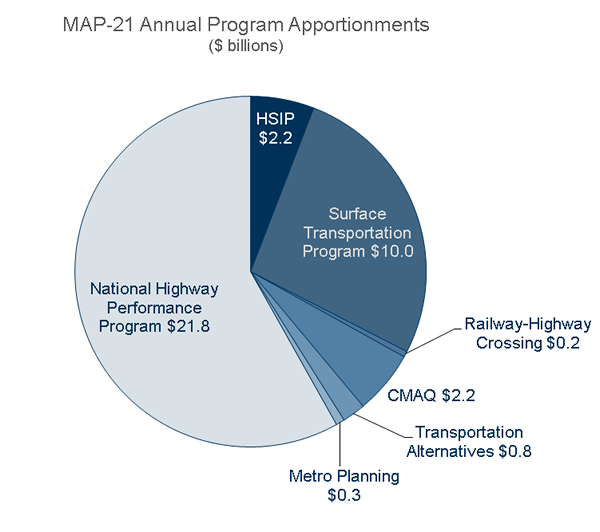
The FAST Act authorizes a single amount for each year for all the apportioned highway programs combined. That amount is apportioned among the States, and then each State's apportionment is divided among the individual apportioned programs.
The FAST Act (Section 1101) authorizes a total combined amount ($39.7 billion in FY 2016, $40.5 billion in FY 2017, $41.4 billion in FY 2018, $42.4 billion in FY 2019, and $43.4 billion in FY 2020) in contract authority to fund six formula programs (including certain set-asides within the programs described below):
Figure 1 illustrates the distribution of funds across programs under the FAST Act.
FAST Act Annual Program Apportionments FY17
HSIP receives 7% of the States apportionment remaining after allocations to NHPP, CMAQ and Metropolitan Planning, which amounts to approximately $2.5 billion each year. The following sums are set-aside from the State's HSIP apportionment:
In addition, if the High Risk Rural Roads Special rule applies to a State, then in the next fiscal year the State must obligate an amount at least equal to 200% of its FY 2009 HRRR set-aside for high risk rural roads. [23 U.S.C. 148(g)] Further, States that are subject to the 23 U.S.C. 154 and 164 penalties may also receive additional funding for HSIP projects.
HSIP funds, as defined for the remainder of this report, includes HSIP, HRRR and penalty transfer funds that are available to States for the advancement of highway safety improvement projects. Additionally, ‘States' refer to all states (excluding California), the District of Columbia, and Puerto Rico. The state of California was excluded from the 2017 HSIP Projects Overview analysis, as many data elements needed to complete the analysis were not available. HSIP expenditures by Puerto Rico is a new addition to the 2017 HSIP report. This data was not available for HSIP reports in previous years.
Beginning in 2016, the HSIP National Summary Report includes an evaluation of how states are using data-driven safety decision making to support their HSIP. This includes the States safety program administered under the HSIP and the methodologies states use to identify projects in each of these programs, as well as the amount of funds used for systemic improvements. On average, States obligated 40 percent of HSIP funds to address systemic improvements. The following sections and figures present information on State's safety programs and problem identification methodologies.
States provide a brief overview of each program administered under the HSIP as part of their annual HSIP report. The HSIP Manual[3]defines a program as a group of projects (not necessarily similar in type or location) implemented to achieve a common highway safety goal. For example, some States have one program that includes all projects resulting from the HSIP planning component. Other States have multiple "sub" programs. An example of a "sub" program may be a skid treatment program designed to reduce wet-weather-related crashes at different locations. Some States also refer to "sub" programs as initiatives.
Figure 2 and Figure 3 present the number of State safety programs for the 2017 reporting period. Most states have "Roadway Departure" (27 States) and "Intersection" (24 States) programs. Twenty-five states selected 48 programs in the "Other" category. Examples of programs in the "Other" category are: "pavement marking improvements", "longitudinal rumble strips", and "vulnerable road users".
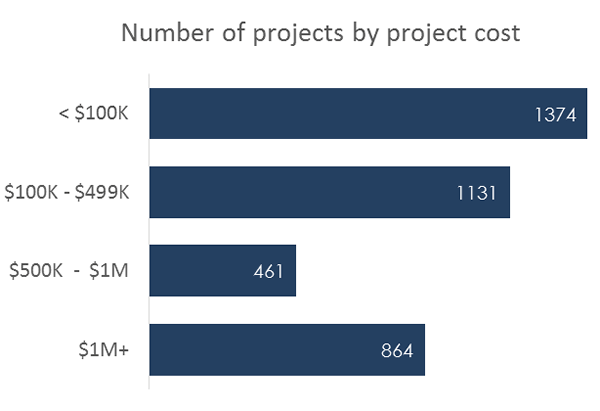
Figure 2:
Number of State Safety Programs (top 9)
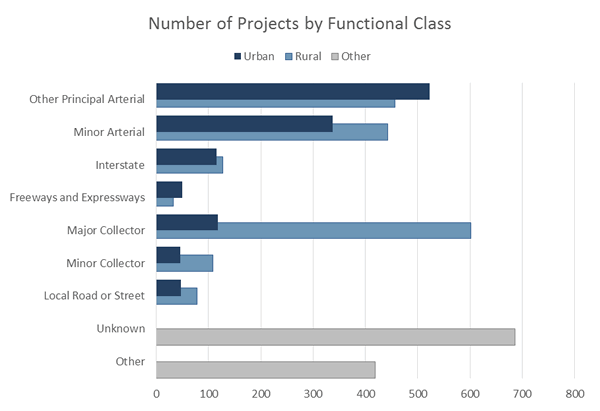
Figure 3:
Number of State Safety Programs (bottom 9)
For each State safety program administered under the HSIP, a State can also indicate what project identification methodology (PIM) was used for each program, consistent with the 13 PIMs or performance measures defined in the Highway Safety Manual[4]. Figure 4 presents the number of times a particular PIM was selected by the States. Please note that a State can select more than one PIM for each safety program. "Crash frequency" was selected 212 times while "Excess expected crash frequency using methods of moments" was only selected 1 time. Examples of methodologies in the "Other" category are: "Collaboration with county engineers" and "Hierarchical Bayesian Model".
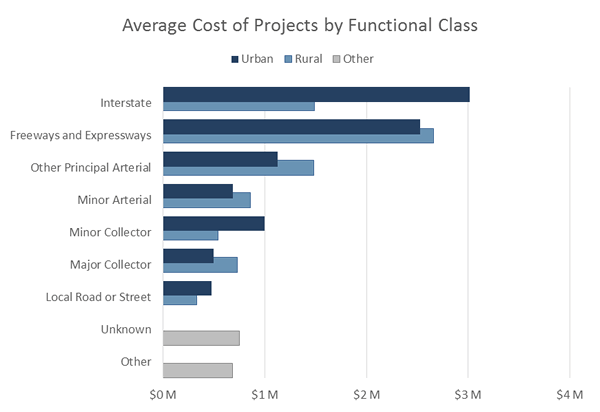
Figure 4: Count of PIM selected for programs
administered under HSIP
States provide project specific information for all projects obligated with HSIP funds during the reporting period in their annual HSIP reports. The reporting period is defined by the State and can be calendar year, state fiscal year or federal fiscal year. For 2017, the States obligated $4.3B for 4,616 total projects. These obligations utilized funds apportioned during the 2017 fiscal year as well as HSIP funds available from previous years' apportionments.
As per the HSIP Reporting Guidance, project specific information may include:
The following sections present various summaries of the nationwide HSIP project obligations for the 2017 reporting cycle. It should be noted that limited analysis of the project information can be done because not all states have included all of the above information for each project in their annual HSIP reports. Full use of the HSIP online reporting tool and the most recent HSIP reporting guidance will enable more complete and accurate reporting of national HSIP project data. In addition, HSIP projects come in all shapes and sizes. For example, some HSIP projects may be much bigger in scope than others, countermeasure installations across multiple sites, or non-infrastructure projects (i.e. transportation safety planning, data improvements). Nonetheless, the summaries in the following sections provide a broad scale analysis of HSIP spending for the 2017 reporting cycle by project cost, functional classification and ownership, improvement categories and subcategories, and SHSP emphasis areas.
In 2017, projects reporting $0 costs or projects reporting deobligated funds were excluded from analysis. Costs ranged widely. Some projects were small in scope and cost, such as installing a pedestrian signal. Others were higher cost projects, such as resurfacing a highway or realigning a curve. Figure 5 shows the breakdown by project cost, grouped into general categories with breakpoints at $100,000, $500,000, and $1,000,000.
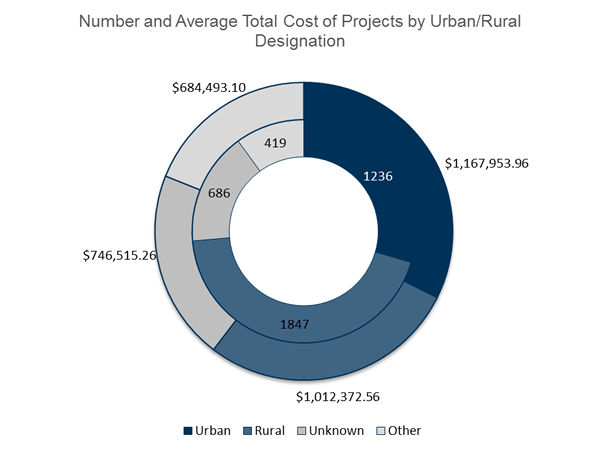
Figure 5:
Number of Projects by Project Cost
Roughly 69 percent of the projects had costs less than $500K. A small percentage (12 percent) fell into the $500K - $1M category. The remaining 19 percent were higher cost projects totaling $1M or more. The top five sub categories selected for these higher cost projects are:
In 2016, the breakdowns were similar. Over two-thirds of the projects had costs less than $500K, about 12 percent fell into the $500K - $1M category, and about 19 percent were more than $1M.
Figure 6 through Figure 10 illustrate the distribution of projects by road type.
Figure 6 shows number of projects by functional class, following the HPMS classification scheme. Figure 7 shows average total cost of projects by functional class. Figure 8 shows the number and average total cost of projects by urban/rural designation. Figure 9 shows projects by road ownership. Figure 10 shows average total cost of projects by road ownership. If the functional class or road ownership was not indicated, the project is counted under the "unknown" category. Examples of classifications in the "other" category include multiple functional classes, state or citywide implementation, or non-infrastructure projects.
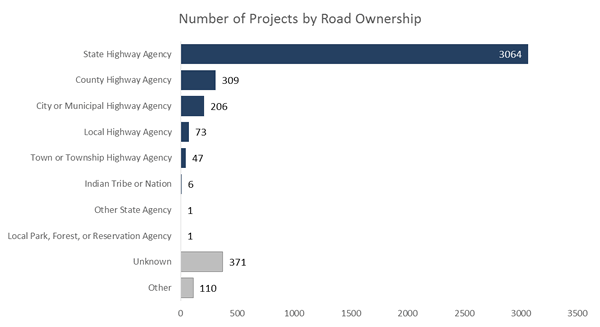
Figure 6. Number of Projects by Functional Class
As in 2016, projects that were associated with a functional class were most often categorized as "Rural Major Collector" or "Rural Minor Arterial" (Figure 6). There were 1179 projects categorized as "Unknown" indicating the State did not assign a functional classification to the project.
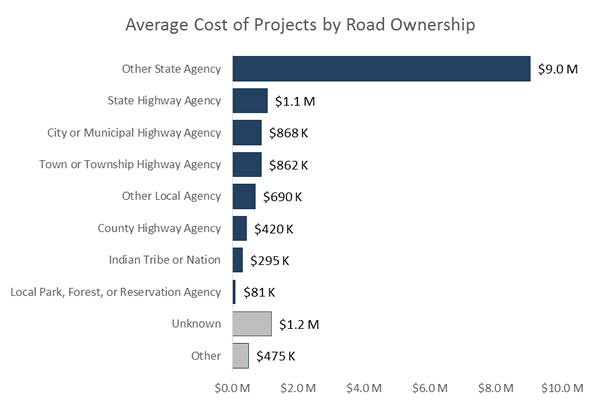
Figure 7.
Average Total Cost of Projects by Functional Class
Figure 7 shows the average total cost of projects by functional class. It is important to note that not every project had an associated cost so the average is based on the number of projects which had cost information available. Projects categorized as "Rural Principal Arterial – Freeways and Expressways" had the highest average total cost per project of $3.6 million and projects categorized as "Rural Local Road or Street" had the lowest average total cost per project of $194,500.
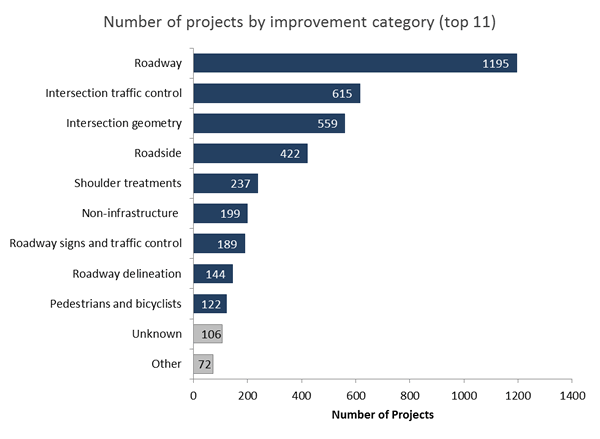
Figure 8.
Number and Average Total Cost of Projects by Urban/Rural Designation
Figure 8 illustrates the number and average total cost of projects by urban/rural designation. As in 2016 and 2015, there are fewer total urban projects than rural projects but the average total cost of the urban projects is greater than the average total cost of the rural projects.
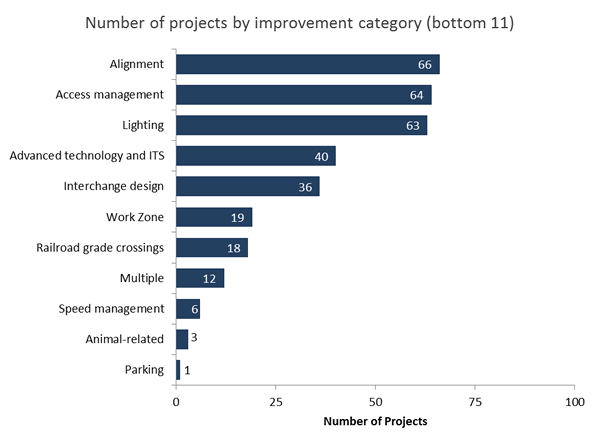
Figure 9.
Number of Projects by Road Ownership
As in 2015 and 2016, States implement most projects on roads owned by a "State Highway Agency" (Figure 9). There were 343 projects categorized as "Unknown" (indicating that the State did not indicate road ownership for a particular project). There were 86 projects categorized as "Other".
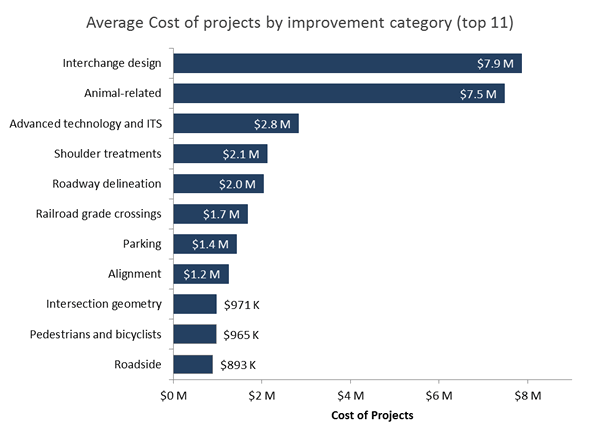
Figure 10.
Average Total Cost of Projects by Road Ownership
Figure 10 shows the average total cost of projects by road ownership. It is important to note that not every project had an associated cost so the average is based on the number of projects which had cost information available (excluding de-obligated costs). One singular project comprised the State Toll Authority category and had the highest total cost of all categories at $282 million. This is not included in the graph above so as not to detract from the relative average costs of the other projects.
Under the HSIP Reporting Guidance, each project should be assigned a general improvement category and a subcategory under that general category. While a single project may consist of multiple project types, FHWA suggests States assign each project to only one category. The category chosen should align with the primary purpose of the project. Figure 11 and Figure 12 show the distribution of the number of projects by general improvement category. Figure 13 and Figure 14 combined show the distribution of the average cost of projects by general improvement category. Projects categorized as "Unknown" indicate that there was no general improvement category assigned by the State. Figure 15 through Figure 19 show the breakdown of the number of projects by subcategory for five general improvement categories: Intersection geometry, Intersection traffic control, Pedestrians and bicyclists, Roadway, and Roadside. More detailed tables with the cost spent in each subcategory are available in Appendix B. For ease of reporting, similar subcategories were grouped together. For example, in Figure 15 below, "Auxiliary lanes – other" combines adding acceleration lanes, adding auxiliary through lanes, adding two way left turn lanes, and several other related subcategories.
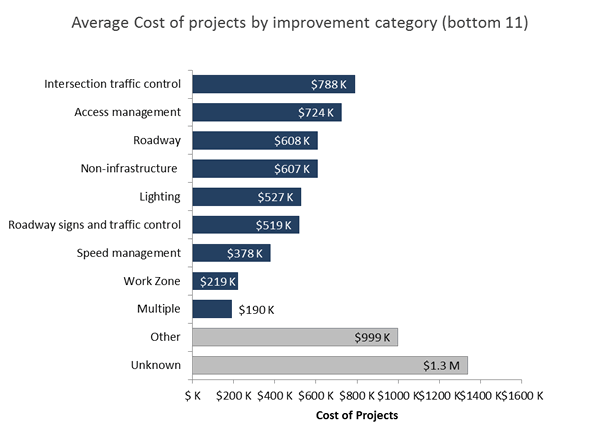
Figure 11.
Number of Projects by Improvement Category (Top 11)
Figure 11 shows the number of projects by improvement category (top 11) as classified in the HSIP Reporting Guidance. Based on the project information reported by the States, the top five improvement categories are roadway, intersection traffic control, roadside, intersection geometry, and roadway signs and traffic control. In 2016, the top five improvement categories were the same. The number of projects classified in each category and the ranking of project categories were similar, also, compared to 2016.
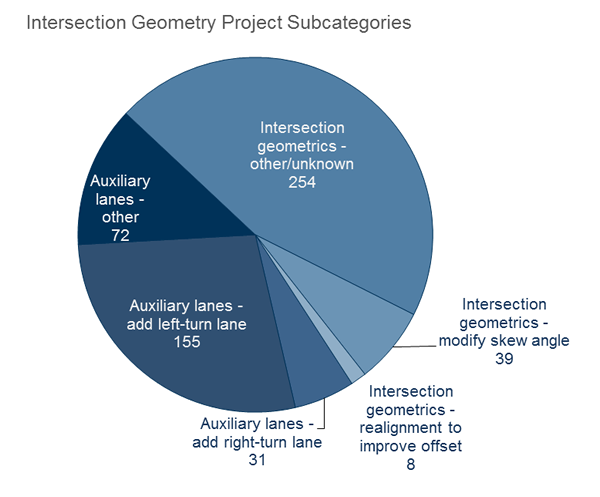
Figure 12. Number of Projects by Improvement
Category (Bottom 8)
Figure 12 shows the number of projects by improvement category (bottom 8) as classified in the HSIP Reporting Guidance. Note that in 2017 there were no projects reported for work zone, multiple, or animal-related categories. The number of speed management and advanced technology and ITS projects nearly doubled, and there were half as many interchange design projects. The remaining bottom-ranking categories were similar to 2016.
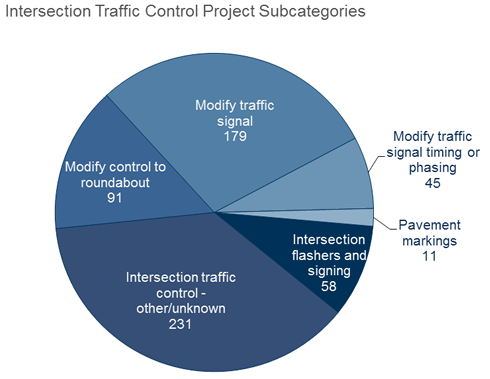
Figure 13.
Average Total Cost of Projects by Improvement Category (top 11)
Figure 13 shows the average total cost of projects by improvement category (top 11). It is important to note that, unlike 2016, the average is based only on the number of projects with costs available (projects with deobligated costs and those reporting $0 cost were excluded). This makes comparisons across years difficult, however, the notable differences in average project costs are below.
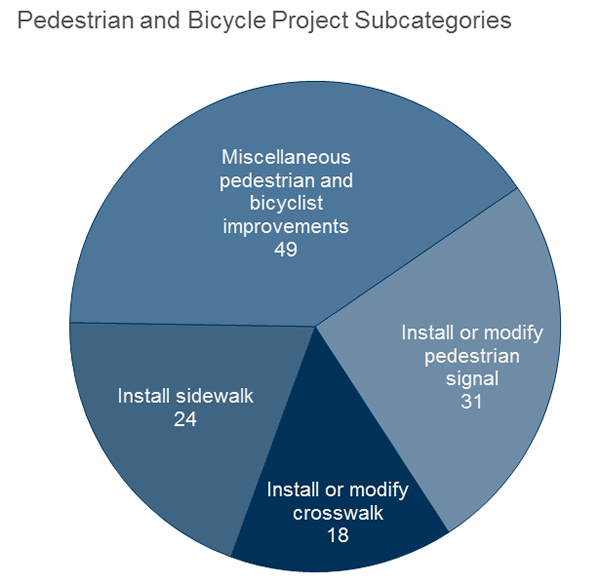
Figure 14.
Average Total Cost of Projects by
Improvement Category (bottom 8)
Based on project information reported by the States (Figure 14), the lowest average HSIP cost projects are in the following categories:
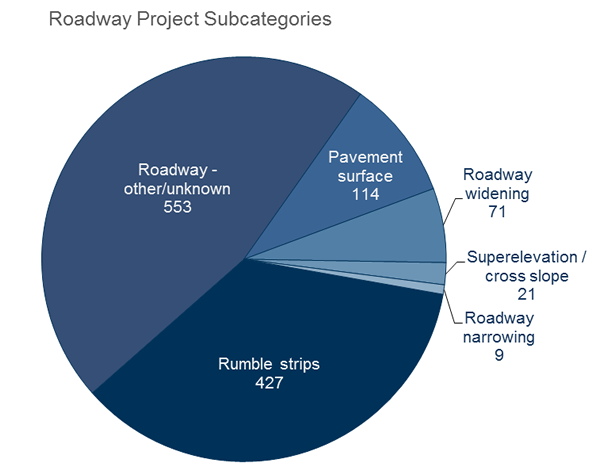
Figure 15:
Number of Intersection Geometry Projects by Subcategory
The report highlights further evaluation of the intersection geometry and intersection traffic control categories because in 2017 (as in previous years) they ranked in the top five in terms of number of projects categorized (Figure 15). FHWA has also identified intersections as one of three focus areas for the Focused Approach to Safety effort.
For the Intersection geometry category, most projects are sub categorized as "Intersection geometrics – other/unknown" (41 percent; 182 of 439 projects) or "Auxiliary lanes – add left-turn lane" (31 percent; 136 of 439 projects). Examples of projects in the "Intersection geometrics – other/unknown" subcategory include modify intersection corner radius and general intersection safety improvement projects. The "Intersection geometrics – other/unknown" subcategory is predominately used without any project description, therefore, no other information is available for these projects.
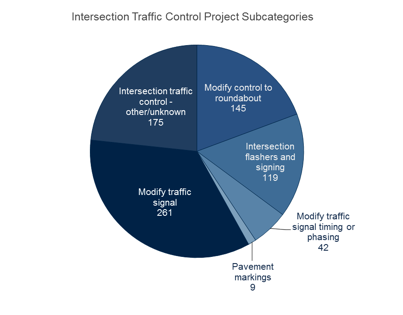
Figure 16: Number of Traffic Control Projects by
Subcategory
For the Intersection traffic control category in Figure 16, most projects are subcategorized as "Modify traffic signal" (35 percent; 261 of 751 projects), "Intersection traffic control – other/unknown" (23 percent; 175 of 751 projects), and "Modify control to roundabout" (19 percent; 145 of 751 projects). Examples of projects in the "Intersection traffic control – other/unknown" category include projects described as signal and stop controlled systemic improvements and general intersection traffic control improvement projects. Examples of projects in the "Modify traffic signal" category include modernization/replacement of traffic signal and adding flashing yellow arrow signals. The "Intersection traffic control – other/unknown" subcategory is predominately used without any project description, therefore, no other information is available for these projects.
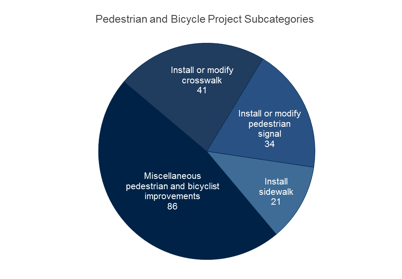
Figure 17: Number of Pedestrian and Bicyclist
Projects by Subcategory
The report highlights further evaluation of the pedestrian and bicycle category because infrastructure improvements in this category are of significant interest to various stakeholders (Figure 17). FHWA has also identified pedestrians and bicyclists as one of three focus areas under the Focused Approach to Safety effort.
For the Pedestrians and bicyclists category, most projects are subcategorized as "Miscellaneous pedestrian and bicyclist improvements" (47 percent; 86 of 182 projects) and "Install or modify crosswalk" (23 percent; 41 of 182 projects). Many of the projects in the "Miscellaneous pedestrian and bicyclist improvements" subcategory do not have any project description; therefore, no other information is available for these projects.
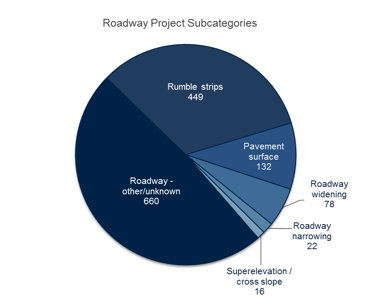
Figure 18:
Number of Roadway Projects by Subcategory
The report highlights further evaluation of the roadway category because in 2017 (as in previous years) it ranked as the number one category in terms of number of projects categorized (Figure 18). FHWA has also identified roadway departure as one of three focus areas for the Focused Approach to Safety effort.
For the Roadway category, most projects were subcategorized as "Roadway – other/unknown" (49 percent; 660 of 1357 projects) and "Rumble strips" (33 percent; 449 of 1357 projects). Examples of projects in the "Roadway – other/unknown" subcategory were projects such as "restripe to revise separation between opposing lanes and/or shoulder widths".
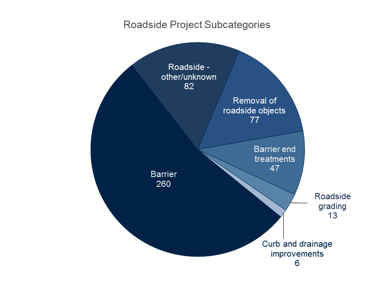
Figure 19: Number of Roadside Projects by Subcategory
The report highlights further evaluation of the roadside category was selected for further evaluation because in 2017 (as in previous years) it ranked in the top five in terms of number of projects categorized and is of recent national interest (Figure 19). For the Roadside category, most projects were subcategorized as "Barrier" (54 percent; 260 of 485 projects), "Roadside – other/unknown" (17 percent; 82 of 485 projects), and "Removal of roadside objects" (16 percent; 77 of 485 projects). Examples of two projects in the "Roadside – other/unknown" subcategory were "Barrier - removal" and "Fencing".
Based on a review of State SHSPs, FHWA identified the eight SHSP emphasis areas common across most States. These emphasis areas are used in the HSIP online reporting tool for categorizing HSIP projects. Figure 20 presents the number of HSIP projects categorized by SHSP emphasis area. For consistency and national reporting purposes, state-defined SHSP emphasis areas were assigned to these emphasis areas, where possible.
About 39 percent of the projects were categorized as "Roadway Departure" (42 percent in 2015 and 40 percent in 2016), 31 percent were categorized as "Intersections" (31 percent in 2015 and 29 percent in 2016), and 10 percent categorized as "Unknown/Other" (14 percent in 2015 and 13 percent in 2016). Examples of other categories used by the States include: "Highway infrastructure", "Railroad", and "Lighting".
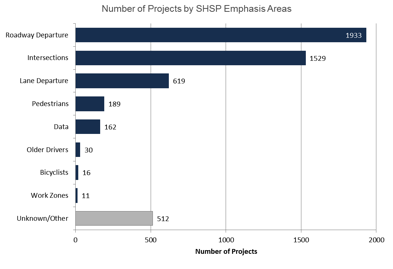
Figure 20:
Number of Projects by SHSP Emphasis Area
The number and cost of HSIP projects continues to increase each year. As shown in Table 1 below, the total number of projects and cost of projects did not change much from 2013 to 2014 but between 2015 and 2016, there were roughly 1000 more projects reported. This increasing trend continued in 2017, with an increase of about 500 projects over 2016. However, the breakdown in project costs for various breakpoints was similar across years.
Table 1. Total number of projects and project cost breakdown, 2013-2017
| Year | 2013 | % | 2014 | % | 2015 | % | 2016 | % | 2017 | % |
|---|---|---|---|---|---|---|---|---|---|---|
| Number of projects | 3292 | 3348 | 4188 | 4468 | 4943 | |||||
| Number of projects (with cost info.)* | 3171 | 3272 | 3830 | 3726 | 4616 | |||||
| Cost of projects* | $3.09B | $3.10B | $3.90B | $4.03B | $4.3B | |||||
| Average cost per project | $981K | $952K | $1.02M | $1.08M | $879K | |||||
| Number of projects <$100K | 1154 | 35% | 1011 | 30% | 1374 | 33% | 1106 | 25% | 1634 | 33% |
| Number of projects $100K - $499K | 985 | 30% | 1054 | 31% | 1131 | 27% | 1246 | 28% | 1550 | 31% |
| Number of projects $500K-$1M | 401 | 12% | 450 | 13% | 445 | 11% | 478 | 11% | 561 | 11% |
| Number of projects $1M+ | 631 | 19% | 757 | 23% | 880 | 21% | 896 | 20% | 871 | 18% |
| Number of projects with deobligated funds | 60 | 2% | 28 | 1% | 146 | 3% | 256 | 6% | 285 | 6% |
| Number of projects with $0 or blank | 61 | 2% | 48 | 1% | 212 | 5% | 486 | 11% | 42 | 1% |
* For 2017, number of projects with cost info and cost of projects do not include projects with deobligated funds or where the value entered was $0, nor do they include projects in California. Also, for the first time 2017 data includes PR HSIP projects. Therefore, comparisons with previous years should be made with caution.
Table 2 shows the 2013 through 2017 comparison of the number of projects and average total cost of projects for various project types highlighted in this report (does not include projects with deobligated funds or projects where no value was reported or the value entered was $0). For most project types, the number and cost of projects has increased over the four year period.
Table 2. Number of projects and average total project cost for various project types, 2013-2017
| Project Type | Num Projects 2013 | Avg Cost 2013 | Num Projects 2014 | Avg Cost 2014 | Num Projects 2015 | Avg Cost 2015 | Num Projects 2016 | Avg Cost 2016 | Num Projects 2017 | Avg Cost 2017 |
|---|---|---|---|---|---|---|---|---|---|---|
| Urban | projects826 | $1.4M | 954 | $1.3M | 1236 | $1.2M | 1277 | $1.7M | 1179 | $1.2M |
| Rural projects | 1244 | $930K | 1361 | $890K | 1847 | $1.1M | 1683 | $956K | 1920 | $998K |
| Roadway projects | 854 | $639K | 722 | $955K | 1195 | $671K | 1244 | $1.1M | 1357 | $1.1M |
| Intersection traffic control projects | 420 | $682K | 505 | $702K | 615 | $798K | 608 | $704K | 751 | $560K |
| Intersection geometry projects | 376 | $1.3M | 379 | $983K | 559 | $1.0M | 458 | $1.1M | 439 | $910K |
| Ped/bike projects | 103 | $534K | 118 | $507K | 122 | $965K | 180 | $866K | 182 | $667K |
| Roadside projects | 225 | $951K | 303 | $810K | 422 | $893K | 444 | $1.2M | 485 | $896K |
Note: For 2017, number of projects and average cost do not include projects with deobligated funds or where the value entered was $0, nor do they include projects in California. Also, for the first time 2017 data includes PR HSIP projects. Therefore, comparisons with previous years should be made with caution.
The HSIP National Summary Baseline Report 2009-2012 reported project and cost information for HSIP reports submitted by the States for years 2009-2012. The information from the baseline report is summarized below with the purpose of comparing basic cost and project information to the 2013 through 2017 reports. Table 3 below shows that States obligated $24.9B for more than 29,000 projects over the eight-year period. These obligations include not only HSIP funds apportioned during the reporting period (2009-2017), but also HSIP funds available from previous years' apportionments.
Table 3. Total Number and Cost of Projects by Year
| Year | 2009 | 2010 | 2011 | 2012 | 2013 | 2014 | 2015 | 2016 | 2017 | Total |
|---|---|---|---|---|---|---|---|---|---|---|
| Num Projects | 1,684 | 2,386 | 2,523 | 2,429 | 3,292 | 3,348 | 4,188 | 4,468 | 4943 | 29,261 |
| Num Projects (with cost info.)* | 1,568 | 2,320 | 2,397 | 2,311 | 3,171 | 3,272 | 3,830 | 3,726 | 4616 | 27,211 |
| Cost of projects* | $1.61B | $1.46B | $1.78B | $1.65B | $3.09B | $3.10B | $3.90B | $4.03B | $4.3B | $24.9B |
| Avg. Cost Per Project* | $1.0M | $629K | $743K | $722K | $981K | $952K | $1.0M | $1.1M | $940K | $896K |
* For 2017, number of projects with cost info and cost of projects do not include projects with deobligated funds or where the value entered was $0, nor do they include projects in California. Also, for the first time 2017 data includes PR HSIP projects. Therefore, comparisons with previous years should be made with caution.
FHWA also conducted a national evaluation of the HSIP to estimate expected program results using the project information from the 2017 HSIP reports. The purpose of the evaluation was to estimate a national benefit cost ratio for the HSIP. The HSIP national benefit cost ratio provides an indication of the programs national impact and the benefits the public can expect from investments in the HSIP.
The evaluation methodology makes use of the full project listing information from 49 States plus the District of Columbia (2017 HSIP Project Database) and associated crash modification factors (CMFs) from the CMF Clearinghouse, the Fatality Analysis Reporting System (FARS), the Highway Performance Monitoring System (HPMS), the Highway Safety Information System (HSIS), FHWA, and various reports. California was excluded from the analysis, as many elements needed for the analysis were not available. Puerto Rico was also excluded, given that road improvement project needs and costs deviate from those in the continental U.S. The following steps indicate how to apply the selected methodology for projects in the 2017 HSIP Project Database with complete data:
For this reporting cycle, it was possible to calculate the expected project level benefit cost ratios for 1,194 segment and intersection-based projects, which is approximately 24 percent of the projects listed in the 2017 HSIP Project Database. Table 4 presents the weighted results (based on amount of HSIP funds that were spent for that project). Many projects had a range of years for the assumed service life, so the table presents the BC ratio according to the minimum and maximum service lives.
The values in the bottom row of Table 4 (ranging from 6.09 to 11.24) represent the range of BC ratios for the HSIP program for segment and intersection-based improvement projects, depending on the minimum or maximum service life of the treatment and discount rate. Comparatively, the range for the 2016 HSIP project listing was 4.36 to 6.51.
Table 4. Weighted BC Ratio for Segment and Intersection Based Projects (weight based on total project cost)
| Weighted BC Ratio (min Service Life, 3% discount rate) | Weighted BC Ratio (max Service Life, 3% discount rate) | Weighted BC Ratio (min Service Life, 7% discount rate) | Weighted BC Ratio (max Service Life, 7% discount rate) | |
|---|---|---|---|---|
| 869 Segment Based HSIP Projects (weighted on segment project cost) | 7.86 |
11.98 |
6.28 |
8.57 |
| 325 Intersection Based HSIP Projects (weighted on intersection project cost) | 6.73 | 7.60 | 5.00 | 5.47 |
| 1,194 Segment & Intersection Based HSIP Projects (weighted on segment & intersection project cost) | 7.71 | 11.24 | 6.09 | 8.04 |
Many projects could not be included in analysis because they were either missing key data elements (e.g., number of miles or intersections treated, CMF, project cost, etc.) or were non-infrastructure projects. The calculated benefit-cost ratio for each of the 1,194 projects relied heavily on assumptions for each project regarding the applicable CMF, service life, crash rate, and injury severity cost.
The HSIP is a performance-driven program that uses data and
analysis to target safety resources. This HSIP 2017 National
Summary Report shows that in 2017, States directed HSIP funds to address the
predominant infrastructure -related crash types: roadway departure,
intersection and pedestrian crashes, similar to previous years. On average,
States obligated 40 percent of HSIP funds to address systemic improvements. While
the basic characteristics (rural and urban, improvement categories, and SHSP
emphasis areas) of HSIP spending remains fairly consistent from year to year, the
number and cost of HSIP projects has continued to increase over the seven-year
period from 1,684 projects with a total cost of $1.61 billion in 2009 to 4,616
projects with a total cost of $4.3 billion in 2017. Based on a sample of 2017
HSIP projects, FHWA estimates that the benefits of the HSIP outweigh the costs
on a scale ranging from 7.7 to 11.2.
FHWA, FAST Act Apportionment Fact Sheet
https://www.fhwa.dot.gov/fastact/factsheets/apportionmentfs.cfm
FHWA, HSIP Apportionment Notices
http://www.fhwa.dot.gov/legsregs/directives/notices/
FHWA, HSIP FAST Act Fact Sheet
https://www.fhwa.dot.gov/fastact/factsheets/hsipfs.cfm
FHWA, HSIP Reporting Guidance, February 13, 2013
https://safety.fhwa.dot.gov/legislationandpolicy/fast/hsip_reporting_guidance.cfm
FHWA, HSIP Online Reporting Tool
http://safety.fhwa.dot.gov/hsip/resources/onrpttool/
FHWA, HSIP National Summary Baseline Report 2009-2012
http://safety.fhwa.dot.gov/hsip/reports/nsbrpt_2009_2012.cfm
FHWA, HSIP 2013 National Summary Report
http://safety.fhwa.dot.gov/hsip/reports/nsbrpt2013.cfm
FHWA, HSIP 2014 National Summary Report
http://safety.fhwa.dot.gov/hsip/reports/pdf/2014/hsip_natl2014.pdf
FHWA, HSIP 2015 National Summary Report
http://safety.fhwa.dot.gov/hsip/reports/pdf/2015/hsip_natl2015.pdf
FHWA, HSIP 2016 National Summary Report
http://safety.fhwa.dot.gov/hsip/reports/pdf/2016/hsip_natl2016.pdf
2017 State HSIP Reports
http://safety.fhwa.dot.gov/hsip/reports/
| Category | Sub-category |
|---|---|
| Access management | Access management – other |
| Change in access – close or restrict existing access | |
| Change in access – miscellaneous/unspecified | |
| Grassed median – extend existing | |
| Median crossover – close crossover | |
| Median crossover – directional crossover | |
| Median crossover – relocate existing | |
| Median crossover – unspecified | |
| Raised island – install new | |
| Raised island – modify existing | |
| Raised island – remove existing | |
| Raised island – unspecified | |
| Advanced technology and ITS | Advanced technology and ITS – other |
| Congestion detection / traffic monitoring system | |
| Dynamic message signs | |
| Over height vehicle detection | |
| Alignment | Alignment – other |
| Horizontal curve realignment | |
| Horizontal and vertical alignment | |
| Vertical alignment or elevation change | |
| Animal-related | Animal related |
| Interchange design | Acceleration / deceleration / merge lane |
| Convert at-grade intersection to interchange | |
| Extend existing lane on ramp | |
| Improve intersection radius at ramp terminus | |
| Installation of new lane on ramp | |
| Interchange design – other | |
| Ramp closure | |
| Ramp metering | |
| Intersection geometry | Auxiliary lanes – add acceleration lane |
| Auxiliary lanes – add auxiliary through lane | |
| Auxiliary lanes – add left-turn lane | |
| Auxiliary lanes – add right-turn lane | |
| Auxiliary lanes – add right-turn lane (free-flow) | |
| Auxiliary lanes – add slip lane | |
| Auxiliary lanes – add two-way left-turn lane | |
| Auxiliary lanes – extend acceleration/deceleration lane | |
| Auxiliary lanes – extend existing left-turn lane | |
| Auxiliary lanes – extend existing right-turn lane | |
| Auxiliary lanes – miscellaneous/other/unspecified | |
| Auxiliary lanes – modify acceleration lane | |
| Auxiliary lanes – modify auxiliary through lane | |
| Auxiliary lanes – modify free-flow turn lane | |
| Auxiliary lanes – modify left-turn lane offset | |
| Auxiliary lanes – modify right-turn lane offset | |
| Auxiliary lanes – modify turn lane storage | |
| Auxiliary lanes – modify turn lane taper | |
| Auxiliary lanes – modify two-way left-turn lane | |
| Intersection geometrics – miscellaneous/other/unspecified | |
| Intersection geometrics – modify intersection corner radius | |
| Intersection geometrics – modify skew angle | |
| Intersection geometrics – realignment to align offset cross streets | |
| Intersection geometrics – realignment to increase cross street offset | |
| Intersection geometrics – re-assign existing lane use | |
| Intersection geometry – other | |
| Splitter island – install on one or more approaches | |
| Splitter island – remove from one or more approaches | |
| Splitter island – unspecified | |
| Through lanes – add additional through lane | |
| Intersection traffic control | Intersection flashers – add "when flashing" warning sign-mounted |
| Intersection flashers – add advance emergency vehicle warning sign-mounted | |
| Intersection flashers – add advance heavy vehicle warning sign-mounted | |
| Intersection flashers – add advance intersection warning sign-mounted | |
| Intersection flashers – add miscellaneous/other/unspecified | |
| Intersection flashers – add overhead (actuated) | |
| Intersection flashers – add overhead (continuous) | |
| Intersection flashers – add stop sign-mounted | |
| Intersection flashers – modify existing | |
| Intersection flashers – remove existing | |
| Intersection signing – add basic advance warning | |
| Intersection signing – add enhanced advance warning (double-up and/or oversize) | |
| Intersection signing – add enhanced regulatory sign (double-up and/or oversize) | |
| Intersection signing – miscellaneous/other/unspecified | |
| Intersection signing – relocate existing regulatory sign | |
| Intersection traffic control – other | |
| Modify control – all-way stop to roundabout | |
| Modify control – modifications to roundabout | |
| Modify control – no control to roundabout | |
| Modify control – no control to two-way stop | |
| Modify control – remove right-turn yield | |
| Modify control – reverse priority of stop condition | |
| Modify control – traffic signal to roundabout | |
| Modify control – two-way stop to all-way stop | |
| Modify control – two-way stop to roundabout | |
| Modify control – two-way yield to two-way stop | |
| Pavement Markings – add advance signal ahead | |
| Pavement markings – add advance stop ahead | |
| Pavement markings – add dashed edge line along mainline | |
| Pavement markings – add lane use symbols | |
| Pavement markings – add stop line | |
| Pavement markings – add yield line | |
| Pavement markings – miscellaneous/other/unspecified | |
| Pavement markings – refresh existing pavement markings | |
| Modify traffic signal – add additional signal heads | |
| Modify traffic signal – add backplates | |
| Modify traffic signal – add backplates with retroreflective borders | |
| Modify traffic signal – add closed loop system | |
| Modify traffic signal – add emergency vehicle preemption | |
| Modify traffic signal – add flashing yellow arrow | |
| Modify traffic signal – add long vehicle detection | |
| Modify traffic signal – add railroad preemption | |
| Modify traffic signal – add wireless system | |
| Modify traffic signal – miscellaneous/other/unspecified | |
| Modify traffic signal – modernization/replacement | |
| Modify traffic signal – modify signal mounting (spanwire to mast arm) | |
| Modify traffic signal – remove existing signal | |
| Modify traffic signal – replace existing indications (incandescent-to-LED and/or 8-to-12 inch dia.) | |
| Modify traffic signal timing – left-turn phasing (permissive to protected/permissive) | |
| Modify traffic signal timing – left-turn phasing (permissive to protected-only) | |
| Modify traffic signal timing – adjust clearance interval (yellow change and/or all-red) | |
| Modify traffic signal timing – general retiming | |
| Modify traffic signal timing – signal coordination | |
| Systemic improvements – signal-controlled | |
| Systemic improvements – stop-controlled | |
| Lighting | Continuous roadway lighting |
| Intersection lighting | |
| Lighting – other | |
| Site lighting – horizontal curve | |
| Site lighting – intersection | |
| Site lighting – interchange | |
| Site lighting – pedestrian crosswalk | |
| Miscellaneous | Miscellaneous |
| Non-infrastructure | Educational efforts |
| Enforcement | |
| Data/traffic records | |
| Non-infrastructure – other | |
| Outreach | |
| Road safety audits | |
| Training and workforce development | |
| Transportation safety planning | |
| Parking | Modify parking |
| Parking – other | |
| Remove parking | |
| Restrict parking | |
| Truck parking facilities | |
| Pedestrians and bicyclists | Crosswalk |
| Install new "smart" crosswalk | |
| Install new crosswalk | |
| Install sidewalk | |
| Medians and pedestrian refuge areas | |
| Miscellaneous pedestrians and bicyclists | |
| Modify existing crosswalk | |
| Pedestrian beacons | |
| Pedestrian bridge | |
| Pedestrian signal | |
| Pedestrian signal – audible device | |
| Pedestrian signal – Pedestrian Hybrid Beacon | |
| Pedestrian signal – install new at intersection | |
| Pedestrian signal – install new at non-intersection location | |
| Pedestrian signal – modify existing | |
| Pedestrian signal – remove existing | |
| Pedestrian warning signs – add/modify flashers | |
| Pedestrian warning signs – overhead | |
| Railroad grade crossings | Grade separation |
| Model enforcement activity | |
| Protective devices | |
| Railroad grade crossing gates | |
| Railroad grade crossing signing | |
| Railroad grade crossings – other | |
| Surface treatment | |
| Upgrade railroad crossing signal | |
| Widen crossing for additional lane | |
| Roadside | Barrier end treatments (crash cushions, terminals) |
| Barrier transitions | |
| Barrier – cable | |
| Barrier – concrete | |
| Barrier- metal | |
| Barrier – other | |
| Barrier – removal | |
| Curb or curb and gutter | |
| Drainage improvements | |
| Fencing | |
| Removal of roadside objects (trees, poles, etc.) | |
| Roadside grading | |
| Roadside – other | |
| Roadway | Install / remove / modify passing zone |
| Pavement surface – high friction surface | |
| Pavement surface – miscellaneous | |
| Roadway narrowing (road diet, roadway reconfiguration) | |
| Roadway – other | |
| Roadway – restripe to revise separation between opposing lanes and/or shoulder widths | |
| Roadway widening – add lane(s) along segment | |
| Roadway widening – curve | |
| Roadway widening – travel lanes | |
| Rumble strips – center | |
| Rumble strips – edge or shoulder | |
| Rumble strips – transverse | |
| Rumble strips – unspecified or other | |
| Superelevation / cross slope | |
| Roadway delineation | Improve retroreflectivity |
| Longitudinal pavement markings – new | |
| Longitudinal pavement markings – remarking | |
| Delineators post-mounted or on barrier | |
| Raised pavement markers | |
| Roadway delineation – other | |
| Roadway signs and traffic control | Curve-related warning signs and flashers |
| Sign sheeting – upgrade or replacement | |
| Roadway signs and traffic control – other | |
| Roadway signs (including post) – new or updated | |
| Shoulder treatments | Widen shoulder – paved or other |
| Pave existing shoulders | |
| Shoulder grading | |
| Shoulder treatments – other | |
| Speed management | Modify speed limit |
| Radar speed signs | |
| Speed detection system / truck warning | |
| Speed management – other | |
| Traffic calming feature | |
| Work Zone | Work zone |
Table 5: Number and Cost of 2016 Projects by Improvement Category
| Improvement Category | Number of Projects | Total Cost of Projects* | Average Total Cost* | Total HSIP Cost of Projects* | Average HSIP Cost* |
|---|---|---|---|---|---|
| Access management | 64 | $74,760,421.63 | $1,168,131.59 | $65,609,668.99 | $1,025,151.08 |
| Advanced technology and ITS | 42 | $31,848,611.38 | $758,300.27 | $22,544,587.59 | $536,775.90 |
| Alignment | 65 | $153,626,691.05 | $2,363,487.55 | $63,073,225.32 | $970,357.31 |
| Interchange design | 23 | $193,051,802.75 | $8,393,556.64 | $36,388,116.75 | $1,582,092.03 |
| Intersection geometry | 439 | $398,585,860.99 | $907,940.46 | $276,314,575.08 | $620,931.63 |
| Intersection traffic control | 751 | $442,846,841.12 | $560,125.18 | $358,243,478.45 | $472,616.73 |
| Lighting | 93 | $46,458,619.35 | $499,555.05 | $40,646,142.63 | $432,405.77 |
| Non-infrastructure | 219 | $139,807,086.04 | $638,388.52 | $118,596,054.09 | $527,093.57 |
| Parking | 1 | $29,851.00 | $29,851.00 | $29,851.00 | $29,851.00 |
| Pedestrians and bicyclists | 182 | $121,344,341.05 | $666,727.15 | $84,651,228.67 | $465,116.64 |
| Railroad grade crossings | 42 | $18,450,793.38 | $439,304.60 | $16,761,825.71 | $399,091.09 |
| Roadside | 485 | $476,249,772.09 | $896,312.91 | $402,171,182.34 | $809,197.55 |
| Roadway | 1357 | $1,058,049,971.39 | $1,076,475.86 | $617,723,044.93 | $385,354.36 |
| Roadway delineation | 204 | $184,194,677.28 | $666,475,86 | $157,313,050.64 | $731,688.61 |
| Roadway signs and traffic control | 287 | $192,659,872.09 | $587,258.09 | $101,935,209.02 | $346,718.40 |
| Shoulder treatments | 210 | $363,212,864.01 | $1,729,585.07 | $254,852,620.76 | $1,219,390.53 |
| Speed management | 13 | $3,209,230.00 | $246,863.85 | $3,018,830.00 | $232,217.69 |
| Unknown | 139 | $176,924,514.00 | $1,272,838.23 | $49,584,016.00 | $1,502,545.94 |
| Total | 4616 | $4,341,957,584.51 | $940,632.06 | $2,518,276,630.07 | $553,747.87 |
* Not all states provided cost data for all projects in a given improvement category. Projects that reported $0 costs or deobligated funds were excluded.
Table 6: Number and Cost of Projects by Subcategory for Intersection Geometry
| Subcategory | Number of Projects | Total Cost |
|---|---|---|
| Subcategory | Number of Projects | Total Cost |
| Auxiliary lanes - add left-turn lane | 136 | $101,550,943.86 |
| Auxiliary lanes - add right-turn lane | 29 | $11,465,462.42 |
| Auxiliary lanes - other | 51 | $51,788,843.41 |
| Intersection geometrics - modify skew angle | 33 | $15,960,270.87 |
| Intersection geometrics - other/unknown | 182 | $193,383,140.56 |
| Intersection geometrics - realignment to improve offset | 8 | $24,437,199.87 |
| Total | 439 | $398,585,861.00 |
* Not all states provided cost data for all projects in a given improvement category. Projects that reported $0 costs or deobligated funds were excluded.
Table 7: Number and Cost of Projects by Subcategory for Intersection Traffic Control
| Subcategory | Number of Projects | Total Cost | |
|---|---|---|---|
| Intersection flashers and signing | 119 | $7,707,507.13 | |
| Intersection traffic control –other/unknown | 175 | $113,560,531.44 | |
| Modify control to roundabout | 145 | $130,600,666.73 | |
| Modify traffic signal | 261 | $132,689,328.79 | |
| Modify traffic signal timing or phasing | 42 | $31,895554.75 | |
| Pavement markings | 9 | $4,200,421.27 | |
| Total | 751 | $420,654,010.11 | |
* Not all states provided cost data for all projects in a given improvement category. Projects that reported $0 costs or deobligated funds were excluded.
Table 8: Number and Cost of Projects by Subcategory for Pedestrians and Bicyclists
| Subcategory | Number of Projects | Total Cost |
|---|---|---|
| Install or modify crosswalk | 41 | $14,170,648.98 |
| Install or modify pedestrian signal | 34 | $25,140,421.27 |
| Install sidewalk | 21 | $13,158,657.49 |
| Miscellaneous pedestrian and bicyclist improvements | 86 | $68,874,613.31 |
| Total | 182 | $121,344,341.05 |
* Not all states provided cost data for all projects in a given improvement category. Projects that reported $0 costs or deobligated funds were excluded.
Table 9: Number and Cost of Projects by Subcategory for Roadway
| Subcategory | Number of Projects | Total Cost |
|---|---|---|
| Pavement surface | 132 | $111,864,938.43 |
| Roadway - other/unknown | 660 | $835,554,866.68 |
| Roadway narrowing (road diet, roadway reconfiguration) | 22 | $62,955,317.75 |
| Roadway widening | 78 | $267,095,319.86 |
| Rumble strips | 449 | $178,430,020.86 |
| Superelevation / cross slope | 16 | $4,876,516.00 |
| Total | 1357 | $1,460,776,979.58 |
* Not all states provided cost data for all projects in a given improvement category. Projects that reported $0 costs or deobligated funds were excluded.
Table 10: Number and Cost of Projects by Subcategory for Roadside
| Subcategory | Number of Projects | Total Cost |
|---|---|---|
| Barrier | 260 | $256,418,193.73 |
| Barrier end treatments | 47 | $47,130,180.55 |
| Curb and drainage improvements | 6 | $3,412,586.85 |
| Removal of roadside objects | 77 | $46,889,479.08 |
| Roadside grading | 13 | $14,131,963.89 |
| Roadside – other/unknown | 82 | $66,729,356.56 |
| Total | 485 | $434,711,760.66 |
* Not all states provided cost data for all projects in a given improvement category. Projects that reported $0 costs or deobligated funds were excluded.
[1] FHWA, Fast Act HSIP Fact Sheet, February 2016. https://www.fhwa.dot.gov/fastact/factsheets/hsipfs.cfm
[2] FHWA, Fast Act Apportionment Fact Sheet, February 2016. https://www.fhwa.dot.gov/fastact/factsheets/apportionmentfs.cfm
[3] FHWA, Highway Safety Improvement Program Manual, FHWA-SA-09-029, January 2010. https://safety.fhwa.dot.gov/hsip/resources/fhwasa09029/
[4] Highway Safety Manual, 1st edition, AASHTO, Washington, D.C., 2010.
[5] Harmon, Tim, Geni Bahar, and Frank Gross. Crash Costs for Highway Safety Analysis, Federal Highway Administration, Report FHWA-SA-17-071, January 2018.
[6] Council, F., E. Zaloshnja, T. Miller, and B. Persaud. "Crash Cost Estimates by Maximum Police-Reported Injury Severity Within Selected Crash Geometries", FHWA-HRT-05-051, FHWA Office of Safety R&D, October 2005.
[7] Persaud, B. "How to convert value of a statistical life to cost per crash by severity, crash type and speed limit", FHWA Draft Memo for DCMF Evaluations (unpublished), November 2014.