U.S. Department of Transportation
Federal Highway Administration
1200 New Jersey Avenue, SE
Washington, DC 20590
202-366-4000
Sign up to have Safety Compass delivered right to your inbox!
Best for printing: PDF Version (1.9 MB)
In this issue:
A Message from the FHWA Associate Administrator for Safety, Cheryl Walker
What's New?
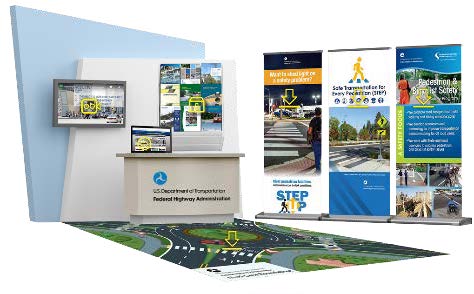
U.S. Department of Transportation Launches Virtual Series on Pedestrian Safety
Safety-Driven Changes and Improvements
USLIMITS2: A Data-Driven Tool for Setting Speed Limits
Saving Lives with Effective Transportation Planning
Reducing Roadway Departure in Tribal Areas
Saving Lives through Local Road Safety Plan Implementation
How a Workshop Brought Harmful Events to a Halt
Operation Lifesaver Stays on Track with Rail Safety Education
Local Road Curve Sign Compliance and Safety in Pennsylvania
Effectively Engaging Stakeholders in a Safe System Approach to Transform Traffic Safety Culture
Learning Together
Pedestrian and Bicycle Safety Program Offers Free Online Technical Assistance and Training
Rural Road Safety in Montana: It's Everyone's Job
Maximize Use of Dashboards for Data Analysis in the Highway Safety Program
New Resource Roundup
New Zero Deaths Success Stories Available Online
Announcements
2021 TRB Annual Meeting—A Virtual Event
Coming Soon: Local Road Safety Plan "Do-it-Yourself" Website for Local Agencies
U.S. Department of Transportation Develops Applicant Toolkit to Support Rural Project Sponsors

What is it about alliteration that is so appealing? I think it's the cohesiveness of the sound. It brings together commonalities. There is nothing quite like pulling together a group around a common cause. A goal. And the energy level and the feeling of cohesion that come with it.
That's exactly how I felt during the U.S. Department of Transportation Pedestrian Summit on Pedestrian Safety: Virtual Series. We were all surrounded by hundreds of others who are passionate about reducing pedestrian fatalities and serious injuries. The virtual format of this meeting allowed us to reach a wide and diverse audience. On average, about 600 people joined each webinar to hear our presenters share their thoughts, their noteworthy practices, and their energy. Participants represented an impressive variety of organizations, including pedestrian safety advocacy groups, State and local departments of transportation (DOT), professional organizations, and academic leaders. I encourage you to read more about the summit on page 2, and to visit the summit website where you can view the presentation materials from the summit sessions at https://highways.dot.gov/pedestrian-safety-summit/materials.
Some of the presentations at the summit focused on the Safe System approach, which is based on the idea that no one should die or be severely injured on our roadways. Safe System recognizes the vulnerability and fallibility of humans, and builds layers of protection around these road users in order to protect them. You can read more about the Safe System approach in two great articles in this issue of the Safety Compass newsletter: "Safe System—An Approach Toward Zero Traffic Deaths" and "Effectively Engaging Stakeholders in a Safe System Approach to Transform Traffic Safety." We all play a role in effectively implementing this approach to reach our shared goal of zero deaths on our roadways.
As we alliteratively continue caring and collaborating about possible pedestrian proven safety countermeasures, we can all work to ensure that pedestrians return safely to their families tonight. Please take time to learn more about the Safe System approach and how we can all make a difference. We are all in this together.
By: Abdul Zineddin, FHWA Office of Safety
Pedestrian fatalities have risen in recent years, both in number and in the percentage of all highway fatalities. From 2009 to 2018, pedestrian fatalities in crashes increased 53 percent, and the fraction of pedestrians killed in fatal crashes increased 42 percent. While 6,283 pedestrians were killed in 2018, the National Highway Traffic Safety Administration's (NHTSA) early estimates for 2019 highway fatalities indicate that pedestrian fatalities have decreased by 2 percent. This is good news, and we will be working tirelessly to continue this downward trend.
To address this public health issue, offices from the Federal Highway Administration (FHWA), NHTSA, and the Office of the Secretary of Transportation (OST) came together to successfully plan and launch the USDOT Summit on Pedestrian Safety Virtual Series.
The purpose of the virtual summit was to discuss issues around pedestrian safety and the initiatives and actions that can improve the safety of pedestrians. The webinars included remarks from Secretary of Transportation Elaine L. Chao, FHWA Administrator Nicole R. Nason, NHTSA Deputy Administrator James C. Owens, and leaders from transportation safety organizations.
The first webinar was held July 8, and focused on USDOT's current and planned actions to enhance pedestrian safety. It also included a discussion on the Safe System approach, which takes road users' actions into account and incorporates features that minimize the chances of fatal crashes and serious injuries. The second webinar was held on July 15, and materials are available at https://highways.dot.gov/pedestrian-safety-summit/materials. The third and final webinar in the series took place on July 28, and focused on next steps. To view the materials presented during each webinar, please visit https://highways.dot.gov/pedestrian-safety-summit/materials.
In preparation for these webinars, a draft list of current and planned USDOT actions to enhance pedestrian safety was developed and shared with participants in advance of the webinars. The list identified what OST, FHWA, NHTSA, and other USDOT modes intend to accomplish in the next 2 years. The actions focus on:
This list of actions is a draft which allowed FHWA and NHTSA to solicit input via the webinars to determine what additional actions can be taken to improve pedestrian safety across the United States. Feedback from participants was solicited through interactive polling questions, public chat pods, the website, and email. To view the draft list of actions, which will serve as input into the USDOT Pedestrian Safety Action Plan, please visit our website at https://highways.dot.gov/pedestrian-safety-summit.
For more information, contact Abdul Zineddin at abdul.zineddin@dot.gov.
By: Mark Doctor, FHWA Resource Center; Chimai Ngo, Norah Ocel, Karen Scurry, and Jeff Shaw, FHWA Office of Safety
Traffic fatalities in the United States have remained fairly constant since 2015. To reach our goal of zero traffic deaths, we need to change the way we think about traffic safety.
We need to adopt a Safe System approach.
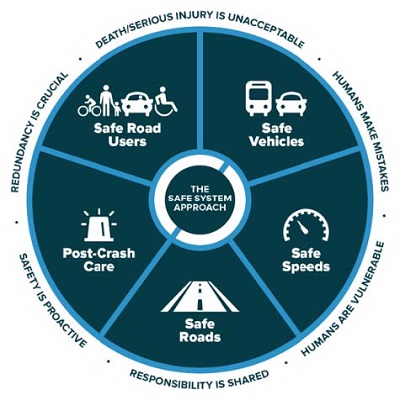
The Safe System approach was founded on the principle that no one should be killed or injured when using the road system. While no roadway crash is desirable, the Safe System approach focuses on crashes that result in deaths and serious injuries.
The approach is gaining momentum through parallel initiatives around the country, including Vision Zero, Toward Zero Deaths, and Road to Zero. Although comprised of different stakeholders, all three efforts share the vision of eliminating fatalities and serious injuries on the Nation's roads, and they are beginning to implement the Safe System approach in different contexts. With Vision Zero, local communities are applying the Safe System approach with a focus on speeds, especially for vulnerable road users. States have adopted zero-deaths goals in their Strategic Highway Safety Plans (SHSP), using the Safe System framework from the report, Toward Zero Deaths: A National Strategy on Highway Safety. Under the leadership of the National Safety Council, the Road to Zero Coalition adopted three strategies; among them is "prioritize safety," which addresses the Safe System approach and safety culture.
At the core of the Safe System approach is acknowledgement that road users will inevitably make mistakes, and those mistakes can lead to crashes. Foundational to the Safe System approach is the expectation that the roadway system is planned, designed, and operated to be forgiving of inevitable human errors so that injury outcomes are unlikely to occur. This requires understanding that the human body has limits on its ability to withstand crash impacts before deaths and serious injuries occur.
Applying the Safe System approach involves anticipating human mistakes by designing and managing the road infrastructure to keep the risk of mistakes low, and to ensure that when mistakes lead to a crash, the impact energy on the human body stays at tolerable levels. There are six principles of the Safe System approach:
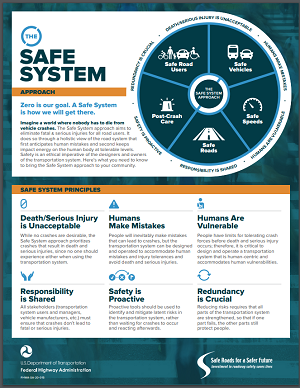
A commitment to zero traffic deaths also means addressing all aspects of safety through the following five elements that, together, create a holistic approach with layers of protection for road users:
We all have a role in implementing the Safe System approach to save lives and reach our shared goal of zero deaths. Consider applying a Safe System lens to upcoming projects and plans in your community. Put safety at the forefront and design to accommodate human mistakes and injury tolerances.
FHWA has several efforts underway to help you on your Safe System journey, including:
For more information, please contact Chimai Ngo at chimai.ngo@dot.gov.
By: Danielle Betkey, FHWA Office of Safety
The Safety Performance Management Final Rule, which was published on March 15, 2016, with an effective date of April 14, 2016, requires States to set safety performance targets in the HSIP annual report. The performance measures are based on 5-year averages and include: number of fatalities, rate of fatalities per 100 million vehicle miles traveled (VMT), number of serious injuries, rate of serious injuries per 100 million VMT, and number of non-motorized fatalities and serious injuries.
Performance management is an important element of roadway safety and is measured by the number of lives lost and serious injuries sustained on our Nation's roadways. Safety performance targets are interim performance levels that track progress toward the long-term goal of zero fatalities. Additionally, safety performance targets help improve data, foster transparency and accountability, and allow progress to be tracked at national and State levels. The safety performance management framework assists States in improving road safety through the HSIP, which requires a data-driven, strategic approach with a focus on performance.
This was a milestone year for safety performance management, as it represents the first full cycle of States setting safety performance targets and FHWA assessing them to determine if States met the targets or made significant progress toward meeting targets. The 2018 safety performance target assessment determined that 27 States (52 percent) met their targets or made significant progress toward meeting them, and 25 States (48 percent) did not meet their targets or make significant progress toward meeting them. It is important to note that each State uses its own State-specific methodology when setting safety performance targets. Some States may have set aggressive targets and did not meet those targets, while other States may have set more attainable targets and met those targets. For this reason, it is difficult to draw any conclusions about a State's safety program based solely on the safety performance target assessment, as it does not fully depict each State's unique approach.
A State is determined to have met its targets or made significant progress toward meeting its targets when at least four out of the five safety performance targets are met, or the outcome for a performance measure is better than the baseline, which is defined as the 5-year rolling average data for the year prior to the establishment of the State's target.
FHWA has launched a new web page that provides a glimpse into each State's safety performance targets. The webpage displays historical data alongside safety performance targets, as well as information on how States set their safety performance targets. For additional information about each State's HSIP, the complete reports are available online.
FHWA shares the vision that zero fatalities on our Nation's roadways is the only acceptable goal. FHWA also recognizes that reaching zero fatalities will require time and significant effort by everyone. The State's annual safety performance targets represent an important step in helping States work toward the ultimate goal of eliminating traffic deaths and serious injuries on our Nation's roadways.
For more information or questions, please contact Danielle Betkey at danielle.betkey@dot.gov.
By: Guan Xu, P.E., FHWA Office of Safety, and Jennifer Symoun, Toxcel
In response to a citizen complaint, a local traffic authority requested that the State DOT conduct an engineering study and consider lowering the existing 45-mile-per-hour (mph) speed limit to 40 mph on a U.S. route within a town. The State DOT completed a field review of the section of the route in question to gather information on roadside development, bicycle and pedestrian usage, curve measurements, and other geometric factors. It also reviewed nearby historical speeds, along with the latest available 3-year crash experience to determine the recommended speed limit. The results of the field study did not support changing the speed limit. To obtain an additional data point, the State DOT entered the relevant data into the FHWA web-based USLIMITS2 speed-limit-setting tool. The results of USLIMITS2 supported the field study findings that there was no need to change the speed limit.
Traffic engineers must often communicate with community leaders, government officials, and the public to explain the methodology behind setting, maintaining, or changing speed limits. USLIMITS2 is FHWA's free, web-based expert system tool that provides an objective second opinion and helps inform these speed limit decisions. Determining an appropriate speed limit is a complicated process that needs engineering judgement, as it takes into account combined conditions of roadway geometrics, traffic safety and operations, roadway users, and the environment. USLIMITS2 is a decision rule-based expert system, providing more consideration to and weighting of roadway factors by mimicking an expert's thought and decision-making process.
USLIMITS2 was developed in 2008 through the National Cooperative Highway Research Program (NCHRP) Project 3–67, Expert System for Recommending Speed Limits in Speed Zones. Since then, it has been used by State and local agencies to augment the credibility of engineering speed studies, helping to address concerns from local government and private citizens when speed limits are unchanged or adjusted, depending on the situation.
USLIMITS2 was selected in 2018 as one of FHWA's 20 Proven Safety Countermeasures, which are infrastructure-oriented safety treatments and strategies chosen based on proven effectiveness and benefits. As a result, USLIMITS2 has been promoted by FHWA to encourage widespread implementation by State, Tribal, and local transportation agencies to reduce serious injuries and fatalities on America's highways.
To date, agencies from 29 States and Washington, DC, have used USLIMITS2. State DOTs in Alabama, Florida, Texas, and North Carolina have recommended use of USLIMITS2 in their speed setting manuals, SHSPs, pedestrian/bicyclist safety action plans, and other safety documents.
USLIMITS2 User Feedback:
Since taking ownership of USLIMITS2 in 2012, FHWA has focused on ensuring that USLIMITS2 remains credible and useful. This includes making updates based on user feedback from workshops, webinars, and technical support emails. Enhancements include:
An update to the tool is currently in progress to include a detailed description of how the speed limit is determined in the final recommendation report, which is produced after inputting information into USLIMITS2. This update is to address a particular user-raised issue: a so-called "black hole" on how recommended speed limits are generated by USLIMITS2, and helps users better understand and present the recommended speed limits from USLIMITS2.
In addition, the recently awarded NCHRP 03–139, Next Generation of the USLIMITS2 Speed Limit Setting Expert System, will focus on updating the speed limit recommendation decision rules to take into account the latest speed limit research and practices.
In March 2020, FHWA implemented a USLIMITS2 user group with the purpose of giving current and potential users a forum to discuss how they have used USLIMITS2, their issues and concerns, and their suggestions for updates. Future plans for the user group include quarterly webinars to discuss USLIMITS2 case studies and best practices, and creation of a steering committee to help identify questions for the group and respond to questions from members, as well as encourage participation in the user group.
To join the user group, send a blank email to USLIMITS2-subscribe-request@listserv.gsa.gov. If you are a regular user of USLIMITS2 and would like to serve on the steering committee, please email your interest to help@uslimits.org. FHWA offers free technical assistance to State and local agencies interested in learning more about using USLIMITS2. This includes answering questions, providing in-person and virtual workshops, and giving presentations about USLIMITS2. To request technical assistance or help with USLIMITS2 please email help@uslimits.org.
By: Nicole Waldheim, Transportation Safety Planning Lead, Burgess & Niple, and Chimai Ngo, FHWA Office of Safety
Transportation agencies have several tools available to them to reverse the negative impacts of transportation-related fatalities and serious injuries. One of the best ways to get ahead of future crashes is to have a plan in place.
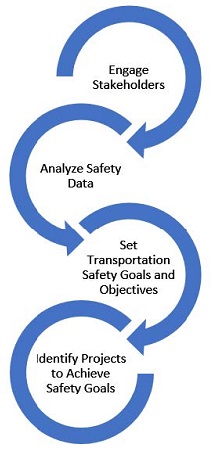
Long- or short-range transportation plans with a safety focus or a safety plan provide opportunities to: 1) engage multiple stakeholders, 2) analyze crash and other data to understand challenges and opportunities, 3) establish key priorities based on the results of stakeholder engagement and analysis, and 4) identify program and project responses that align with those safety priorities.
Successful planning processes follow this data-driven framework and set up agencies to better prioritize safety projects or incorporate safety into all transportation projects. Implementing this approach provides an opportunity to achieve safety performance goals.
One resource available to transportation planners to learn more about establishing a safety planning framework is a workshop offered by FHWA's Offices of Safety and Planning. The 1-day workshops began in 2015 and guided planners at State DOTs, metropolitan planning organizations (MPO), and local jurisdictions through establishing their own decision-making frameworks and identifying challenges and improvements that addressed safety. The content focuses on:
To date, the workshops have been hosted by 10 States and are based on research developed for NCHRP, Institutionalizing Safety in Transportation Planning Processes: Techniques, Tactics, and Strategies. Highlights from workshops held in Alabama, Alaska, California, Idaho, South Carolina, and Virginia can be found on the FHWA Transportation Safety Planning web page. Individual State reports also describe successful tactics agencies are using to incorporate safety into their planning decisions and opportunities to make improvements.
In 2020, additional workshops were hosted in Tennessee and Indiana with plans for two additional workshops in Missouri and Illinois. In Tennessee and Indiana, participants identified the actions outlined below to advance transportation safety planning.
Tennessee
Public and stakeholder engagement – Develop unique safety messaging ideas and use infographics to better communicate the "safety story."
Crash data and analysis – Analyze crash data and move toward a unified data warehouse with automated data analysis so all transportation agencies are using the same data (i.e., from the same source and processed the same way). Provide statewide training or additional information on systemic analysis and how to conduct similar analyses at the regional or local level.
Safety performance – Initiate early planning-level discussions between MPOs and the Tennessee Department of Transportation districts to ensure safety analyses are initiated and results are utilized in project selection, and to facilitate collaboration and increased transparency in the prioritization process.
Indiana
Public and stakeholder engagement – Better utilize public meetings, web pages, social media, newsletters, or demonstration projects to collect and share information about safety. Discuss transportation safety topics more frequently with policy, technical, and other modal/special committees.
Crash data and analysis – Update and share the Crash Location Improvement Program tool to help transportation agencies better locate crashes for all roads. Focus on using crash data results to identify and prioritize regional and local safety emphasis areas, educate stakeholders and the public on safety needs, and select safety projects. Apply successful examples of local road safety plans (LRSP) and the systemic analysis process used in the State to other local jurisdictions in Indiana.
To learn more about the workshops or to request a workshop for your State, contact Chimai Ngo at chimai.ngo@dot.gov.
By: Adam Larsen, FHWA Office of Tribal Transportation
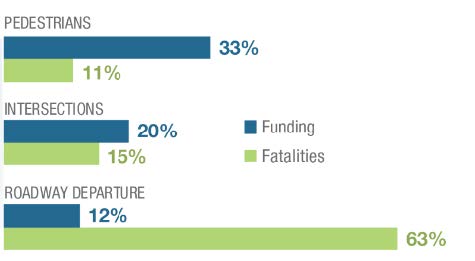
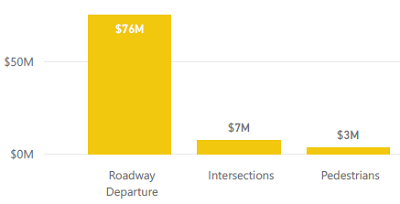
Since 2013, the Tribal Transportation Program Safety Fund (TTPSF) has distributed $61 million that has enabled Tribal governments to deploy 648 projects to improve transportation safety through safety planning, data improvement and analysis, education, enforcement, emergency medical services (EMS), and infrastructure. The 130 infrastructure improvement projects have included pedestrian facilities, intersection enhancements, systemic roadway departure countermeasures, traffic calming, ice road monitoring, and much more. However, despite the significant role of roadway departure in fatal crashes in Tribal areas, only 12 percent of the available TTPSF funding (2013–2019) has been for projects addressing roadway departure, as shown in the bar graph below.
FHWA is partnering with Tribes to increase the number of applications and awards for roadway departure countermeasures. Efforts underway to make this change include educational outreach and establishing a new funding category in the TTPSF to promote the systemic deployment of roadway departure countermeasures.
The TTPSF application process does not currently favor risk-based project proposals. The primary selection criteria for infrastructure projects focus on supporting crash data and inclusion in a transportation safety plan. In addition, the application process requires writing a narrative statement, which some applicants may view as too cumbersome to request low-cost safety improvements. The result is funding distributed to address locations that have at least one crash that would support a higher-cost treatment. This arrangement decreases the likelihood that a Tribe would pursue risk-based systemic improvements.
Roadway departure was involved in 63 percent of reported motor vehicle fatalities in Tribal areas from 2010 to 2014. That is more than one death each day from a roadway departure crash in a Tribal area.
With support from the Tribal Transportation Program Coordinating Committee, FHWA developed a new funding category for systemic deployment of roadway departure countermeasures, which will be deployed beginning in the fiscal year 2021 funding cycle. Tribes will provide risk data for horizontal curves and tangent sections of roadway before selecting from a menu of eligible low-cost countermeasures. Funding will be provided to those locations that demonstrate the highest risk. A draft version of the systemic roadway departure countermeasure deployment form is available at https://www.tribalsafety.org/Run-Off-the-Road. Eligible improvements for this funding category include:
In addition, FHWA will deploy educational materials for Tribal DOTs to improve understanding of the strategies available to address roadway departure. This also helps inform Tribal DOT staff who interact with leadership and the public about the importance of roadway departure projects.
Three webinars were held in June and July, 2020, to provide an overview of the countermeasures that FHWA promotes, with a focus on the reducing rural roadway departures (FoRRRwD) initiative. This webinar series reviews roadway departure crash statistics for Tribal areas; explains why a systemic approach is critical to addressing roadway departure in rural areas; and identifies available infrastructure improvements to keep vehicles on the road, reduce the risk of a crash if vehicles leave the road, and minimize the severity of a crash. The webinars were delivered through a partnership between the FHWA Office of Safety, FHWA Resource Center, and the FHWA Office of Tribal Transportation. Recordings of these sessions are posted at https://www.TribalSafety.org/Run-Off-the-Road.
Future webinar sessions will review sign maintenance methods and the new TTPSF systemic deployment of roadway departure countermeasures funding category. You can subscribe to the TribalSafety.org mailing list to be notified of future events and other tribal transportation safety updates. For more information, contact Adam Larsen at adam.larsen@dot.gov or (360) 619-2601.
By: Rosemarie Anderson and Karen Scurry, FHWA Office of Safety
Don't shelve your LRSP!
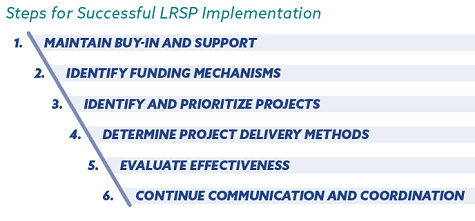
Agencies will only see the benefits of the LRSP through implementation. FHWA's Office of Safety has recently released Implementing a Local Road Safety Plan, a report that details strategies and actions for State and local agencies to take their LRSPs from development to action. The report includes examples from several State and local agencies to show how they have overcome barriers and challenges and have made a positive impact on traffic-related fatalities and serious injuries.
An LRSP, which is an FHWA proven safety countermeasure, provides a framework for identifying, analyzing, and prioritizing roadway safety improvements on local roads. Although several States and local agencies have adopted this approach to improve safety on their local roads, many are finding it difficult to go from development to implementation. This report provides the "how-to" for taking the next steps toward implementation and improving safety on local roads.
The report is useful for State or local agencies that have developed an LRSP, are currently developing an LRSP, or even those that have not yet started the development process. The report recognizes how considering implementation during the LRSP development process can lead to consensus building and leveraging of resources to move plans to actions. The report discusses differences in LRSPs, including who develops and implements the LRSP, the geographic area, and how projects are selected, to ensure the recommendations apply across the board.
The steps to successful implementation include the following:
LRSPs come in many forms and can be implemented at the city, county, Tribal, or regional level. The purpose of this report is to make sure that once developed, LRSP plans make it to the next level: implementation. A plan that gets developed cannot be effective unless it is implemented. It takes hard work, determination, and the knowledge of what works to achieve the greatest benefits.
The Implementing a Local Road Safety Plan report can be accessed online along with slides of the webinar, "Implementing a Local Road Safety Plan."
For more information, contact Rosemarie Anderson at rosemarie.anderson@dot.gov or Karen Scurry at karen.scurry@dot.gov.
By: Craig Allred, FHWA
The National Highway Institute offers the RSA workshop to train participants in applying RSAs and Road Safety Audit Reviews (RSAR) to proactively improve roadway safety. According to the website, this course includes hands-on application of the training materials, including topics such as: RSA definition and history, stages and how to conduct a RSA, and legal considerations. Learn more on the workshop website.
While attending a Resource Center Roadway Safety Audit (RSA) workshop, hosted by the FHWA's Colorado Division office, Lieutenant (Lt.) Robert Rock of the Denver Police Department identified a location of concern at the 20th Street on-ramp to Interstate 25 (I-25) in Denver, Colorado. During the workshop, Lt. Rock and attendees discussed the location and how low-cost safety improvements and coordination between a public works department and a transportation agency could solve the problem.
What was the problem? At this location, there were multiple harmful events, including a single vehicle into a barrier, two fatal crashes, four serious bodily injury crashes, at least 14-driving-under-the-influence incidents, and multiple hit-and-run crashes. The majority of these events had occurred late at night and into the early morning hours. This accumulation of circumstances created a location with more than 40 harmful events occurring between January 2013 and June 2018.
As a result of the information learned at the workshop, Lt. Rock was able to confidently address the issue. He gathered data, analyzed it, and took steps to work with Denver Public Works and the Colorado Department of Transportation to document the issue and help resolve the problem.
Lt. Rock's endeavor led to added signage and pavement markings, a repaired concrete barrier, variable message signs, driver feedback, and directed enforcement and education. These efforts culminated in the area of concern seeing significant safety benefits and going from more than 40 harmful events (which occurred between January 2013 and June 2018) to zero—and having seen no hit-and-runs since the improvements were completed. All because of the educational and collaborative space provided by the RSA workshop, and because of a Denver police officer who recognized the problem and did the work to solve it.
For more information, contact Craig Allred at (303) 434-3366 or craig.allred@dot.gov.
By: Chantez Bailey, Operation Lifesaver Inc., and Kelly Morton, FHWA Office of Safety
Operation Lifesaver Inc. (OLI) is a nonprofit public safety education and awareness organization dedicated to reducing collisions, fatalities, and injuries at highway-rail crossings and trespassing on or near railroad tracks.
What Is Operation Lifesaver?
OLI has been committed to sharing the importance of rail safety since 1972, when there were 12,000 railroad crossing incidents reported each year. The organization's public education efforts have helped reduce the number of crossing collisions by more than 80 percent, down to approximately 2,200 incidents in 2019.
However, there is still more work to be done. Commuter trains are running on the tracks moving people to their destinations. Freight railroads, large and small, are moving goods and supplies to market. It is important to remember that tracks are for trains, and both pedestrians and drivers must remain alert and use caution when walking or driving near tracks.
The unfortunate reality is that in today's busy and distracted society, a person or vehicle is hit by a train roughly every 3 hours in the United States.
OLI's programs are co-sponsored by Federal, State, and local government agencies; highway safety organizations; and America's railroads. OLI has a network of authorized volunteers in State programs across the United States who are passionate about the mission to save lives through education. Led by State coordinators, OLI's State programs are in communities every day, giving free rail safety education presentations to school groups, driver education classes, community audiences, professional drivers, law enforcement officers, and emergency responders.
OLI's national office creates robust and innovative marketing and digital campaigns to keep rail safety on everyone's radar. Among the tools used by OLI and its State programs are award-winning e-learning rail safety training programs for professional drivers, school bus drivers, and first responders. These interactive online programs were developed to prepare audiences for real-life scenarios in a virtual environment and help them make safer decisions.
Rail Safety Week Raises Awareness
In the United States and Canada, Rail Safety Week (RSW) is a major public safety initiative held the last week of September. The initiative brings together OLI State programs and rail safety partners to further promote the importance of rail safety. Events are held each day during the observance to highlight crossing safety and rail trespass prevention in high-incident areas. The goal of RSW is to raise awareness of the need for rail safety education and empower the general public to stay safe near highway-rail grade crossings and railroad rights-of-way.
First held in 2017, RSW continues to grow, with public safety events throughout North America as well as public awareness campaigns via social media. Each day during RSW 2019, a new video was launched sharing personal stories of tragic consequences to pedestrians and drivers on or near the tracks.
These campaigns underscore OLI's key safety tips:
Join Us for RSW September 21–27!
OLI is the only national nonprofit organization dedicated to saving lives by empowering the public to make safer choices near tracks and trains. We invite supporters of rail safety to get in touch with their State coordinators to find out about the great initiatives happening in their States. You can become part of the mission, too. Consider volunteering with OLI in your community and follow OLI on social media to stay current. Visit www.oli.org for information about State programs and other rail safety education resources.
For more information, contact Chantez Bailey, OLI, at cbailey@oli.org or Kelly Morton, FHWA Office of Safety, at kelly.morton@dot.gov.
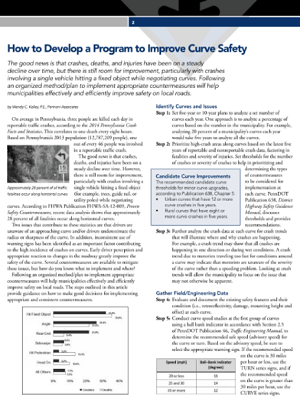
By: Patrick Wright, PA LTAP

Pennsylvania Context
Like many other States, Pennsylvania has a diversity of government agencies, topography, and road ownership that makes systemic safety improvements for horizontal alignment (turns/curves) a challenge. According to the Pennsylvania Department of Transportation (PennDOT), there are more than 120,000 miles of roads in Pennsylvania with nearly 80,000 miles owned/maintained by local governments. These local governments include more than 2,500 separate entities, from major cities like Philadelphia and Pittsburgh, to small boroughs like Laurel Mountain (with a population of 100 people and 1.5 miles of roads), to rural townships with mainly State/national forests.
Most of these municipalities do not have engineers to do the studies required for curves, and some may not even be aware of the requirements in State regulations and the Manual on Uniform Traffic Control Devices (MUTCD). The 2009 edition of the MUTCD updated the horizontal alignment requirements for applying horizontal signing to roads, and the challenge to the Pennsylvania Local Technical Assistance Program (LTAP) was how to transfer the requirements and the knowledge of curve studies to the people who needed it.
Furthermore, hit-fixed-object crashes as a result of a roadway departure are the most common crash type on local roads in Pennsylvania. Most of these crashes occur on curves. Some common curve issues in Pennsylvania include:
Plan to Achieve Compliance
To transfer the MUTCD requirements and know-how to local municipalities across Pennsylvania, the LTAP developed a three-part plan. The plan includes:
Hit-fixed-object crashes as a result of a roadway departure are the most common crash type on local roads in Pennsylvania.
Through an Accelerating Safety Activities Program grant, the FHWA Pennsylvania office purchased 3 dozen ball bank indicators, which are used to conduct curve studies, to hand out to municipalities in Pennsylvania.
LTAP Training
Since the 2009 MUTCD was adopted in Pennsylvania in 2011, the LTAP has held 191 classes on the curve sign requirements and has trained 2,989 people, including engineers, supervisors, roadmasters, and police officers. The curves class includes background information on curve safety, how to study a curve following MUTCD and PennDOT regulations, signing requirements, and examination of other curve safety features (shoulder edge drop-offs, drainage issues, fixed objects, shoulders, etc.). Hands-on training examples with pictures, videos, and local Pennsylvania examples highlight the course. As new information became available, such as the FHWA guide, Low-Cost Treatments for Horizontal Curve Safety 2016, the course was updated.
Since not everyone has the time to attend a 4-hour course, the LTAP produced a shortened, 1-hour webinar version of the course. The webinar was presented several times and is available on the website https://gis.penndot.gov/LTAP/default.aspx.
LTAP services and materials are free of charge to Pennsylvania municipalities, thanks to PennDOT and FHWA funding.
LTAP Outreach
LTAP produces a quarterly newsletter that is sent to every municipality in Pennsylvania, which includes several articles and technical bulletins on curve safety. The technical bulletins on curve safety focus on how to study a curve, sign spacing, and developing a curve safety program.
LTAP Technical Assistance
LTAP offers technical assistance to municipalities in Pennsylvania. Basic questions can be answered over the phone or via e-mail. Direct technical assistance is also offered in the field. The LTAP staff travels to the site and provides hands-on training to municipalities on curve studies, signing, and safety. While classroom training is effective, when coupled with direct hands-on training in the field, the participants learn better and are better at applying the information. Typically, there are more than 240 phone/e-mail assists and 120 field assists in a year.
Results
While the safety data fluctuates from year to year, the overall trends for local road curve safety in Pennsylvania are improving. The 5-year average of roadway departure/hit-fixed-object crashes on local Pennsylvania roads has declined by about 10 percent, and the fatal crash rate has dropped by 28 percent. Local road safety is also now a priority in Pennsylvania's SHSP. Lastly, there are many trained roadmasters and local officials who can now conduct curve studies and apply the right signs for the right situation.
For more information contact Patrick Wright, traffic engineer working for the Pennsylvania LTAP, at pwright@Pennoni.com.
By: Kari Finley, Ph.D.; Nicholas J. Ward, Ph.D.; Katherine Dively, M.S., CHES; Jay Otto, M.S., Montana State University; and Katie Fleming-Vogl, M.A., Minnesota Department of Transportation Research and Innovation
The Center for Health & Safety Culture at Montana State University engaged in a 3-year project to leverage existing traffic safety collaborative efforts to improve traffic safety culture in Park Rapids, a small rural community in Minnesota. The project was funded by the Minnesota Department of Transportation through its HSIP.
Traffic safety culture can be defined as "The shared belief system of a group of people which influences behaviors affecting traffic safety."1 A positive traffic safety culture prioritizes safety across the social environment, which includes individual road user behaviors as well as actions by traffic safety stakeholders (e.g., local, State, and Federal transportation agencies; law enforcement; public health; schools; and elected officials). This article explores insights from the project that bolstered sustained engagement in growing a community's positive traffic safety culture.
Creating a Coalition
Coalitions are an effective structure for collaboratively working to grow a positive traffic safety culture. Although there was not a specific traffic safety coalition in Park Rapids, there were stakeholders who met regularly as a health and wellness coalition. To leverage these resources and the synergy of the group, a traffic safety work group was created to grow a positive traffic safety culture. The following insights were developed over the multiyear project.
Identifying Local Leaders and Champions
Leaders are instrumental in recruiting and convening stakeholders across the social environment (also called the social ecology); communicating the coalition's goals; and maintaining the group's function, longevity, and success. Identifying local champions in traffic safety culture efforts is equally important. Champions are partners who have a passion for the work and are energized to mobilize the community for change. Some leaders are champions by nature, yet others may be fulfilling an obligation of their organization. Identifying local champions is important for coalition sustainability. Local champions often bridge gaps during shifts in leadership, losses of funding, and challenges with local engagement. Both leaders and champions are important, and it is beneficial to recognize they may be different.
Building Shared Language and Understanding
This project was a change process focused on transforming culture, so it was necessary that leadership understood the role and importance of traffic safety culture. Without this understanding, it is not possible to lead the change process or explain and encourage other partners to commit to the transformation of culture as the means of reaching the coalition's vision. Traffic safety culture must be articulated in a way that is understood by others. Building the capacity of leaders and champions is necessary to be successful.
Growing Concern and Hope
Engaging in meaningful conversations and sharing data (e.g., highlighting serious injuries and fatalities) can create shared concern. Shared concern fosters motivation for change. However, in addition to creating concern, there must also be an intentional focus on creating hope. Concern without hope can lead to frustration and disengagement. Hope entails both the recognition of a path to success and the will to follow that path.2 Hope can be generated from recognizing existing strengths, celebrating successes, and creating an appreciative generative vision.
Developing an Appreciative Generative Vision
An appreciative generative vision shifts from reducing a problem to growing a solution, and gives energy, aspiration, and space for new thinking to take place. It changes how people think about an issue so new options for discussion or action become available and compels people to want to act.3 Typical visions in traffic safety tend to highlight concern and the need to reduce something (e.g., vehicle crashes, serious injuries, deaths). A vision focused on concern can draw attention to the need for change but can lack the energy and aspiration necessary to motivate and sustain engagement to make that change. Examples leveraging an appreciative generative vision in traffic safety could include growing proactive traffic safety behaviors, engaged driving, conversations about never driving after drinking alcohol, and a commitment to safety in transportation. An appreciative generative focus allows for a community to tap into the positive aspects of its culture, which it can leverage to address challenges in traffic safety.
Creating Regular Opportunities for Interaction
To grow a positive traffic safety culture, there must be regular opportunities for stakeholder interaction. Frequent interactions reinforce commitment to the coalition and its shared goals. Time spent together allows for planning, engagement in activities, and follow-through.
Creating Systems to Engage New Stakeholders and Learn from and Embrace Change
Systems must be in place for the coalition to function effectively. A system to orient new stakeholders and a system from which to learn and embrace change are important when growing a positive traffic safety culture.
Conclusion
A coalition that prioritizes traffic safety and includes stakeholders across the social environment has the potential to be an effective change agent. This project identified coalition characteristics necessary to bolster cooperation among community stakeholders. While perhaps underutilized, coalitions may be the only way to actualize a common vision of zero traffic fatalities and serious injuries on our Nation's roads.
For more information, contact Kari Finley, Ph.D., at (307) 272-8505 or kari.finley@montana.edu.
By: Tamara Redmon, FHWA Office of Safety
FHWA's Pedestrian and Bicycle Safety Program released two resources in the past couple of years that also include free online technical assistance and training.
As mentioned in the fall 2018 edition of the Pedestrian and Bike Forum Newsletter, FHWA published the Guide for Scalable Risk Assessment Methods for Pedestrians and Bicyclists (and accompanying Areawide Exposure Tool [Microsoft® Excel download]) that outlines eight sequential steps to develop risk values and describes the scope and nature of each step, including guiding principles. Practitioners can use these scalable risk assessment methods to evaluate pedestrian and bicyclist risk at different geographic scales. These evaluations can then inform program and project funding decisions. Free technical assistance is still available through the fall, and virtual sessions are provided. The team recently completed a well-received 3-hour training with the State of Arizona with more than 90 attendees.
FHWA released its Bikeway Selection Guide a year ago. This resource helps transportation practitioners consider trade-offs and make decisions to accelerate the delivery of high-quality bicycle networks. FHWA will continue to offer free technical assistance and workshops on the guide through spring 2021. Throughout 2020, FHWA will offer this workshop virtually. Participants will review online training materials before joining an interactive, 3-hour online event to learn more about how to apply the Bikeway Selection Guide to plans and projects. The first virtual training took place on July 9.
In addition to supporting the resources mentioned above, the Office of Safety offers quarterly webinars on topics of interest. FHWA hosted a two-part webinar series with 2,109 attendees on Enhancing Mobility, Access, and Safety for Pedestrians on April 28 and April 30. Part 1 provided information on how pedestrians with visual impairments travel, and how changes in engineering have influenced their safety and mobility. Part 2 explored wayfinding for pedestrians who are blind or have low vision, and showcased various strategies for aiding navigation along streets and at crossing locations. The recorded webinars are available online.
FHWA and the Pedestrian and Bicycle Information Center (PBIC) have developed and recorded a number of webinars over the years. The PBIC archives of the webinars are available online. Here is a list of the most recent webinars:
For more information, to schedule a workshop, or for virtual assistance, please contact Tamara Redmon at tamara.redmon@dot.gov or Shawn Turner at s-turner@tti.tamu.edu.
By: Marcee Allen, FHWA Montana Division
Montana has an abundance of small towns, farms and ranches, Tribal reservations, State and national parks, and wide-open spaces. The 73,000 miles of roads in the State make up a labyrinth of asphalt ribbons crisscrossing the landscape. This network of roadways is the lifeline to Montana's economy: agriculture, farming and ranching, forestry, mining, tourism, energy production, and high-technology industries. Montana's highway system ensures our products, services, and transportation users can arrive at their destinations in a timely manner.
The Montana Department of Transportation (MDT), in partnership with the FHWA and local, Tribal, and other Federal agencies, is responsible for the health of this vast network of roads. MDT's work is a continuous cycle of planning, programming, and delivering construction projects to ensure the roadway infrastructure meets acceptable operational and safety levels for the traveling public. Montana has a vision that no person should ever be injured or killed on our public roadways. Yet, in 2018 there were 182 fatalities and 770 serious injuries resulting from crashes on Montana's roadways. Montana's Comprehensive Highway Safety Plan is the strategic document for the development and implementation of highway transportation safety improvements. It also guides safety partners and community safety through strategies aimed at reducing fatalities and serious-injury crashes. Other Montana stakeholders, such as OLI and AARP®, who are interested in improving roadway safety and reducing deaths and serious injuries, provide education and public outreach in collaboration with the NHTSA program, managed by MDT.
If you think about it, all Montana transportation users are stakeholders with a role in safety. We each have a responsibility to buckle up every time, drive sober, obey traffic laws and speed limits, avoid distractions while driving, and make sure we are well rested before getting behind the wheel. These actions, alone, can prevent crashes from occurring, or at least mitigate the severity of a crash if it occurs. However, traveling in the rural environment presents different safety challenges. Long stretches of unchanging scenery, high travel speeds, the possibility of severe weather conditions, domestic and wild animals, oversize loads, and farm equipment on roadways are some of the variables encountered while driving, which can increase crash risk.
Approximately 58 percent of all fatalities and serious injuries in Montana result from roadway departure crashes. A roadway departure is defined as leaving the travel lane, either off the roadway or across the centerline. Common causes of roadway departure crashes are speeding; loss of control on a curve; overcorrection after an avoidance maneuver; or loss of control due to impairment, distraction, or inattentive driving.
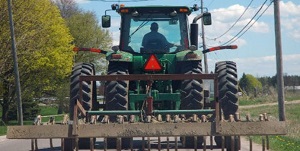
Moving farm equipment over the road, or herding cattle on the road to other fields and pastures, is a common occurrence. It can be a scary and dangerous proposition for the unsuspecting traveler, and for the farm or ranch hand on the road. Farm equipment is most often heavy and slow, making it difficult to warn the much-faster traveling public. Here are some safety tips to consider when planning field equipment and pasture movements:
Montana farmers and ranchers are important aspects of the economic vitality and social fabric of our great State and country. We want you to arrive home safely to family and friends at the end of a hard day of work. If you would like to learn more about Montana's highway safety program, please visit MDT's Vision Zero website: https://www.mdt.mt.gov/visionzero/.
For more information, contact Marcee Allen at (406) 441-3909 or marcee.allen@dot.gov. First printed in the Montana Farm Bureau Federation Spokesman magazine.
By: Grace Diaz-Estrada, Juan C. Rivera Ortiz, and Andres Alvarez, FHWA PR-USVI Division
Data are one of the most valuable resources for transportation professionals. Without data, transportation safety professionals could not calculate measures or targets. Without data-driven measures, strategic plans could not be developed, locations could not be selected for the HSIP, police enforcement plans could not be developed, and locations for EMS stations to improve response time during golden hour would be a mystery. Data make it possible for safety professionals to keep the zero-deaths vision in the highway safety system our top priority.
Crash data analysis is essential for cultivating safe transportation systems. Data dashboards support development of strategies and efforts to reduce fatal crashes and serious injuries. A data dashboard is an information management tool that visually tracks, analyzes, and displays metrics and key data to monitor a specific process. It is customizable to meet the specific needs of a division or agency. With a simple spreadsheet, a dashboard application can develop beautiful and efficient visualizations with tables, line charts, bar charts, and gauges. Today, a data dashboard provides a central location for agencies to monitor the progress and performance of specific programs.
FHWA's Puerto Rico and U.S. Virgin Islands (PR-USVI) Division is helping State DOTs evaluate highway safety programs and investments using data dashboards. Thanks to a virtual presentation from our peers at the FHWA Florida Division, we established a roadmap to start and maximize the use of dashboards in the division. With the crash data set provided by Puerto Rico DOT and USVI Department of Public Works, we produced several dashboards that help in the evaluation of crashes by location, contributing factors, safety funding per year, before-and-after study results, and performance measures.
Puerto Rico Dashboards
Since 2014, the Puerto Rico DOT has been effective in its Highway Safety Program thanks to the development of an SHSP, implementation of the HSIP, and the evaluation of high-crash locations. A best practice implemented in Puerto Rico to achieve a successful Highway Safety Program has been sharing crash data that could be analyzed from different perspectives.
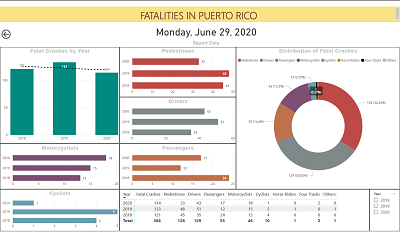
Every day, we received a comparison of fatal crashes for the current year and the previous 2 years from the Puerto Rico Traffic Safety Commission. With this information, a dashboard was developed and a digital copy provided monthly to all FHWA division staff (see below). The area engineers evaluate the information and look for technical assistance on those safety areas considered focus areas according to the number of fatal crashes. Information from pedestrians, drivers, motorcyclists, passengers, and cyclists is included in the analysis. Several T2 projects and Call for Services requests have been granted using the data evaluation performed with fatal crashes.
The Puerto Rico DOT provided a copy of its crash data set for the years 2014–2018. A new series of the dashboard was developed looking at crashes per municipality, road, and emphasis area of the SHSP. Also, a comparison of information provided in the HSIP reports for the last 3 years was performed (see chart on the previous page). The results will help us identify locations or patterns for the development of highway safety projects with Federal funding.
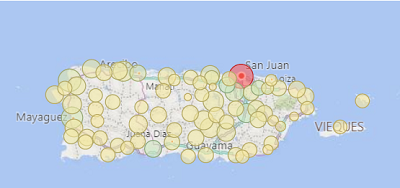
The information by municipality and road could be valuable for law enforcement and EMS action plans on the Island. The police department could determine the enforcement strategies by looking at maps; tables; and graphs per year, season, and related event. The EMS agency could relocate rapid response stations near the locations with more incidents. This illustration above shows the intensity of crashes at every municipality. The San Juan Metropolitan Area (red bubble) and several municipalities on the coast around the Island (green bubbles) could be analyzed by safety stakeholders as part of their Highway Safety Programs.
Looking for a better comparison of municipalities based on VMT, we found a limitation of available data, especially current annual average daily traffic for the highway system. Our analysis incorporated data normalization of crashes per population (2010 U.S. Census) and crashes per kilometer of roads (Puerto Rico DOT ArcGIS™ maps). This new approach in data analysis helped us identify municipalities with high frequency and severity of crashes, which would be considered good candidates for the strategies included in the SHSP. We created a heat map to show municipalities that do not have a considerable number of crashes but are in the top 10 when the data are normalized by population and kilometer of roads (e.g., Rincón and Fajardo).
USVI Dashboards

As with Puerto Rico, we requested crash data information from the USVI Department of Public Works, and it provided us a crash data set for years 2015–2019. With the information, we developed a dashboard that will help USVI to improve its highway safety strategies in the following emphasis areas: intersections, roadway departure, vulnerable users (pedestrians and bicyclists), and work zones (see dashboard below). The map illustration in the dashboard shows the crashes by city in Saint Thomas and Saint John.
Next Steps
FHWA PR-USVI Divisions will continue with development of dashboards to maximize the results of data analysis. This new way of data visualization will help us evaluate our programs. We are also looking to develop dashboards in other essential areas, such as finance, emergency response program, transportation planning management, planning, and construction.
For more information, contact Juan C. Rivera Ortiz at juan.riveraortiz@dot.gov.
By: Chimai Ngo, FHWA Office of Safety
FHWA is developing a series of success stories highlighting notable practices Vision Zero communities and transportation agencies have implemented to reach their zero-deaths goals.
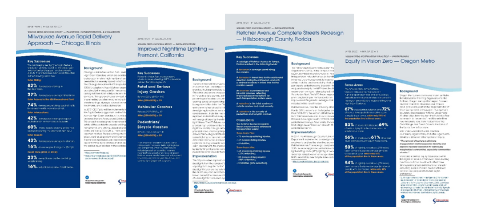
Learn about how Vision Zero communities deployed a new approach, enhanced lighting, redesigned their streets, and fostered partnerships to save lives from the first four success stories below:
For further information on zero deaths, visit https://safety.fhwa.dot.gov/zerodeaths/.
For more information, please contact Chimai Ngo at chimai.ngo@dot.gov.
By: Jeffrey B. Shaw, P.E., FHWA Office of Safety
FHWA's Intersection Safety Program is pleased to announce several new outreach and education products to assist our State, local, and Tribal partners in advancing intersection safety efforts in their communities. These products were identified based on feedback from stakeholders in our Intersection Focus States.
Public Service Announcements (PSA)
Two new PSAs are 30-second audio clips intended for over-the-air or streaming broadcast. They are designed to inform the public about the safety benefits of roundabouts and restricted crossing U-turn (RCUT) intersections, in hopes that when proposed in a community, members of the public will recall that these intersection types are safer. The roundabouts PSA uses a twist on the familiar "The Wheels on the Bus" sing-along, and the RCUT PSA drives home the "RCUTs are cutting" theme of reducing crashes and delay.
Informational Videos
Three new videos have been produced to help advance efforts to implement intersection solutions that also reflect the Safe System approach. For intersections, this approach involves separating users in space, separating users in time, modifying conflict angles, and reducing speed through conflict areas—all to manage the kinetic energy involved in a potential collision. Each video is 3–5 minutes, and is intended to help State, local, and Tribal agencies explain these intersections to their communities.
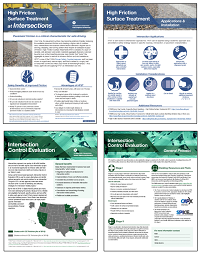
Informational One Pagers
This suite of one-pagers will undoubtedly become the hot handout at your next conference booth, training, or public meeting! According to our Intersection Focus State stakeholders, a "print-on-demand" product that can be handed out to internal and external audiences is expected to help advance intersection safety efforts in their jurisdictions.
For more information, contact Jeff Shaw at Jeffrey.shaw@dot.gov.
By: Rebecca Crowe, FHWA Office of Safety
The FHWA Guide for Improving Pedestrian Safety at Uncontrolled Crossing Locations has been applied to countless roadways, discussed in dozens of workshops, and referenced in several agency guidance documents since its release in 2018. The guide follows six steps to help the practitioner understand problems and identify potential countermeasures for improving pedestrian safety at unsignalized crossings. STEP Studio now brings the guide to life by allowing the user to click through the steps, digging deeper into supporting research, implementation case studies, and other FHWA guidance.
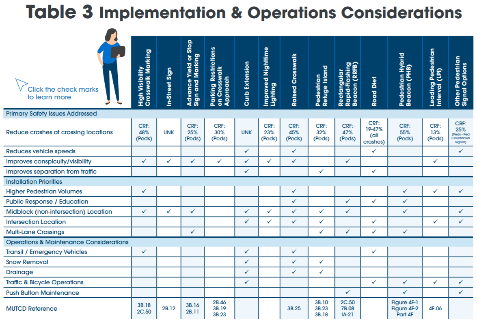
STEP Studio, published in July 2020, links users to the dozens of key educational resources produced by the FHWA Safe Transportation for Every Pedestrian (STEP) program, such as countermeasure videos and tech sheets. STEP Studio also introduces new information, such as a matrix cross-referencing common design considerations with the "spectacular seven" countermeasures. This new "Table 3 Implementation & Operations Considerations" is a companion to tables found in the FHWA guide that associate roadway conditions and common safety problems with countermeasure options.
STEP Studio helps the practitioner to learn the basics of improving pedestrian safety at crossings, but it also offers insights into technical questions and research for the more experienced professional. For instance, it links to research reports that more thoroughly explain systemic analysis for pedestrian safety and FHWA guidance on overhead lighting. The tool is visually appealing and includes easy-to-use navigation options throughout. STEP Studio includes simple guidance for marking new crosswalks, including visual aids for describing considerations such as pedestrian travel time and stopping sight distances.
STEP Studio lists and answers frequently asked questions for each of the countermeasures, such as "When would a Rectangular Rapid Flashing Beacon (RRFB) generally be preferable to a PHB at a designated pedestrian crossing?" The resource also links to local and State agency guidance on topics such as crosswalk spacing, designing pedestrian refuge islands, and before-and-after evaluation studies.
The STEP program has produced more than 30 case studies, videos, and tech sheets on the countermeasures explained and promoted in STEP Studio. If you would like to learn how your agency can improve pedestrian safety with STEP, contact Becky Crowe at Rebecca.crowe@dot.gov with FHWA's Office of Safety, or Peter Eun at peter.eun@dot.gov with the FHWA Resource Center.
The 100th annual meeting of the Transportation Research Board (TRB) will be a virtual event! Following the schedule outlined below in the month of January 2021, through an interactive virtual platform, the annual event will feature presentations and poster sessions, workshops, exhibits, and committee meetings along with opportunities to connect with other attendees!
Committee meetings. January 5–8 and January 11–15, between 10 a.m. and 5 p.m., eastern standard time.
Sessions (of various types): January 21–22, between 10 a.m. and 4 p.m., eastern standard time, and January 25–29, between 10 a.m. and 5:30 p.m., eastern standard time.
Exhibits: January 25–29, between 10 a.m. and 5:30 p.m., eastern standard time.
Networking events: January 25–28, between 5:30 a.m. and 7 p.m., eastern standard time.
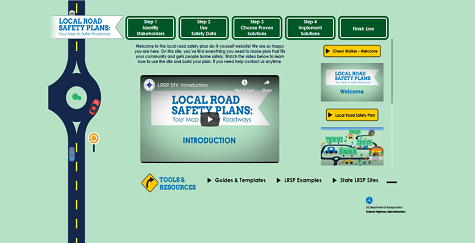
Approximately 40 percent of the Nation's fatalities occur on the local roadways, an average of 12,000 deaths each year. Local Road Safety Plans are an FHWA Proven Safety Countermeasure that local agencies can use to effectively identify and address at-risk locations and deploy safety solutions.
It would be impossible to give in-person, hands-on training to each and every one of those local agencies, so FHWA is developing a new delivery method: the LRSP Do-It-Yourself website!
The purpose of the website is to provide resources and assistance to local agencies virtually, so that they can develop LRSPs on their own.
The new website will be launching soon. Please contact Hillary Isebrands at hillary.isebrands@dot.gov or Jerry Roche at jerry.roche@dot.gov for more information.

The USDOT recently developed an applicant toolkit as part of the Rural Opportunities to Use Transportation for Economic Success (ROUTES) initiative. This initiative aims to address rural transportation infrastructure disparities. The ROUTES applicant toolkit helps rural communities better identify and navigate USDOT discretionary grant funding opportunities. The toolkit provides user-friendly information to build understanding of various discretionary grant programs and application processes, including a matrix of funding opportunities, key applicant activities during the funding life cycle, featured rural transportation projects, and other resources to maximize award success.
For more information, please contact Robert Hyman at Robert.hyman@dot.gov.
is a publication of the U.S. Department of Transportation, Federal Highway Administration.
The Federal Highway Administration publishes the Safety Compass newsletter three times a year. We can be reached at:
FHWA Office of Safety
1200 New Jersey Ave. SE
Room E71-320
Washington, DC 20590
The Safety Compass is available online at the FHWA Office of Safety web site at: https://safety.fhwa.dot.gov/newsletter/safetycompass/.
We welcome your comments and highway safety-related articles. The purpose of this newsletter is to increase highway safety awareness and information and to provide resources to help save lives.
We encourage readers to submit highway safety articles that might be of value to the highway safety community. Send your comments, questions and articles for review electronically to Tara McLoughlin at: tara.mcloughlin@dot.gov
1 Nicholas J. Ward, Jay Otto, and Kari Finley, "Ten Principles of Traffic Safety Culture," chap 7 in Traffic Safety Culture: Definition, Foundation and Application, eds. Nicholas J. Ward, Barry Watson, and Katie Fleming-Vogl (2019a), 1–345. [ Return to note 1. ]
2 Fred Luthans, and Bruce J. Avolio, Psychological Capital: Developing the Human Competitive Edge (Oxford: Oxford University Press, 2007). [ Return to note 2. ]
3 Gervase R. Bushe, "Generative Process, Generative Outcome: The Transformational Potential of Appreciative Inquiry," in Organizational Generativity: The Appreciative Inquiry Summit and a Scholarship of Transformation, vol 4 of Advances in Appreciative Inquiry, eds. D.L. Cooperrider, D.P. Zandee, L.N. Godwin, M. Avital, and B. Boland (Emerald Group Publishing Limited, 2013), 89–113. [ Return to note 3. ]

