U.S. Department of Transportation
Federal Highway Administration
1200 New Jersey Avenue, SE
Washington, DC 20590
202-366-4000
| < Previous | Table of Contents | Next > |
This guide describes scalable risk assessment methods for pedestrians and bicyclists, wherein risk is a measure of the probability of a crash to occur given exposure to potential crash events. This guide:
Many transportation agencies are placing more emphasis on improving pedestrian and bicyclist safety and reducing the risk of a fatality or serious injury to pedestrians and bicyclists. Practitioners need a methodical approach to assess pedestrian and bicyclist risk for the purposes of identifying high-priority areas and transportation facilities for safety improvement, evaluating specific countermeasures and locations before and after improvements are made, and tracking safety performance measures over time to gauge progress toward established goals. The motivation for this guide is to provide this methodical approach for assessing pedestrian and bicyclist risk for these and other applications.
Exposure to risk is an integral element of risk (see equation below), and as such, an integral element of risk assessment methods in this guide.
Exposure is a measure of the number of potential opportunities for a crash to occur, and is often directly related to the number of people who walk and bike. Improvements for bicyclists and pedestrians often result in more people walking and biking, which in turn can increase exposure. However, an increase in exposure may not lead to an increase in risk if crashes increase less proportionately than exposure increases (see equation above for the relationship between risk, crashes, and exposure). In fact, several studies have found that as more people walk and bike, their risk may actually decrease (i.e., the safety-in-numbers hypothesis). In the past, exposure has seldom been included in pedestrian and bicyclist safety analysis because of the practical challenges of collecting or estimating exposure data. Another motivation for this guide is to outline feasible methods to calculate or estimate exposure, such that exposure will be included more often in pedestrian and bicyclist risk assessment.
The main audience for this guide is practitioners who want to assess pedestrian and bicyclist risk. Some elements of the risk assessment methods in this guide are straightforward and should not pose significant difficulty for most practitioners, such as tabulating observed crashes from existing databases or collecting counts of pedestrians and bicyclists. Some analytic methods in this guide are more complex and may require specialized knowledge and skills, such as estimating expected crashes or estimating pedestrian and bicyclist exposure using a travel demand model. However, the process for assessing pedestrian and bicyclist risk in this guide provides flexibility, such that practitioners may select simpler methods that are consistent with their analysis capabilities and resources.
The organization of this guide is based on eight steps (Figure 1) that should be followed to develop pedestrian and bicyclist risk values at various geographic scales. These eight steps have been generalized to account for a variety of uses, geographic scales, and analytic methods. The following is a brief annotation of these steps to help illustrate what is involved in each step. The following chapters of this guide describe each step in more detail.
Determine use(s) of risk values: What is the main objective of my safety analysis? How am I going to use the risk values? What decisions do I want to make with these risk values?
Select geographic scale: What geographic scale do I need to support the use(s) of risk values determined in Step 1?
Select risk definition: How will I quantify risk at the defined geographic scale in this analysis? Will I use observed crashes or expected crashes? Or will I combine multiple other indicators to estimate risk? All three risk definitions require exposure estimates, so Steps 4 through 6 focus on exposure estimation.
Select exposure measure: What measure should I use to quantify exposure? The choice of exposure measure is typically based on scale, data availability, and analytic methods used. Iteration or concurrent selection of exposure measures and analytic methods (Step 5) may be necessary to ensure that an analytic method can provide the required data for the exposure measure.
Select analytic method to estimate exposure: What method(s) should I use to estimate exposure? The choice of analytic method is typically based on scale, data availability, staff expertise, scope of analysis, resources available, etc. In addition, the decision tree typically splits into two distinct paths based on scale: 1) facility-specific; 2) areawide.
Use analytic method to estimate selected exposure measure: How do I use the selected analytic method to estimate the exposure measure? Analytic methods for facility-specific scales are typically distinct from areawide methods for exposure estimates.
Compile other required data: Once exposure has been estimated in Step 6, what other data are needed to calculate the risk values? Based on the definition of risk selected in Step 3: A) observed crashes are compiled from existing crash databases, B) expected crashes are estimated, or C) additional risk indicators are compiled.
Calculate risk values: In this last step, the final risk values are calculated based on the risk definition selected in Step 3. The calculation uses the exposure estimates from Step 6 with the other required data compiled in Step 7.
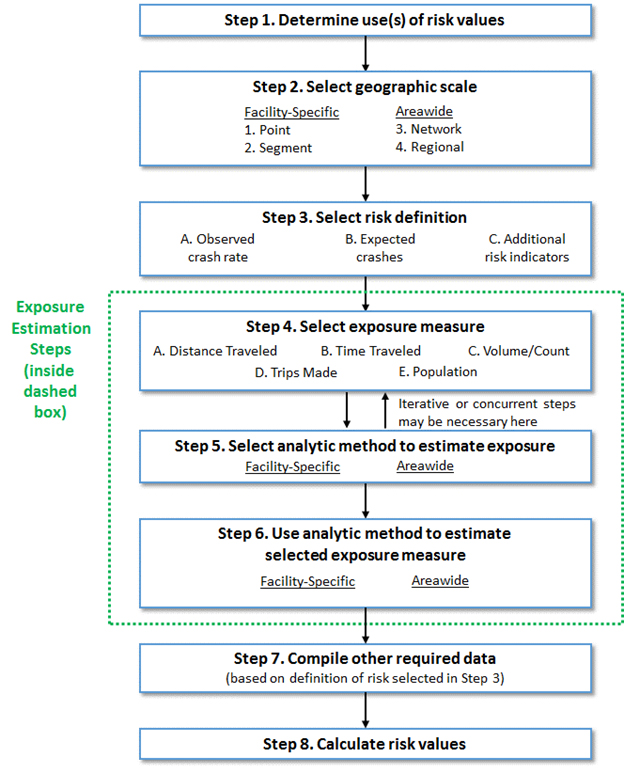
Figure 1. Eight Steps for Scalable Risk Assessment for Pedestrians and Bicyclists
| < Previous | Table of Contents | Next > |

