U.S. Department of Transportation
Federal Highway Administration
1200 New Jersey Avenue, SE
Washington, DC 20590
202-366-4000
| < Previous | Table of Contents | Next > |
This guide describes scalable risk assessment methods for pedestrians and bicyclists, wherein risk is a measure of the probability of a crash to occur given exposure to potential crash events. This guide:
Many transportation agencies are placing more emphasis on improving pedestrian and bicyclist safety and reducing the risk of a fatality or serious injury to pedestrians and bicyclists. Practitioners need a methodical approach to assess pedestrian and bicyclist risk for the purposes of identifying high-priority areas and transportation facilities for safety improvement, evaluating specific countermeasures and locations before and after improvements are made, and tracking safety performance measures over time to gauge progress toward established goals. The motivation for this guide is to provide this methodical approach for assessing pedestrian and bicyclist risk for these and other applications.
Exposure to risk is an integral element of risk, and as such, an integral element of risk assessment methods in this guide. Exposure is a measure of the number of potential opportunities for a crash to occur, and is often directly related to the number of people who walk and bike. In the past, exposure has seldom been included in pedestrian and bicyclist safety analysis because of the practical challenges of collecting or estimating exposure data. Another motivation for this guide is to outline feasible methods to calculate or estimate exposure, such that exposure will be included more often in pedestrian and bicyclist risk assessment.
The main audience for this guide is practitioners who want to assess pedestrian and bicyclist risk. Some elements of the risk assessment methods in this guide are straightforward and should not pose significant difficulty for most practitioners, such as tabulating observed crashes from existing databases or collecting counts of pedestrians and bicyclists. Some analytic methods in this guide are more complex and may require specialized knowledge and skills, such as estimating expected crashes or estimating pedestrian and bicyclist exposure using a travel demand model. However, the process for assessing pedestrian and bicyclist risk in this guide provides flexibility, such that practitioners may select simpler methods that are consistent with their analysis capabilities and resources.
The organization of this guide is based on eight steps (Figure S-1) that should be followed to develop pedestrian and bicyclist risk values at various geographic scales. These eight steps have been generalized to account for a variety of uses, geographic scales, and analytic methods. The following pages in this Summary include high-level guidance on each step. The full report provides more detailed information and guidance on each of the eight steps.
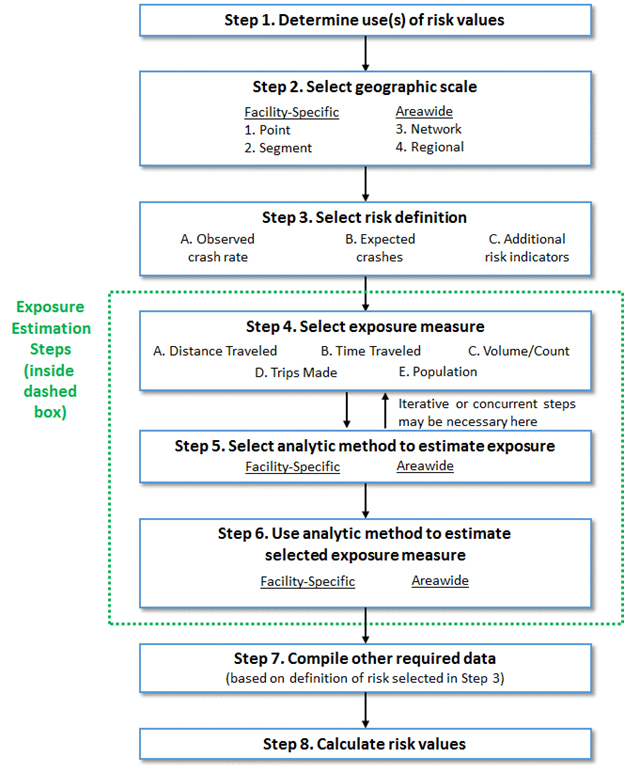
Figure S-1. Eight Steps for Scalable Risk Assessment for Pedestrians and Bicyclists
The first step in developing risk values for pedestrians and bicyclists is to define clearly the use(s) for the risk values. The use(s) of the risk values will establish key parameters (such as geographic scale) in later steps of the risk assessment process. This step is analogous to selecting the destination for a trip, such that one can pick the best route to reach the desired destination. Typical uses of pedestrian and bicyclist risk values are summarized below.
The objective in this use is to estimate risk for non-motorized modes as safety performance measures, which are then used to gauge progress toward safety improvement targets at an aggregate level (e.g., city, region, state).
The objective in this use is to estimate pedestrian and bicyclist risk (separately) to identify high-risk sub-areas for more focused analysis. This use is most common where large geographic areas are being considered (such as a metropolitan planning area or an entire state), and there is a need to focus analysis resources in those sub-areas where pedestrian and bicyclist risk is highest in relation to other sub-areas within the entire geographic area.
The objective in this use is to estimate risk for specified facilities within a given jurisdiction (e.g., city, county, etc.) to identify those facilities or facility types with the highest risk. Depending upon the mode of interest (pedestrians or bicyclists), one could consider intersections or defined street segments (or both).
The objective in this use is to estimate risk for defined improvement projects (that include specific facilities) that are being considered for funding. In this case, one uses exposure estimates to normalize crashes (i.e., account for different levels of use/activity). Also, several other ranking criteria besides safety are often considered, such as stakeholder input, constraints, opportunities, existing conditions, demand, connectivity, equity, and compliance.
The objective in this use is to evaluate the effectiveness of a specific countermeasure in reducing pedestrian and bicyclist risk. Exposure is needed for a specific facility (or facilities) both before and after the countermeasure was implemented. In many cases, the implementation of the countermeasure will have an effect on the exposure.
The goal in this use is to evaluate pedestrian and/or bicyclist risk at a specific site or at multiple sites. A site evaluation can be conducted on a one-time basis or on a before-after basis. This use differs from network screening in that a site evaluation focuses on a limited number of selected sites, whereas network screening includes all locations or sites within a defined network or area. This use differs from a countermeasure evaluation in that a site evaluation could assess the risk of multiple combined countermeasures, whereas a countermeasure evaluation typically tries to isolate the effectiveness of a single countermeasure at numerous locations.
Step 2 in the scalable risk assessment process is to select the geographic scale at which risk and exposure values are desired. The desired geographic scale is based on, and sometimes dictated by, the use(s) of the risk values as defined in Step 1. The scalable risk assessment process includes four geographic scale categories, shown in Table S-1.
The desired geographic scale for exposure estimates is an important parameter that will be used in several subsequent steps. For example, selection of exposure measures (Step 4) are informed by the desired geographic scale (i.e., certain exposure measures are better suited to detailed geographic scale, whereas other exposure measures are better suited to an areawide geographic scale). Similarly, the selection of analytic methods to estimate exposure (Step 5) are also based on the desired geographic scale.
| Scale Group | Scale Category | Description | Examples |
|---|---|---|---|
| Facility-Specific | Point | Specific location where conflicting traffic streams cross, merge, or diverge. |
|
| Segment | Length of street or roadway between two points. Traffic volumes and physical characteristics generally remain the same along the length of a segment, although small variations may occur. |
|
|
| Areawide | Network | A mid-sized geographic area that includes an interconnected set of transportation facilities. |
|
| Regional | A large geographic area that includes all transportation facilities within a defined political boundary. Because of the large geographic size, land use at this scale can be heterogeneous within a defined area. |
|
Step 3 in the scalable risk process is to select a specific definition of risk that will be used to calculate quantitative risk values. S-2 shows three possible definitions of risk, with two of the three definitions closely related (i.e., one uses observed/reported crashes, while the other uses expected crashes).
| 1. Observed Crash Rate | 2. Expected Crashes | 3. Additional Risk Indicators | |
|---|---|---|---|
| Description |
|
|
|
| Strengths |
|
|
|
| Limitations |
|
|
|
Step 4 in the scalable risk assessment process is to select a specific exposure measure to be used in the calculation of risk values. There are several different categories of exposure measures that attempt to quantify the level of contact that pedestrians and bicyclists have with potentially harmful safety outcomes. The selection of an exposure measure will depend upon several criteria, such as the use of the risk values (Step 1), the geographic scale (Step 2), and other criteria. Table S-3 contains a selection matrix to help analysts choose an exposure measure best suited for their analysis. The full report contains additional guidance on the strengths and limitations of each category of exposure measure.
| Category of Exposure Measure | Typical measures | Typical scale | Typical data sources | |||
|---|---|---|---|---|---|---|
| Point | Segment | Network | Region | |||
| Distance Traveled | Miles of travel |
|
||||
| Miles crossed per entering vehicle | ||||||
| Time Traveled | Hours of travel |
|
||||
| Product of crossing time and vehicle volume | ||||||
| Volume/ Count |
Volume/count |
|
||||
| Product of pedestrian /bicyclist volumes and motor vehicle volumes | ||||||
| Trips Made | Number of trips |
|
||||
| Population | Number of people that walk or cycle on regular basis |
|
||||
| Percent of the population that walk or cycle on regular basis | ||||||
Legend: ![]() = to a small extent;
= to a small extent; ![]() = to a moderate extent;
= to a moderate extent; ![]() = to a great extent.
= to a great extent.
Note: Each exposure measure will be for a defined time period that matches the risk definition.
Source: Partially adapted from Greene-Roesel et al., Estimating Pedestrian Accident Exposure: Protocol Report, March 2007.
Step 5 in the scalable risk assessment process is to select an analytic method (or methods) to estimate exposure. There are numerous analytic methods that can be used to estimate exposure, and the most appropriate method(s) depends upon several criteria, such as desired geographic scale (Step 2), desired exposure measures (Step 4), analysis scope, data availability, staff technical capabilities, and available analysis resources.
Note that there may be some iteration or concurrency between this step (selecting an analytic method) and the previous step (Step 4, selecting an exposure measure). For example, an analyst may want to calculate a specific exposure measure, but have no expertise in the most common analytic methods used to estimate that exposure measure. Or, a specific analytic method may not be able to estimate accurately a specific of exposure measure. For example, site counts cannot be used to estimate accurately pedestrian or bicyclist hours traveled. Therefore, many analysts are likely to consider both the desired exposure measure and the most feasible analytic method in a concurrent or iterative manner.
Table S-4 provides a selection matrix to help analysts make informed choices about which analytic method(s) is best suited for them. It is important to note that local customization may be required for all these models to be useable.
| Analytic Method | Input Data Requirements | Technical Complexity | Popularity in Practice | Direct Usability | Accuracy | |
|---|---|---|---|---|---|---|
| Site counts | ||||||
| Demand Estimation Models | Direct demand models | |||||
| Regional TDM | ||||||
| Trip generation and flow models | ||||||
| GIS-based models | ||||||
| Discrete choice models | ||||||
| Simulation-based traffic models | ||||||
| Data fusion | ||||||
| Travel surveys | ||||||
Legend: ![]() = low suitability;
= low suitability; ![]() = moderate suitability;
= moderate suitability; ![]() = high suitability.
= high suitability.
Note: For some categories, multiple ranges (e.g., ![]() /
/![]() ) are used since the corresponding criteria might vary significantly based on the specific characteristics of the model developed.
) are used since the corresponding criteria might vary significantly based on the specific characteristics of the model developed.
Step 6 in the scalable risk assessment process is to use the analytic method selected in Step 5 to estimate the desired exposure measure(s). All of the previous steps involve making scoping or planning decisions about how to estimate exposure. Step 6 in the process is when the detailed analysis for exposure estimation occurs. As a result, the Step 6 section in this guide is the largest and has the most content.
The full report includes a section for each of the three primary methods to estimate exposure:
Step 7 in the scalable risk assessment process consists of compiling other data besides exposure that is required based upon the risk definition selected in Step 3. The three possible risk definitions are:
Detailed instructions for compiling other required data for these three risk definitions is beyond the scope of this guide. There is extensive guidance and examples in several other reports, manuals, and guides. Therefore, these sections in the guide provide summary information and pointers to these other guidance documents.
Step 8 in the scalable risk assessment process is to calculate risk values based on the outputs from previous steps. That is, Step 6 provides exposure estimates and Step 7 provides observed crashes, expected crashes, or additional risk indicators that are then used to calculate final risk values at the geographic scale chosen in previous steps.
Case studies are provided in this chapter to tie together the eight steps described in this guide. The case studies are based on actual examples of risk assessment for pedestrians and bicyclists.
| < Previous | Table of Contents | Next > |

