U.S. Department of Transportation
Federal Highway Administration
1200 New Jersey Avenue, SE
Washington, DC 20590
202-366-4000
| < Previous | Table of Contents | Next > |
The first step in developing risk values for pedestrians and bicyclists is to define clearly the use(s) for the risk values. The use(s) of the risk values will establish key parameters (such as geographic scale) in later steps of the risk assessment process. This step is analogous to selecting the destination for a trip, such that one can pick the best route to reach the desired destination.
This chapter includes a list of questions that can help to clarify your objectives for risk assessment and how you plan to use the risk values. This chapter outlines and describes common uses of risk values, with tabular and graphical examples from current practice that illustrate these uses.
This chapter also includes a section on assessing currently available data, as well as the feasibility of gathering additional data, for use in the remaining steps in the exposure estimation process. Some exposure estimation methods are very data-intensive, and analysts should be aware of existing data resources and limitations as they work through the exposure estimation process.
Several questions can help to clarify your use(s) and objectives of risk values:
The following sections describe typical uses or applications of pedestrian and bicyclist risk values, as well as an example to illustrate the application of risk values. Typical uses include:
The objective in this use is to estimate risk for non-motorized modes as safety performance measures. For example, the Federal Highway Administration (FHWA) Safety Performance Management Program (https://safety.fhwa.dot.gov/hsip/spm/) currently requires that state departments of transportation (DOTs) and metropolitan planning organizations (MPOs) report five safety performance measures, one of which is the Number of Non-motorized Fatalities and Non-motorized Serious Injuries. Two of the motor vehicle safety performance measures (Rate of Fatalities and Rate of Serious Injuries) include motor vehicle exposure (expressed in 100 million vehicle miles traveled (VMT)), and there is a desire to have a similar exposure estimate for the non-motorized safety performance measure. Because there is no commonly accepted exposure metric for pedestrians and bicyclists, the current non-motorized safety performance measures are based on numbers of fatalities and serious injuries rather than including exposure. Many cities and small communities continue to improve infrastructure and other conditions for walking and bicycling and may desire to monitor safety performance at more granular levels.
As an example, Table 1 shows an excerpt of the National Highway Traffic Safety Administration (NHTSA) Traffic Safety Facts for pedestrians, which shows the risk of pedestrian fatalities by age and gender. Note that the exposure measure in this table is per 100,000 population, as measured by the U.S. Census.
Table 1. Example of Pedestrian Fatality Risk by Age and Gender
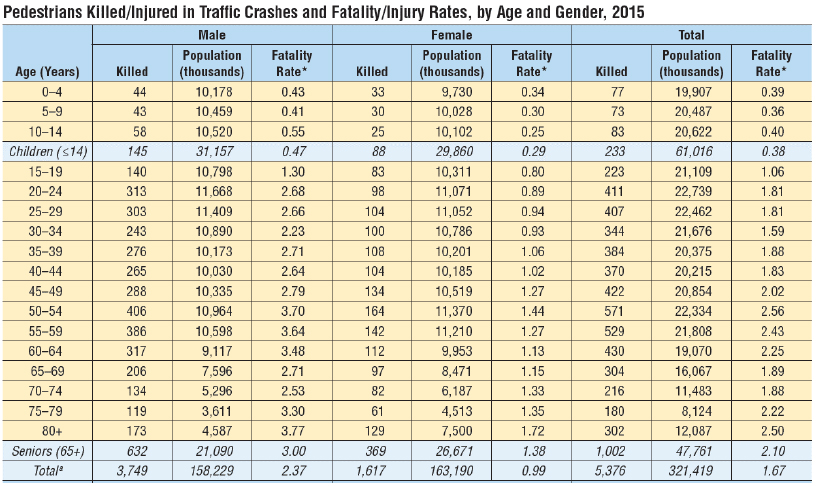
* Rate per 100,000 population
Source: NHTSA Report DOT-HS-812-375, Traffic Safety Facts: 2015 Data, Pedestrians, February 2017.
As another example, Figure 2 shows an excerpt from the 2016 Benchmarking Report, which shows the risk of pedestrian fatalities in 50 cities. The exposure measure in this chart is per 10,000 walking commuters. One should note that an ideal exposure measure includes all walking trips, not just walking commutes or the total population. However, accurately quantifying the total number of walking trips on a national level is challenging given available data sources.
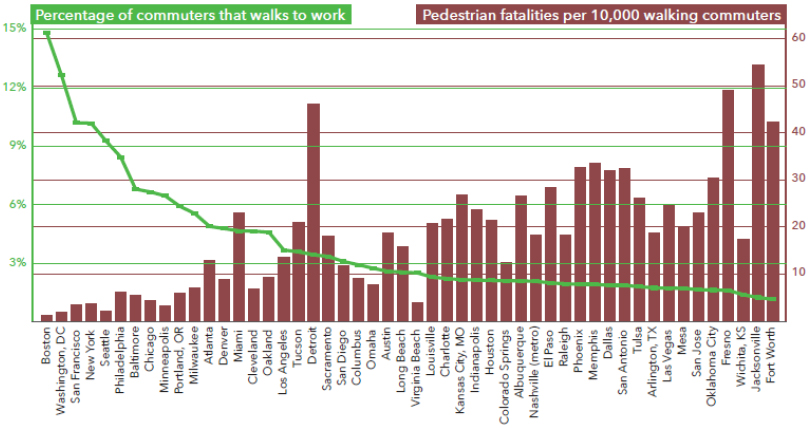
Figure 2. Example of Pedestrian Fatality Risk in 50 Cities
Source: 2016 Benchmarking Report, Alliance for Biking & Walking.
The objective in this use is to estimate pedestrian and bicyclist risk (separately) to identify high-risk sub-areas (e.g., census geography, traffic analysis zones (TAZs), or other areawide zones) for more focused analysis. This use is most common where large geographic areas are being considered (such as a metropolitan planning area or an entire state), and there is a need to focus analysis resources in those sub-areas where pedestrian and bicyclist risk is highest in relation to other sub-areas within the entire geographic area. In some cases, there may be more detailed follow-up analysis in these high-risk sub-areas to identify facility-specific exposure, contributing risk factors, and possible improvements.
As an example, Figure 3 shows an example of a pedestrian risk analysis that classified all census tracts in California into a neighborhood type: central city, urban, suburb and rural. Pedestrian risk was quantified in each of these neighborhood types using two different travel surveys: the 2010-2012 California Household Travel Survey (CHTS) and the California travel statistics from the 2009 National Household Travel Survey (NHTS). The analysis included two different exposure measures calculated from the travel surveys: 1) million miles walked or biked on a weekday; 2) per 100,000 population. The authors concluded that the crash rates normalized by population are somewhat misleading, since pedestrian and bicyclist activity levels (and therefore exposure) are not consistent across these neighborhood types.
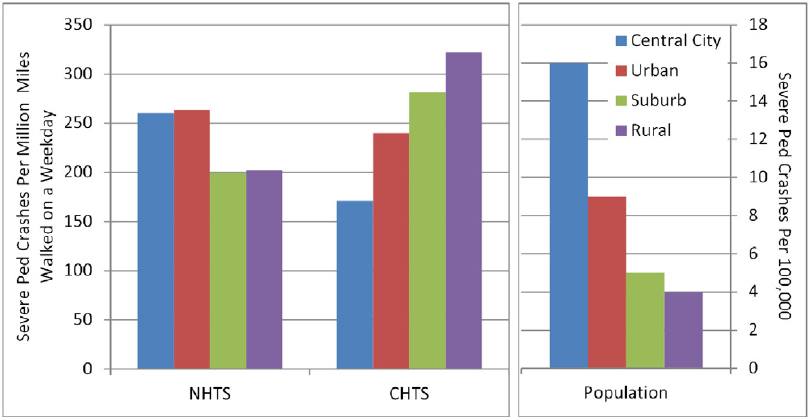
Figure 3. Example of Pedestrian Risk Analysis in California Using Household Travel Surveys
Source: Salon 2016.
The objective in this use is to estimate risk for specified facilities within a given jurisdiction (e.g., city, county, etc.) to identify those facilities or facility types with the highest risk. Depending upon the mode of interest (pedestrians or bicyclists), one could consider intersections or defined street segments (or both). In some cases, one may perform risk analysis on an ad hoc basis and not for the entire street network (perhaps only a few streets or locations).
As an example, Table 2 shows the results of a systemic safety analysis to identify high-risk intersections for pedestrians and bicyclists in the north central part of Minnesota. In this systemic analysis, motor vehicle volume (called Cross Product in the table) and Primary Land Use are used to represent exposure.
Table 2. Example of Systemic Safety Analysis that Includes Exposure Variables

Source: Report FHWA-SA-17-002, Systemic Safety Project Selection Tool Supplemental Case Studies, December 2016.
The objective in this use is to estimate risk for defined improvement projects (that include specific facilities) that are being considered for funding. In this case, one uses exposure estimates to normalize crashes (i.e., account for different levels of use/activity). Also, several other ranking criteria besides safety are often considered (see National Cooperative Highway Research Program (NCHRP) Report 803, Active Trans Priority Tool), such as stakeholder input, constraints, opportunities, existing conditions, demand, connectivity, equity, and compliance.
As an example, Table 3 shows an example from NCHRP Report 803 that includes Safety as one of multiple project scoring criteria. In the example, a weight is applied to each criterion, and then a composite Prioritization Score is calculated. Note that this example uses a safety criterion, but it could also include a risk or exposure criterion as well.
Table 3. Example of Multi-Criteria Project Prioritization
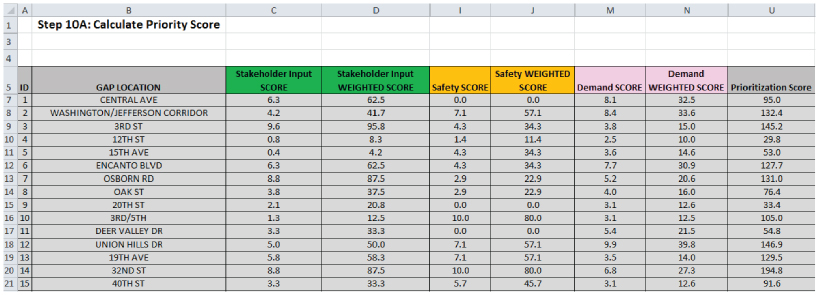
Source: NCHRP Report 803, Pedestrian and Bicycle Transportation Along Existing Roads—ActiveTrans Priority Tool Guidebook, 2015.
The objective in this use is to evaluate the effectiveness of a specific countermeasure in reducing pedestrian and bicyclist risk. Exposure is needed for a specific facility (or facilities) both before and after the countermeasure was implemented. In many cases, the implementation of the countermeasure will have an effect on the exposure. Exposure typically increases in the after period because the countermeasure improves conditions for pedestrians and/or bicyclists, thereby attracting more pedestrian and bicyclists. In addition, the normal growth in motor vehicle traffic may increase exposure if that is included in exposure calculations. Therefore, it is important that exposure be accurately measured or estimated in both the before and after periods.
As an example, Table 4 shows a before-after evaluation of pedestrian hybrid beacons (formerly called High intensity Activated crossWalK (HAWKs)) in Tucson, Arizona. Table 4 shows crash frequencies and crash rates for the treatment sites as well as three reference groups. Two exposure measures are shown: 1) million entering vehicles and pedestrians, and 2) million entering pedestrians. The Empirical Bayes method is used to compare statistically the observed crash frequency during the after period (with treatment installed) to an estimated crash frequency if the treatment had not been installed.
| Treatment Group | Measure | All Crashes with Intersecting Street Name | Crashes coded as Intersection-Related Crashes | ||||
|---|---|---|---|---|---|---|---|
| Before | After | Percent Change |
Before | After | Percent Change |
||
| HAWK sites (21) | Frequency | 11.0 | 9.2 | -17 | 5.0 | 3.3 | -34 |
| Total crashes/MEV&P | 0.748 | 0.618 | -17 | 0.341 | 0.223 | -35 | |
| Severe crashes/MEV&P | 0.265 | 0.210 | -21 | 0.138 | 0.094 | -32 | |
| Pedestrian crashes/MEV&P | 0.029 | 0.005 | -83 | 0.017 | 0.002 | -86 | |
| Pedestrian crashes/MEP | 3.081 | 0.511 | -83 | 1.826 | 0.255 | -86 | |
| Reference group 1: signalized intersections (36) | Frequency | 44.9 | 41.9 | -7 | 19.6 | 16.8 | -14 |
| Total crashes/MEV&P | 1.953 | 1.788 | -8 | 0.854 | 0.716 | -16 | |
| Severe crashes/MEV&P | 0.549 | 0.503 | -8 | 0.294 | 0.241 | -18 | |
| Pedestrian crashes/MEV&P | 0.020 | 0.016 | -23 | 0.010 | 0.008 | -16 | |
| Pedestrian crashes/MEP | 2.051 | 1.546 | -25 | 1.025 | 0.839 | -18 | |
| Reference group 1: unsignalized intersections (35) | Frequency | 4.2 | 4.3 | 3 | 1.6 | 1.3 | -17 |
| Total crashes/MEV&P | 0.285 | 0.292 | 2 | 0.108 | 0.090 | -17 | |
| Severe crashes/MEV&P | 0.098 | 0.088 | -10 | 0.043 | 0.038 | -10 | |
| Pedestrian crashes/MEV&P | 0.006 | 0.009 | 52 | 0.003 | 0.004 | 42 | |
| Pedestrian crashes/MEP | 1.383 | 2.078 | 50 | 0.615 | 0.866 | 41 | |
| Reference group 2: unsignalized intersections (102) | Frequency | 5.9 | 6.1 | 3 | 2.4 | 2.1 | -9 |
| Total crashes/MEV&P | 0.418 | 0.430 | 3 | 0.166 | 0.150 | -9 | |
| Severe crashes/MEV&P | 0.140 | 0.141 | 0 | 0.060 | 0.056 | -6 | |
| Pedestrian crashes/MEV&P | 0.006 | 0.011 | 93 | 0.001 | 0.003 | 143 | |
| Pedestrian crashes/MEP | 1.233 | 2.297 | 86 | 0.257 | 0.602 | 134 | |
Crashes/MEV&P = Type of given crash (total, severe, or pedestrian crashes) per million entering vehicles and pedestrians.
Pedestrian crashes/MEP = Pedestrian crashes per million entering pedestrians.
Note: Frequency is expressed as the average annual number of total crashes for a site with the given intersection control and study period.
Source: Report FHWA-HRT-10-042, Safety Effectiveness of the HAWK Pedestrian Crossing Treatment, July 2010.
The goal in this use is to evaluate pedestrian and/or bicyclist risk at a specific site or at multiple sites. A site evaluation can be conducted on a one-time basis or on a before-after basis. This use differs from network screening in that a site evaluation focuses on a limited number of selected sites, whereas network screening includes all locations or sites within a defined network or area. This use differs from a countermeasure evaluation in that a site evaluation could assess the risk of multiple combined countermeasures, whereas a countermeasure evaluation typically tries to isolate the effectiveness of a single countermeasure at numerous locations.
As an example, Figure 4 shows a site evaluation conducted at a single intersection in Ft. Lauderdale, Florida. The Florida DOT implemented exclusive pedestrian phases in the intersection signal timing, and evaluated the site before and after implementation of the phases. Because Florida DOT wanted to monitor the improvement soon after implementation, additional risk indicators in the form of conflict rates (normalized by pedestrian and bicyclist exposure) were used in the evaluation.
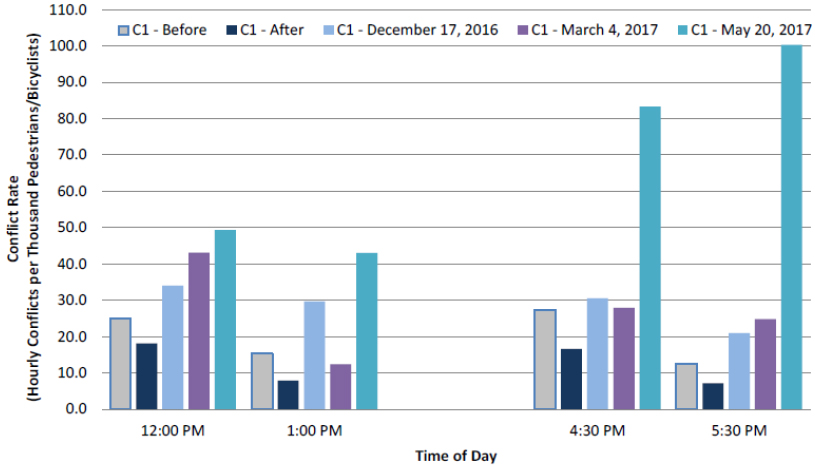
Figure 4. Example of Site Evaluation: Exclusive Pedestrian Phase at Single Intersection
Source: Florida DOT Internal Tech Memo, November 2017.
As indicated earlier in this chapter, the defined use(s) of the risk values establish key parameters in later steps of the risk assessment process. Table 5 outlines key parameters that must be selected in Steps 2 through 5, and provides some initial guidance for parameter selection based on each of the defined uses presented earlier. Note that each step, and the considerations for selecting key parameters in each step, is covered in more detail in the upcoming chapters of this guide. Table 5 is intended as a preview and overview of decisions that must be made in these upcoming risk assessment steps.
| Step 1. Define Use(s) of Risk Values | Step 2. Select Geographic Scale | Step 3. Select Risk Definition | Step 4. Select Exposure Measure | Step 5. Select Analytic Method | |||||||||||
|---|---|---|---|---|---|---|---|---|---|---|---|---|---|---|---|
| Point | Segment | Network | Regional | Observed Crash Rate | Expected Crashes | Risk Indicators | Distance Traveled | Time Traveled | Volume/ Counts | Trips Made | Population | Site Count | Estimation Model | Travel Survey | |
| Safety performance measures: Track changes in risk over time |
X | X | X | X | X | O | O | O | X | ||||||
| Network screening: area-based: Identify high-risk areas for possible improvement |
NA | NA | O | O | X | O | O | X | O | ||||||
| Network screening: facility-based: Identify high-risk facilities for possible improvement |
NA | NA | O | O | O | O | O | O | X | ||||||
| Project prioritization: Rank projects based on existing risk or expected risk reduction |
O | O | O | O | O | X | X | X | |||||||
| Countermeasure evaluation: Evaluate if a specific countermeasure reduces risk (and by how much) |
NA | NA | O | O | O | O | X | X | O | X | |||||
| Site evaluation: Evaluate if risk was reduced after site improvements (and by how much) |
NA | NA | O | O | O | X | X | O | X | ||||||
Legend: ![]() = Yes, preferred; O = yes, as a secondary preference; X = Not likely; NA = Not applicable
= Yes, preferred; O = yes, as a secondary preference; X = Not likely; NA = Not applicable
In the next few steps of the scalable risk assessment process, you will have to make several decisions about risk definitions, exposure measures and supporting data, and analytic methods to use. These decisions are strongly influenced by available data resources and analytic capabilities. Therefore, you should assess available data resources and capabilities within your agency or region to determine the type and scope of scalable risk assessment that is feasible. The following checklist should help in key decision areas:
Determine what definition of risk can be supported.
Risk definition of Observed Crash Rate:
Risk definition of Expected Crashes:
Risk definition of Additional Risk Indicators:
Determine what data resources currently exist for calculating or estimating exposure. Do you have:
Determine your analytic capabilities to estimate exposure. Are you familiar with:
| < Previous | Table of Contents | Next > |

