


4.0 Getting Started with Transportation Safety Planning—Data Collection
Data collection is one of the first steps in the transportation safety planning process. Data are needed to establish reasonable goals, objectives, performance measures and targets, or identify programs and projects. Fortunately, the data collection process is continually improving, as technology advances and organizational capacity improves. Data collection and maintenance nonetheless require an ongoing effort that needs to be carefully planned and implemented.
This section of the report provides an overview of safety data sources and considerations that transportation planners should be familiar with to get started with safety data analysis.
4.1 Institutional Considerations
Institutional arrangements and relationships among agencies can play a significant role in determining how easy or difficult it is for planners to access safety data. Although seemingly straightforward, the tasks of collecting, storing, and sharing data across agencies are far from trivial. Data standards, business rules, communications protocols, agency missions, legal and privacy concerns, and other factors come into play. It is important for DOTs and MPOs, who have a stake in transportation safety, to work together to improve the quality and usage of safety data.
Under MAP-21, States are required to have a Traffic Records Coordinating Committee (TRCC) to qualify for Section 405(c) funding. The purpose of the TRCC is to coordinate the activities of safety data stakeholders across each State in an effort to improve the timeliness, accuracy, completeness, uniformity, accessibility, and integration of the various traffic records systems throughout the State. Agencies with an interest in improving traffic safety data from any level of government should understand their State’s TRCC structure and process. MAP-21 also requires that States employ a data-driven process to improve safety on all public roads. In particular, they must have a State safety data system to support problem identification and countermeasure analysis, project evaluation, and performance management.
4.1.1 Collaboration and Coordination
States and MPOs with successful transportation safety programs demonstrate collaboration and coordination across agencies and levels of government. For example, in Tennessee, the Department of Public Safety collects crash data, but works closely with the Long-Range Planning section to share the data with safety planning stakeholders. MPOs and RPOs interact with staff in the Planning division to access data and conduct safety planning activities. Communication and collaboration across agencies is seen as one of the keys to success for safety planning in Tennessee.
his type of cooperative approach is needed to ensure that safety data is collected and utilized to its fullest extent. Agencies that manage safety data must be willing to share it with other agencies in order for them to effectively address safety problems within their respective jurisdictions.
Collaboration goes beyond simply making data available to other agencies. For instance, a number of State DOTs ensure data is easily accessible through generated reports, Web interfaces, or other online tools; and provide educational resources to assist novice data users. Examples include Florida’s Signal Four Analytics and Alabama’s Critical Analysis Reporting Environment (CARE), which also includes training videos and documentation to assist users.
4.1.2 Organizational Capacity
An organization’s staff capacity and resources go a long way in determining its ability to collect and manage safety data. This is true at every level of government, but especially applies to MPOs and local agencies, where collection and management of safety data may be considered as an optional function within the organization.
It is often the case that an agency’s interest in safety planning and analysis is initiated or significantly enhanced through the efforts of a single staff member or a small group of staff. In the long term, however, it is important for agencies to dedicate staff resources to the collection and maintenance of safety data. This provides continuity in the event of staff turnover, and ensures that safety data collection and management are integrated into agency processes. MAP-21 safety data requirements institutionalize safety data collection and management at the State level, but do not address this need at the MPO and local level.
For those agencies just getting started with transportation safety planning, a full data collection approach may not be necessary. Instead, planners can coordinate with their State DOTs to understand what data already is available and the opportunities to access that information. It also might be possible for DOT staff to create annual custom or generated crash reports to reduce the burden of data collection efforts.
4.1.3 Funding
Liability Protections
The use of reports, data, or other information compiled to meet Federal safety program requirements as evidence in Federal or State courts is prohibited by 23 U.S.C. § 409 (section 409). In particular, the law reads: “Notwithstanding any other provision of law, reports, surveys, schedules, lists, or data compiled or collected for the purpose of identifying, evaluating, or planning the safety enhancement of potential accident sites, hazardous roadway conditions, or rail-way-highway crossings, pursuant to sections 130, 144, and 148 [152] of this title or for the purpose of developing any highway safety construction improvement project, which may be implemented utilizing Federal-aid highway funds shall not be subject to discovery or admitted into evidence in a Federal or State court proceeding or considered for other purposes in any action for damages arising from any occurrence at a location mentioned or addressed in such reports, surveys, schedules, lists, or data.”
Source: FHWA, Office of Safety Programs, Legal Issues, October 15, 2014.
At a national level, NHTSA provides 405(c) Traffic Safety Information System Improvement Grants for States to develop and implement effective programs that improve the timeliness, accuracy, completeness, uniformity, integration, and accessibility of data needed to identify traffic safety program priorities. 23 U.S.C. section 405(c) funds are awarded to State highway safety offices, which, in turn, distribute funds to partner agencies to link data systems, including traffic records and systems that contain medical, roadway, and economic data, improve the compatibility and interoperability of State data systems with national data systems and the data systems of other States, and enhance the ability to observe and analyze trends in crash occurrences.
NHTSA is not the only source of funds that are eligible for safety data collection and management. HSIP funds also may be used to improve safety data collection, management, and analysis processes and systems if identified as an emphasis area in the SHSP. Although not limited to safety, State Planning and Research (SPR) funds may also be used to fund safety studies and to develop and implement HSIP requirements. Other Federal funds that may be used to support safety data collection include FMCSA funds (Motor Carrier Safety Assistance Program) and metropolitan planning (PL) funds. Additionally, State and local governments may elect to use non-Federal funds for safety data collection, such as traffic counts or collection of inventory data.
4.1.4 Liability
States differ with respect to their handling of liability concerns related to safety data. In general, State DOTs are protected against lawsuits arising from their collection, analysis, and reporting of safety data under 23 U.S.C. Section 409.
4.2 Common Types of Safety Data and Application to Planning Processes
There are several datasets that are part of the overall traffic records coordination process (figure 4.1), including crash data, roadway characteristics, traffic volume, driver and passenger information, vehicles, injury control (e.g., EMS response time), citation and adjudication (e.g., driver arrest record). For transportation planning purposes, the most commonly used are crash, roadway, and traffic volume (exposure) data. These datasets are shown in figure 4.1.
Figure 4.1 Relationship Diagram. Types of Safety Data
Source: Cambridge Systematics, modified from Federal Highway Administration’s Crash Data Improvement Guide, April 2010.
4.2.1 Crash Data
Crash data is the foundation of transportation safety planning. For each crash that meets a minimum injury or property damage reporting threshold, a large set of information is collected and entered into a State database. (Reporting thresholds are set individually by States. In most States, crashes with one or more injuries or with a property damage threshold of around $1,000 are reported. The property damage threshold in particular can vary by State.)
The specific crash data elements that are collected vary by State, but generally are based on the guidelines outlined in the Model Minimum Uniform Crash Criteria (MMUCC). Officers who respond to the scene of a crash collect information on the crash itself (e.g., location, number of vehicles, type of crash); the vehicles or ‘units’ involved (e.g., model and year, estimated speed); and the people involved (e.g., driver, occupant, pedestrian, age, sex, impairment status).
One of the most important data fields in the crash report is the injury level of each person involved in the crash. The KABCO system is a standardized way of coding injury severity using the following injury codes:
- K—fatality;
- A—serious injury;
- B—nonincapacitating injury;
- C—possible injury; and
- O—no injury.
The standardization of injury coding is important for conducting comparisons across States or regions; however, the underlying definitions of each injury have varied historically. In a 2014 rulemaking that outlined HSIP performance measure requirements (23 CFR Part 924. Department of Transportation. Highway Safety Improvement Program. Federal Register. Vol. 79, No. 60. March 28, 2014), FHWA proposed to standardize the (A) injury level to be consistent with the ‘suspected serious injury’ definition in MMUCC (FHWA. MMUCC Guideline: Model Minimum Uniform Crash Criteria. Fourth Edition. 2012), which is “any injury, other than fatal, which results in one or more of the following:
Severe laceration resulting in exposure of underlying tissues, muscle, organs, or resulting in significant loss of blood;
- Broken or distorted extremity (arm or leg);
- Crush injuries;
- Suspected skull, chest, or abdominal injury other than bruises or minor lacerations;
- Significant burns (second- and third-degree burns over 10 percent or more of the body);
- Unconsciousness when taken from the crash scene; or
- Paralysis.
Electronic Reporting and Storage of Crashes
Source: FHWA. Model Inventory of Roadway Elements: Version 1.0. 2010.
MIRE is the corollary to MMUCC
for roadway characteristics. MIRE includes a detailed list of data elements that are recommended
for collection by transportation agencies for the specific purpose of evaluating safety.
States are moving toward collecting and submitting crash data electronically through the use of laptop computers in law enforcement vehicles. In addition to streamlining the data collection process, electronic crash reporting can help reduce errors and results in more timely submission of reports. This, in turn, allows agencies to more quickly identify and address emerging problems.
Another advantage of electronic crash reporting is that it allows for the integration of in-car mapping technologies within the crash form completion process. In other words, rather than record the crash location with a global positioning system (GPS) reading, street address, or distance from an intersection, an officer can click on the crash location on a digital map and have all of the necessary location data automatically entered into the crash report (e.g., county, city, latitude and longitude coordinates, proximity to intersection, etc.). This is a significant improvement, as the process of locating crashes by other means requires a substantial amount of staff resources and is more prone to errors. Several States are beginning to incorporate in-car crash mapping into law enforcement vehicles, including Ohio and Alabama.
Once crash data have been collected and submitted to the State (through electronic or paper submission), crashes are stored in a centralized database. Generally, the data is stored using a relational database structure with separate tables for the crash, unit, and person information, as described above. These tables are linked through identifier fields in each table.
Depending on the institutional arrangements in the State, the crash data may be stored in its original form by the DOT, the State highway patrol, the Department of Revenue, another public agency, or even universities.
Many DOTs have found that storing the data in separate tables is not convenient for analysis and, thus, create a separate database for this purpose. As part of this process, DOTs may conduct a quality control check that addresses inconsistencies or omissions in the data, as submitted by the investigating law enforcement agency, assigns coordinates to crashes, and supplements, or enhances the crash report based on a review of the crash narrative. It is important for agencies which are getting started with safety data analysis to understand what information has been added or may be missing relative to the original crash report.
The State DOT’s crash database is likely to contain the most important data for some types of analysis, but may not include the full range of information found in the original crash report. For example, State DOTs may be less interested in knowing the age of every crash victim than a public health department. It is important for agencies that are getting started with safety data analysis to understand what information has been added or may be missing relative to the original crash report.
Relevance to Planners
As a DOT or MPO planner, the first step is to identify where crash data is housed in your State, and then work with the data manager to understand what information is available for planning purposes and how to obtain it. The State DOT’s crash database is likely to contain the most important data for planners. Crash data can be used to develop performance measures, identify trends and contributing factors, and create crash maps or other visualizations. State DOTs and MPOs may perform these analyses when they update their long-range plans, or for corridor- or project-level studies.
4.2.2 Roadway Characteristics
Roadway characteristics data refers to the set of information that describes the physical attributes and conditions of the street network. While some roadway characteristics are collected by law enforcement through the crash reporting process, a more comprehensive and reliable set of information is needed to fully evaluate the safety performance of the network.
Developing and maintaining a roadway inventory database is a complex and expensive task. This is true for State-maintained routes, but it is even more challenging to collect roadway characteristics on local street networks, which account for around 20 percent of fatalities nationwide (FHWA Assessment of Local Road Safety Funding, Training, and Technical Assistance, August 2013). Nonetheless, some States have developed databases that include certain data elements on all State and locally maintained roads. For example, Tennessee DOT collects a consistent set of roadway attributes and volume estimates for all public roads since 2012.
Roadway characteristics can be stored in various ways. Many DOTs use linear referencing, which allows roadway attributes, such as shoulders or speed limit, to be stored individually and to be defined by the route, along with the start and end points. Crashes also can be referenced using the same system.
The primary advantage of linear referencing is that it allows for a very detailed delineation of features along a route without breaking the route into very small segments (figure 4.2). A potential downside is that analyzing data stored in a linear referencing system requires a relatively high level of technical expertise.
Figure 4.2 Graph. Linear Referencing Conceptual Diagram
Source: Maryland State Highway Administration, One Maryland One Centerline Linear Referencing.
Roadway characteristics also may be associated with segments that begin and end at intersections (e.g., Main Street from Washington Street to Lincoln Street). This approach is more common at the local level. While intuitively appealing, a drawback of this segmentation scheme is that features relevant to safety may vary over the course of the segment. For example, sidewalks may be present on only one-half of the segment length. This is less likely in urban areas, but is not uncommon in suburban and rural areas with longer distances between intersections.
Regardless of how roadway characteristics data is organized, the relevant features must ultimately be associated with crashes. This association enables analysts to characterize crashes by roadway features. For example, a State or MPO may report the number of crashes per year by roadway functional class, number of traffic lanes, speed limit, or average daily traffic, among other factors.
Relevance to Planners
Roadway characteristics data provides context for crashes and allows planners to identify crash risk factors. Additionally, organizing crashes by roadway characteristics allows analysts to understand the relative performance of different facility types (e.g., two-lane versus four-lane rural roads). This type of information is needed to most effectively target countermeasures to observed crash patterns and also is necessary for more advanced methods of analysis, including crash prediction.
4.2.3 Traffic Volume
All Roads Network of Linear-Referenced Data
In 2012, FHWA announced a new requirement that States must submit a complete Linear-Referencing System for all public roads in their State. This dataset is referred to as the All Roads Network of Linear-Referenced Data (ARNOLD). The 2014 ARNOLD Reference Guide describes how this requirement can be met in different States. Once implemented, ARNOLD will greatly facilitate the process of locating crashes on local roads, which account for a substantial portion of fatalities and injuries. Further, it will provide a consistent linear-referencing system for the entire U.S.
Source: FHWA. Arnold Reference Manual: All Public Roads Geospatial Reference Study. 2014.
All States are required to collect and submit traffic count data through the FHWA’s Highway Performance Monitoring System (HPMS). The HPMS requires data to be collected on a sample of roads so that State- and county-level traffic volume estimates can be made. State DOTs and other agencies typically also conduct traffic counts beyond these requirements. HPMS data can be obtained through the FHWA HPMS Web site.
The relationship between crashes and traffic volume can be expressed in a few different ways, depending on the analysis questions at hand. For intersections, volume is often expressed as million entering vehicles (MEV). For each intersection, the number of vehicles that enter the intersection is calculated on an annual or multiple-year basis. Crashes are then associated with the same intersection (often using a distance threshold such as 250 feet), and the number of crashes is divided by the traffic volume to determine the rate of crashes per entering vehicles, typically expressed as crashes per 100 million entering vehicles.
The process for calculating crash rates on segments is different than that used for intersections. Traffic counts conducted along segments are first converted to volume estimates by multiplying the count at a single location by the segment length. From there, the number of crashes along the segment is divided by the traffic volume to determine the number of crashes per million vehicle miles traveled (VMT). Calculating the crash rate at a regional or State level follows a similar process.
Figure 4.3 Chart. Crash Distribution by Average Daily Traffic Example
Source: Sample Data, Cambridge Systematics, Inc., 2015.
Relevance to Planners
Traffic volume data are essential to understanding the safety risk based on the amount of travel. For instance, if planners are conducting a safety review of intersections, they may discover that intersections with the same number of crashes can have very different risk profiles depending on the level of traffic. Like roadway characteristics data, traffic volume data also can be used to help characterize the relative safety performance of groups of roadways (e.g., what is the crash rate on arterials with more than 20,000 vehicles per day versus arterials with less than 20,000 vehicles per day?).
4.2.4 Integrating Crash, Roadway, and Volume Data
State DOTs and their safety partners dedicate a significant amount of resources to the tasks of organizing these individual datasets and linking them together. While each is useful on its own, linking the three sets of information together provides the greatest insight.
Since safety data analysis ultimately is concerned with addressing the factors that contribute to crashes, it is necessary to understand the roadway and traffic volume conditions at the locations where crashes have occurred. This requires each crash to be precisely located with respect to the roadway inventory.
As the crash data collection and management processes become increasingly automated, one of the main advances relates to the ability to more easily and more accurately locate crashes. State DOTs differ in the specifics of their approach, but many use automated processes to link location information provided in crash reports to roadway and traffic volume inventories.
In addition to linkages that occur at the crash data management stage, planners may use GIS processes to link crash data to local road segments or intersections. For example, the Mid-Ohio Regional Planning Commission has developed a methodology to assign crashes to intersections within a 250-foot buffer (Mid-Ohio Regional Planning Commission Top 40 Regional High-Crash Location Methodology, September 2014).
Once crashes have been linked to roadway or intersection inventories, a rich set of information is available for querying. Additionally, crashes along a given segment of road or at a particular intersection may then be aggregated to determine what types of crashes occur with the greatest frequency, and how each location performs relative to others. The use of advanced safety analysis methods, such as those outlined in the Highway Safety Manual (HSM), requires that crashes, roadway characteristics, and volume are integrated.
4.2.5 Other Safety Datasets
Citation and adjudication data, injury data, vehicle data, and driver and passenger information are less commonly used for transportation planning purposes, but are extremely important in other contexts. Citation and adjudication data refers to the arrest and conviction records of individual drivers for traffic offenses. States are moving toward implementation of centralized citation and adjudication systems which enable analysis of trends and problem identification. This capability supports targeted enforcement, which helps to reduce specific crash types such as impaired driving crashes and speed-related crashes.
Injury control data is concerned with the health care systems and processes that are involved in responding to motor vehicle crashes. Examples include prehospitalization (EMS) data, emergency department data, hospital discharge data, trauma registry data, and vital records data. Prehospitalization data provides insight into emergency response times, which are critical for reducing fatalities in particular. Hospital and trauma data provide a more accurate assessment of injury outcomes as compared to law enforcement crash reports. Additionally, hospital records include injuries from certain types of crashes that are not captured by most State data systems, such as those involving a single bicycle.
Vehicle data provides valuable information to regulatory agencies regarding the safety of vehicle technologies as well as any significant trends regarding the types of vehicles involved in crashes. Vehicle crash history also is used in some transportation planning analyses, such as identifying locations with a high incidence of commercial vehicle crashes or motorcycle crashes.
Passenger and driver information are frequently used to identify and document behavioral safety patterns, such as impaired driving or failure to wear seat belts. Similarly, tracking the age and other available demographic information of drivers and passengers involved in crashes provides a better overall understanding of traffic safety problems and sheds light on the effectiveness of education or legislative action, such as Graduated Driver’s Licensing (GDL).
4.3 Data Quality
The successful application of safety data to the transportation planning process is contingent on the availability of high-quality data. The following six characteristics for evaluating the quality of State safety databases have been identified: timeliness, accuracy, completeness, consistency/uniformity, integration, and accessibility (FHWA Crash Data Improvement Program Guide, April 2010). Each of these factors affects the ability to use or draw conclusions from State safety databases. Transportation safety planners should be familiar with these criteria and consider how their data performs with respect to each area. A brief of discussion of crash data quality characteristics is provided below.
4.3.1 Timeliness
Timeliness is concerned with how quickly crash reports are entered into the State database and become available for analysis. The timely availability of crash data allows planners to identify and address emerging safety concerns. A difference of several months could result in several crashes being prevented, including some serious injuries or fatalities. Electronic crash reporting and better integration of crash data systems have allowed some States to provide access to crashes with very short delays, such as a few days.
4.3.2 Accuracy
Source: FHWA. Crash Data Improvement Program Guide. 2010.
FHWA’s Crash Data Improvement Program Guide provides an indepth discussion of the six data quality performance measures: Timeliness, Accuracy, Completeness, Consistency, and Integration. It is an excellent resource for understanding the crash data collection process and considerations.
The accuracy of crash data has a direct effect on the conclusions that can be drawn from the data. It is expected that crash databases will have some level of error or missing information, but accuracy can be improved substantially through the use of ‘business rules.’ Business rules ensure that crash data reports submitted to State databases are logical and consistent. For example, a crash report that indicates there were zero vehicles involved would fail a basic validation requirement. Incorporating edits and validation rules into data entry will result in significant accuracy improvements.
4.3.3 Completeness
Crash data completeness refers to the degree to which each crash is represented in the database, as well as whether all relevant information has been provided for each crash. In both cases, incomplete data can hamper the safety planning process. For example, if one county fails to report one-half of its crashes, it would appear that their roads are much safer than is actually the case. Similarly, if a report for a curve-related crash does not indicate that the crash occurred along a curve, planners will not be able to determine the role that the curve may have played in the crash.
4.3.5 Consistency/Uniformity
Consistency of crash reporting across agencies is important to ensure that differences in reporting practices do not influence safety funding decisions. For example, if one law enforcement agency routinely checks for impaired drivers in crashes, while another does not, an analysis of impaired driving crashes will report a significant difference in impaired driving crashes in these two areas. Injury definitions and application on crash reports also must be carefully defined and consistently reported to allow for appropriate comparisons between regions or States.
4.3.5 Integration
Integration of safety data applies not only to crash, roadway, and traffic volume data, as discussed above, but also to citation, Emergency Medical Service (EMS), and injury data. Relating these datasets to crashes and to each other provides a more complete assessment of driver risk factors (e.g., previous driving under the influence (DUI) offenses), emergency response times, and injury outcomes, with respect to the other information provided in the crash data. Full integration of safety datasets is a worthwhile goal, but is challenging due to legal and privacy concerns, institutional challenges, and technical hurdles. States vary with respect to the current level of integration of their safety datasets.
Integration of State and local data is another aspect of data quality with relevance to safety planning. Some local and regional agencies collect data on roadway features and traffic volume, but these data are not always easily integrated with State sources. They may use a different spatial reference or data definitions that make it difficult to take advantage of information from both sources.
4.3.6 Accessibility
The ease with which safety stakeholders can access and use safety datasets is an important consideration for safety data managers. Users beyond State DOTs must be able to access crash data to develop their safety-related programs. For example, an MPO interested in developing a pedestrian safety campaign may wish to develop safety messages based on pedestrian crash data specific to their region and to target their effort to geographic areas or populations with a high number of pedestrian crashes.
4.4 Obtaining Safety Data
Raw Data in a Nutshell
Working with raw data affords planners the greatest opportunity to dive into the safety data for their region. With raw data it is possible to investigate a wide variety of questions that may arise during the planning process. Additionally, it is possible to account for combinations of crash factors that provide a more nuanced understanding of the circumstances that are contributing to crashes and injuries. Sophisticated online tools can provide similar functionality, but are expensive and time-consuming to develop.
Knowing the types of safety data available in a State and potential data limitations is important—however, the next step is to obtain data to initiate transportation planning activities. Safety data comes in many formats and can be accessed in a variety of ways. Raw crash data often is needed to conduct customized analysis with the greatest amount of flexibility. However, if staff or resources limit the use of raw data, standard reports generated by State DOTs, online tools, or custom inquiries or input from stakeholders can be used to identify safety problems.
4.4.1 Raw Data
In the context of safety planning and analysis, raw data refers to data that has not been aggregated or significantly modified from its initial state. Raw crash data often is available in text file or similar tabular format, where each row of data represents one crash, and columns represent the attributes or characteristics of the crash. Similarly, roadway characteristics data may be provided in tabular format, where each row corresponds to a roadway segment, and columns represent the characteristics of the road. Raw data often is provided as a spatial file, or contains the information needed to develop a spatial file based on the records in a tabular file.
Although working with raw data affords the greatest flexibility, it can be time-consuming and resource-intensive to work with raw data files. Staff with data management and analysis skills are needed to effectively leverage raw data.
| Unique_Crash_Identifier | Severity_Code |
Crash_Type_Code |
Crash_Location_Type |
Offset_Distance |
Offset_Direction |
Fatalities |
Incapacitating_Injuries |
Non_Incapacitating_Injuries |
Possible_Injuries |
Intersection_Related |
Functional_Class |
DOT_Maintained_Roadway |
Roadway_Departure_Crash |
|---|---|---|---|---|---|---|---|---|---|---|---|---|---|
| 1138927103 | 5 | 7 | 1 | 0.03 | North | 1 | 0 | 0 | 0 | Yes | 5 | 1 | 0 |
| 2520002700 | 4 | 14 | 1 | 0.2 | South | 0 | 1 | 0 | 0 | No | 3 | 1 | 0 |
| 4878061929 | 3 | 6 | 1 | 0.3 | East | 0 | 0 | 2 | 0 | No | 5 | 0 | 1 |
| 7448081765 | 4 | 11 | 3 | 0 | 0 | 2 | 0 | 0 | Yes | 7 | 0 | 0 | |
| 5085793336 | 4 | 9 | 1 | 0.22 | North | 0 | 1 | 1 | 0 | No | 7 | 0 | 0 |
| 8605042833 | 2 | 7 | 1 | 0.05 | West | 0 | 0 | 0 | 1 | No | 5 | 0 | 0 |
| 5853315093 | 2 | 15 | 2 | 0.01 | East | 0 | 0 | 0 | 2 | Yes | 4 | 0 | 0 |
| 8669234119 | 3 | 12 | 3 | 0 | 0 | 1 | 0 | Yes | 3 | 1 | 0 | ||
| 9418456907 | 2 | 16 | 1 | 0.1 | North | 0 | 0 | 0 | 1 | No | 5 | 1 | 1 |
| 3565407865 | 2 | 10 | 1 | 0.2 | South | 0 | 0 | 0 | 1 | No | 7 | 0 | 1 |
Source: Sample Data, Cambridge Systematics, Inc., 2015.
4.4.2 Generated Reports
FARS
The Fatality Analysis Reporting System (FARS) is a national database of motor vehicle traffic fatalities. It includes detailed information such as drivers, vehicles, and locations; and are available to the public. Fatalities reported through FARS may differ slightly from other State reports due to definitional differences.
The easiest way to learn about basic safety statistics for a State, region, or county is through reports that already have been prepared. Many State DOTs or other agencies prepare summary reports on a regular basis. Additionally, the NHTSA Fatality Analysis Reporting System (FARS) Web site has indepth State-level reports on fatalities.
Reports generated by State agencies are likely to provide an overall understanding of crash trends at the given reporting level. For example, they may report on fatality and serious injury trends, provide an indication of the most prevalent crash types or contributing factors in an area, or identify high-crash locations. For planners who do not have the time or resources to analyze raw data, these reports provide a basic amount of information to initiate transportation safety planning. For example, Louisiana DOT, through the Highway Research Group, provides its regional transportation coalitions with annual data on basic trends, contributing factors, and high-crash segments and intersections. Pennsylvania DOT provides all its districts, MPOs, and RPOs a biannual report on fatality and serious injury trends, performance target data for contributing factors, and a list of high-crash locations with GIS functionality.
Generated reports may provide enough information to identify general causes or areas of concern, which can lead to the development of safety goals and objectives. They are less likely to answer questions about where and why specific crash problems exist in an area. Further analysis, such as systemic safety analysis, network screening, or road safety assessments, can provide more insight into project and program identification.
4.4.3 Web Interfaces and Tools
Montana DOT Statistics and Data Web Site
(Montana DOT Statistics and Data)
The Montana DOT provides up-to-date crash data summaries that are accessible to the public via the Montana DOT Statistics and Data Web site. Users can download an Excel spreadsheet that allows them to view crash totals based on their selected county, city, or Tribal reservation. Category reports are available for each emphasis area identified in the SHSP.
Several State DOTs provide access to crash data and other datasets for safety stakeholders through Web interfaces. This is a convenient format that makes it easy for planners to access data, while also reducing the need for data owners to respond to data requests.
It is common for some level of analysis capabilities to be incorporated into these data access tools. Users may have the ability to filter data based on criteria such as year, type of crash, injury severity, geographic location, or other factors. From there, they can download the raw data or generated reports based on the selected criteria.
Figure 4.4 Screenshot. Ohio DOT’s Geographic Crash Analysis Tool (GCAT) Query Form and Map
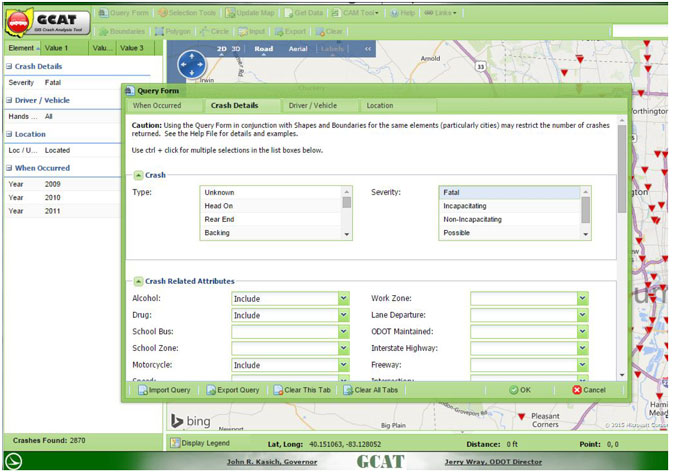
Source: Ohio DOT GIS Crash Analysis Tool.
Web interfaces and tools are meant to enhance transportation safety planning activities, providing data and analysis in a user-friendly way, but a primary limitation for planners is the lack of training or knowledge on the tool. A number of States do offer trainings to overcome this barrier. For instance, training on the Crash Mapping Analysis Tool (CMAT), a software program that provides convenient access to crash data in Iowa, is offered regularly and free of charge to cities, counties, State employees, consultants, and researchers in Iowa.
4.4.4 Custom Inquiries
An alternative to using Web interfaces is for safety stakeholders to request data on an as-needed basis. Such arrangements make sense where a Web interface has not been provided, or data users do not have the capacity to access the data electronically.
Custom inquiries should be limited and address a specific question (e.g., how many run-off-road crashes were there along a specific corridor over a given three-year period?). In these cases, going through the process of analyzing raw data would be too time-consuming; whereas, the data owner is likely able to answer the question with minimal effort.