6.0 Applying Safety Data and Analysis to Inform Decisionmaking
Chapter 4.0 and chapter 5.0 provide planners with an understanding of the types of safety data and analysis techniques available for use in the transportation planning process. Chapter 6.0 describes how to use the information to develop data-driven safety goals, objectives, performance measures, and projects.
6.1 Institutional Considerations
Examples of Collaborating on Safety Planning
Where Data is Housed: In Alabama, the DOT informs all transportation planning agencies of the CARE system, which provides convenient access to crash data.
How to Obtain Data: In Louisiana, transportation planners know to coordinate with the DOTD Highway Safety Section staff for safety data and analysis. In New Mexico, planners submit an email request to the New Mexico DOT Crash Records reporting office.
What Technical Resources Exist: Transportation agencies in Ohio use the Geographic Crash Analysis Tool (GCAT). To ensure planners can utilize the tool, Ohio DOT offers frequent training opportunities.
6.1.1 Legislation
Transportation legislation dating back to the Intermodal Surface Transportation Efficiency Act (ISTEA) and continuing through MAP-21 makes clear the importance of safety in transportation planning. Safety has long been one of the factors transportation planners are required to consider during the transportation planning process and reflected in statewide and regional transportation plans. More recent requirements have looked to strengthen the link between SHSPs and other transportation planning processes and documents. As a result, planners are developing transportation safety goals and objectives based on the results of data and analysis as well as by adopting or customizing safety goals identified in other planning documents, such as the SHSP.
6.1.2 Collaboration and Coordination
The development of transportation safety goals, objectives, performance measures/targets, and projects/programs relies on obtaining crash data and conducting analysis. Crash databases, data owners, and analysis tools differ across States, but a critical step in the planning process is to collaborate across State and regional agencies to understand where the data is housed, how it can be obtained, and what technical resources exist to analyze the information.
Committees
For a recent LRTP update, the York MPO in Pennsylvania formed a safety committee to provide input into the Plan. The committee included representation from MPO staff, local law enforcement, PennDOT District staff, the County Center for Traffic Safety, and the local Bicycle Council.
Other agencies incorporate safety stakeholders into transportation focused committees. For an Interchange Area Management Plan in Oregon, the DOT invited State traffic safety designers as well as the local police and fire departments to be part of the committee, to inform safety considerations in the transportation plan.
An opportunity for coordination can come through multidisciplinary collaboration. As part of the transportation planning process, committees are formed to provide input into a plan. To ensure safety interests are represented during a plan update, a transportation agency can choose to form a safety subcommittee or invite safety stakeholders to participate.
The SHSP and TRCC planning, update, and/or implementation processes also are essential processes planners should be engaged in for purposes of information sharing, and coordination. By being actively involved, planners will:
- Gain exposure to a data-driven safety planning process, which could be replicated during their transportation planning processes;
- Gain access to and better understand available crash, roadway, and volume data and tools to use it;
- Connect with other transportation safety stakeholders;
- Understand the safety emphasis areas and proven strategies, which could be adopted and customized for other transportation planning documents;
- Influence and coordinate safety goals and objectives in order to integrate the processes (e.g., SHSP and transportation planning); and
- Understand the SHSP which is a strategic document and does not include projects, but planners will still gain an understanding of the various funding and prioritization processes to better position themselves to leverage limited safety improvement resources.
Participation in Committees
In Florida, State DOT planners and MPOs are encouraged to participate in the SHSP planning and implementation processes. As a result of this engagement, planners are able to effectively utilize State-developed data to incorporate the SHSP goals and performance measures into their processes. The MPOs also provide their local data to the State and report activities that relate to SHSP to the State via a database entry system.
In both Michigan and Vermont, a high level of coordination exists between the TRCC’s strategic planning efforts and the SHSP effort. This arrangement ensures planners can address any data-related issues related to safety planning in a timely manner.
6.1.3 Organizational Capacity
Planners often wear many different hats, dealing with an array of transportation topics. Because of this, they may not have the staff or resources to adequately address safety, instead relying on the State SHSP to address all safety needs and priorities in the State. However, as mentioned in section 3.2.2, the SHSP does not necessarily address all the statewide or regional transportation safety issues and needs. Opportunities to begin dedicating resources to study transportation safety include the following:
- Weave safety into other plans. Considering safety in the planning process does not necessarily entail the development of a stand-alone safety plan. Some agencies identify efficiencies by considering safety within the context of other planning documents. For example, the Hillsborough MPO in Florida has integrated crash analysis into the congestion management process. Other examples could be related to freight planning, bike and pedestrian plans, or corridor planning.
- Develop reports or other technical assistance. Many State DOTs and some MPOs create custom crash data reports to reduce the burden of agencies completing their own analysis. For instance, Pennsylvania DOT creates a high-crash location list in GIS for each of its MPOs and RPOs every two years. They use these lists during planning and project prioritization processes. Other agencies will identify opportunities to provide safety technical assistance—for instance, Louisiana DOTD relies on its local technical assistance program (LTAP) to assist local jurisdictions with the identification of safety issues and priorities.
- Invest in tools that can advance analysis. A number of tools and approaches exist to conduct crash data analysis, but some need to be purchased and all require staff resources to run and manage. Consider which tool or tools might make sense to your agency and during budget cycles, and identify what opportunities exist to leverage resources to support safety analysis.
- Hire consultants. Without in-house staff expertise, some agencies hire consultants to prepare crash analysis and assist with program/project identification.
- Enlist University assistance. State DOTs and MPOs may rely on students or programs at universities and colleges to perform safety analysis activities.
- Add safety staff or make safety part of someone’s job responsibility. If feasible, agencies may create a position for a safety planner or, at a minimum, ensure it is 25 to 50 percent of an appropriate technical representative’s job responsibilities.
6.1.4 Funding
Transportation safety planning activities can be funded using FHWA statewide or metropolitan planning (PL), HSIP, SPR, NHTSA 402 and 405, or FMCSA funds. Some States also may have discretionary funds for planning activities that could be used for safety. For example, Arizona DOT administers the Planning Assistance for Rural Areas (PARA) programs, which funds multimodal planning studies, some of which have addressed safety issues and needs.
6.2 Using Safety Data and Analysis to Develop Goals and Objectives
The purpose of setting goals and objectives during the planning process is to identify the desired outcomes for the transportation system and how those outcomes can be achieved.
6.2.1 Qualitative Safety Goals
Safety Vision
Prior to establishing goals and objectives, many agencies will develop a long-term vision for the transportation system to guide programs, policies,
and projects. Some vision statements are transportation focused but incorporate elements of safety. Other agencies have developed safety-specific vision statements, such as Towards Zero Deaths (TZD). The Mid-America Regional Council has taken this latter approach.
Safety goals can be developed in a number of ways. A primary focus of Section 6.2.2 is to provide examples of data-driven goals, but it is clear that not all goal setting occurs in a quantitative manner. Qualitative goal setting can be just as effective because, at a minimum, it establishes safety as a priority during the planning process and sets the stage for the identification of data-driven objectives, performance measures and targets, and projects to help meet that safety goal. Types of qualitative goal setting include:
Example of Safety Goal Setting—Public and Stakeholder Input
During a committee meeting for the development of their Community Safety Transportation Plan, the City of Hamilton (Montana) asked committee members to discuss their safety goals. Input included increase education regarding texting and driving, address increased speed around schools, continue safe routes to school, and many more. From this input, the following safety goal was created: preserve and enhance the quality of life by improving transportation safety for all users.
- Safety Planning Factor: It is common for transportation agencies to reference the Federally required planning factors as their transportation goals. When it comes to safety, “increase the safety of the transportation system for motorized and nonmotorized users,” or something similar, can be utilized as the safety goal for a planning document.
- Public/Stakeholder Input: Another common approach is to identify transportation goals through committee, stakeholder, and/or public input. Information can be obtained either through surveys, comment cards, open houses, committee meetings, mapping tools, or other. This type of input can vary drastically depending on stakeholders or public participants, but presenting the same information to everyone and asking pointed questions can reduce the possibility of wide variations. Planners can utilize the information to inform a single or multiple goals. The goal could be safety specific or safety could be woven into other goals.
- Goals in Other Plans: Another qualitative approach to safety goal setting is to review and adopt applicable goals from other planning documents. Documents to review include the SHSP, HSP, Commercial Motor Vehicle Safety Plan, State and MPO LRTPs and Modal Plans, and Comprehensive Plans. Ideally, planners should have a sense, based on public/‌stakeholder input or preliminary analysis, as to what the key safety issues/needs are, so only relevant goals will be adopted.
6.2.2 Data-Driven Safety Goals
The results of data analysis identify general as well as specific safety issues and needs and can be used to develop transportation goals. The data used to develop safety goals can range from basic analysis, such as reviewing the results of crash frequency to more sophisticated analysis, like network screening to identify more specific goals.
Trend Analysis
SHSP Goals
MAP-21 requires that the transportation planning process must integrate directly or by reference, the goals, objectives, performance measures, and targets described in other State transportation plans, such as the SHSP.
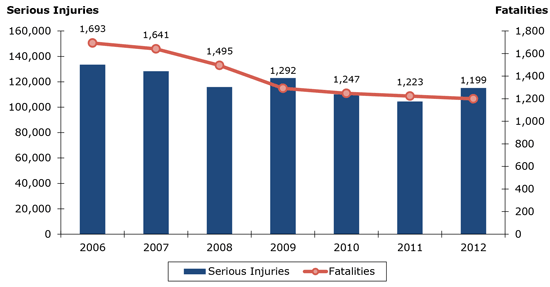
Many agencies use basic time trend analysis to understand how safety fatalities and serious injuries have changed over the years. Reviewing trends on an annual basis can encourage an agency to consider safety more prominently as a goal area. For instance, if safety trends demonstrate a high number of crashes or increases over time, safety should be recognized as a priority goal area over the long term. By looking at the trend data in figure 6.1, an agency could conclude that both serious injuries and fatalities are a concern based on the numbers and a safety goal would be appropriate to develop. How the goals are stated can vary, but based on this amount of data, agencies could likely develop a broad safety goal, such as: “Increase safety for all users by reducing transportation-related fatalities and serious injuries.”
Figure 6.1 Chart. Trends, Safety Goal Setting
Source: Sample data, Cambridge Systematics, Inc., 2015.
Contributing Factors
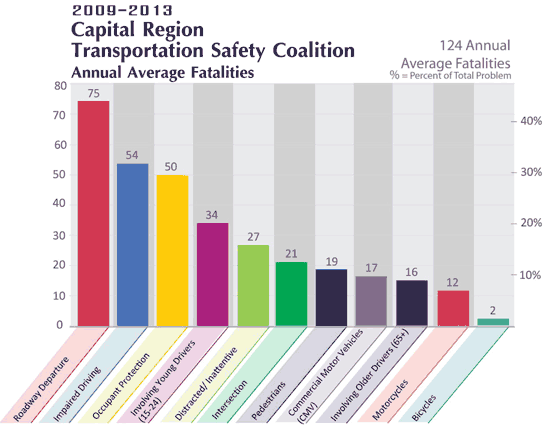
For every vehicle crash, there are numerous factors contributing to its severity. Many agencies will review and analyze the different elements (i.e., speeding, alcohol, unbelted) that played a role in the crash to draw conclusions regarding program and project investments. This information also can be used to establish safety goals. Figure 6.2 shows data reviewed by the Capital Region Safety Coalition in Louisiana during the development of a regional safety plan. Based on this data, the coalition decided to establish four safety-specific goals, which were:
- Reduce roadway departure fatalities;
- Reduce impaired driving fatalities;
- Reduced occupant protection-related fatalities; and
- Reduce young driver fatalities.
However, goal statements based on contributing factor data, can vary. For instance, an agency may still wish to draw broad safety goals based on this data. Different text options could be:
- Increase safety for all users by reducing transportation-related fatalities; or
- Improve safety by reducing the prevalence of infrastructure, impaired driving, occupant protection, and young driver-related fatalities.
Figure 6.2 Chart. Contributing Factors, Safety Goal Setting
Source: Louisiana Highway Safety Research Group, Capital Region Transportation Safety Coalition Level II Data.
Other Characteristics
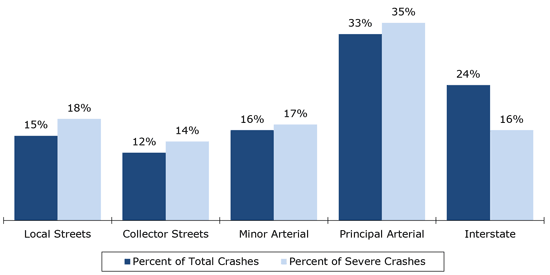
Agencies review crash data in a multitude of ways, more than can be presented in this section; however, other ways planners may look at data, which can be extrapolated into safety goals is by geography (rural and urban), mode of travel (single vehicle, commercial vehicle, motorcycle, etc.), or functional class. Figure 6.3 examines functional class, showing that a higher proportion of crashes are occurring on principal arterials. As a result, an agency may decide to create a specific safety goal, to focus on reducing severe crashes on principal arterials. The goal could read as: “Improve multimodal safety by reducing crashes on principal arterials throughout the State.” This same type of approach—reviewing data and developing goals—could be done when looking at data by geography and mode of travel.
Figure 6.3 Chart. Functional Class, Goal Setting
Source: Sample data, Cambridge Systematics, Inc., 2015.
Advanced Analysis
The results of more sophisticated analysis, such as network screening or systemic analysis also can provide useful information for goal setting. Network screening, for instance, provides planners with information on specific segments or intersections that have a safety record higher or lower than expected. Table 6.1 shows sample high-priority intersections for a region. Based on this data, a general safety goal could be developed to capture the entirety of the network screening process or a specific goal could be identified to consider intersection safety. Possible safety goals stemming from a network screening analysis include:
- General Goal: Increase safety for all users by reducing transportation-related fatalities and serious injuries at sites with the most potential for safety improvements; or
- Specific Goal: Improve safety by reducing fatalities and serious injuries at intersections.
| Final Rank | Intersection | Frequency Rank | Crash Rate Rank | EPDO Rank | Composite Rank |
|---|---|---|---|---|---|
| 1 | U.S. Highway 60 at Radanovich Boulevard | 4 | 3 | 2 | 9 |
| 2 | SR 87/Beeline Highway at Longhorn Road at U.S. Highway 260 | 1 | 1 | 9 | 11 |
| 3 | SR 260 Valley Road at Highline Drive | 4 | 5 | 12 | 21 |
| 3 | SR 87/Beeline Highway at Bonita Street | 10 | 4 | 7 | 21 |
| 5 | SR 188/Apache Trail at U.S. Highway 60 at Russell Road | 2 | 10 | 10 | 22 |
| 6 | U.S. Highway 60/Ash Street at Hill Street | 7 | 11 | 8 | 26 |
| 7 | U.S. Highway 60/Ash Street at Hill Street | 6 | 7 | 15 | 28 |
| 8 | U.S. Highway 60 at Escudilla Drive at Main Street | 3 | 2 | 24 | 29 |
| 9 | SR 347/John Wayne Parkway at Papago Road | 12 | 18 | 3 | 33 |
| 10 | SR 87/Beeline Highway at Main Street | 7 | 26 | 5 | 38 |
Source: Cambridge Systematics, Inc., unpublished, Central Arizona Governments.
Developing a safety goal or goals may not be entirely data-driven, but when possible, available safety analysis results, either qualitative or quantitative, can be used to inform this initial portion of the planning process.
6.2.3 Data-Driven Safety Objectives
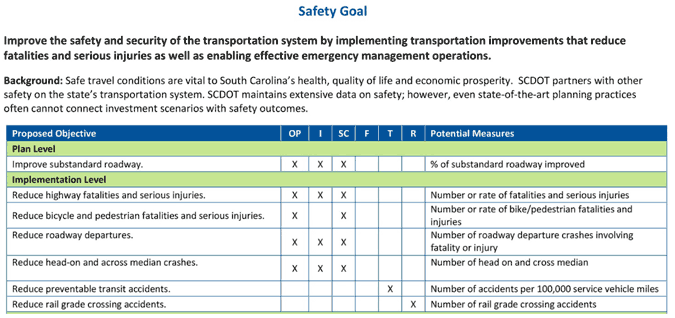
Regardless of the approach used to establish transportation safety goals, objectives are necessary to define how the goals will be met. Ultimately, objectives should provide enough specificity to help planners identify programs and projects that will meet the goals of the planning document. Although objectives can be identified in a qualitative fashion, such as through public/stakeholder input or adopted from other planning documents, elements of data analysis should still be included to ensure objectives are specific and measurable and progress towards the goals can be tracked. An example of this is found in the South Carolina Multimodal Transportation Plan shown in figure 6.4. The safety goal itself is general, but the objectives are descriptive and measurable to ensure the South Carolina DOT understands exactly how to achieve its safety goal.
Figure 6.4 Screenshot. Defining Safety Goals with Measurable and Specific Objectives
Source: South Carolina Department of Transportation 2040 Multimodal Transportation Plan, December 2014.
Public and Stakeholder Input
Objective Setting—
Public and Stakeholder Input
The Capital Region Transportation Safety Coalition in Louisiana utilized data to identify four safety goals. Based on this, stakeholders developed specific objectives to achieve the goals. Stakeholders were provided with a list of countermeasures that work and other proven strategies to assist them in the selection of data-driven objectives.
Public and stakeholder input can be used to set objectives, but as described in the goals section, this type of input has the potential to yield a number of different priorities. When relying on this information to develop objectives, it is important to share data results and priorities in advance to better shape the input public and stakeholders provide. For instance, if bicycle and pedestrian safety has been identified as an issue in your State or region, available crash data trends and information about potential treatments (i.e., Countermeasures that Work (CTW), or FHWA CMF Clearinghouse) should be shared with the public and stakeholders to guide the input. Doing this will increase the chances that objectives, and eventually strategies/actions, are developed based on data versus perceptions.
Customizing Objectives From Other Plans
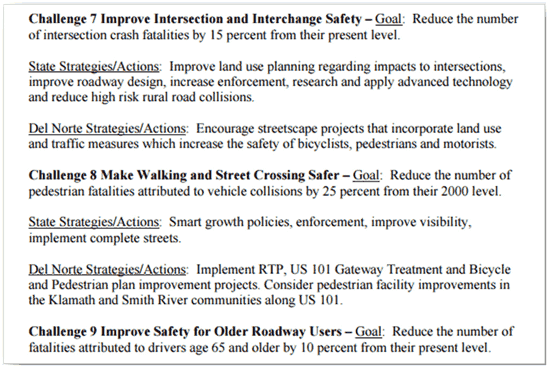
Transportation planning documents typically include specific objectives to achieve the goals of a plan. In developing or updating a plan, it is not always necessary to start from scratch, but instead review other objectives already developed in other plans, such as the SHSP. This approach to objective setting can be quantitative. For example, an RPO in California, the Del Norte Local Transportation Commission, identified the safety issues and needs for their region based on data and stakeholder input. Equipped with this knowledge, agency planners were better able to review and customize the goals and objectives outlined in the California SHSP and customize those to meet the needs in their own planning environment, as shown in figure 6.5. When reviewing the goals or objectives from other plans try to review statewide, regional, or local crash data first to have a better understanding of what objectives would be relevant to your transportation plan.
Figure 6.5 Screenshot. Adopting Objectives/Strategies from Other Planning Documents
Source: Del Norte Local Transportation Commission Regional Transportation Plan, June 2011.
Crash Analyses
The results of crash analyses also play a large role in objective setting. Data can assist with setting numeric or specific objectives, outlining how the safety goals will be achieved. For example, by reviewing rolling five-year average crash data trends, it is possible to identify: 1) a baseline for fatalities and serious injuries by modal or topic area (i.e., roadways, bicycle, freight, transit, intersections, segments, etc.); and 2) the extent to which fatalities and serious injuries are increasing or decreasing overall, or by specific mode or topic.
If the baseline data shows roadway crashes are an issue and the trend data shows that these crashes have been steadily increasing over the previous five years, safety goals and objectives may be:
Goal—Increase the safety of the transportation system for all users.
- Potential objectives:
- Reduce the total number of crashes on roadways in the State (or region); or
- Reduce the total number of crashes by five percent by 2020.
If the baseline data shows motorcycle crashes as an area of concern, goals and objectives may be:
- Potential goal:
- Increase the safety of the transportation system for all users; or
- Improve motorcycle safety throughout the transportation network.
- Potential objectives:
- Reduce motorcycle fatalities and serious injuries in the State (or region); or
- Reduce the number of motorcycle fatalities and serious injuries by five percent by 2030.
If additional data is available beyond the basic trend information, it is possible to specify objectives even further. For example, if the majority of crashes are known to take place on major arterials or are the result of people running off the road, more specific objectives could be:
- Identify systemic, low-cost countermeasures to implement to reduce roadway departure fatalities and serious injuries; and
- Identify the major arterials with high-crash severity indices to determine the need for road safety assessments and safety improvements.
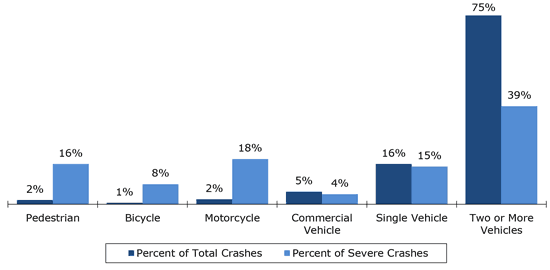
The results of other analyses, besides trend analysis, also can help shape safety objectives. Figure 6.6 shows the results of a systemic analysis (total crashes are shown in the left bar and severe crashes are shown in the right bar). This data tells planners that pedestrian, bicycle, and motorcycle crashes are substantially overrepresented among severe crashes.
Figure 6.6 Chart. Using the Results of Analysis to Inform Objectives
Source: Sample data, Cambridge Systematics, Inc., 2015.
Equipped with this information, safety goals and objectives may be:
Goal—Reduce fatalities and serious injuries on the transportation system for all users.
- Objective: Reduce bicycle crashes.
- Strategies:
- Identify low-cost bicycle safety improvements for local roads;
- Promote bicycle public education campaigns, including the shared use of roadways; and
- Facilitate coordination among jurisdictions and business to address missing bicycle links.
Another option may be:
Goal—Reduce bicycle crashes.
- Objective:
- Reduce the number of crashes involving bicyclists by five percent; or
- Implement 5 to 10 percent of the safety projects in the bicycle plan.
The development of data-driven objectives provides planners with specific information for how they can accomplish their safety goal.
6.3 Using Safety Data and Analysis to Develop Performance Measures and Targets
The purpose of setting performance measures and targets during the planning process is to have a means to track and evaluate progress towards transportation goals and objectives. If targets are not being met, it provides planners the opportunity to reevaluate programs and projects to identify how to invest differently.
6.3.1 Performance Measures
Performance measures are a useful tool to understand programmatic progress towards transportation goals. Every DOT and MPO will eventually need to adopt the national performance measures, which include number and rate of fatalities and serious injuries. These measures will help transportation agencies track progress towards their safety goal(s). Table 6.2 depicts an example of what this could look like in practice.
| Goal | Objective | Performance Measure | Data |
|---|---|---|---|
| Achieve a significant reduction in traffic fatalities and serious injuries on all public roads | Reduce fatalities | Number of fatalities per year | FARS |
| Achieve a significant reduction in traffic fatalities and serious injuries on all public roads | Reduce serious injuries | Number of injuries per year | State Data |
| Achieve a significant reduction in traffic fatalities and serious injuries on all public roads | Reduce fatality rates | Fatality rate 100 million VMT | FARS, HPMS |
| Achieve a significant reduction in traffic fatalities and serious injuries on all public roads | Reduce serious injury rates | Serious injury rate 100 million VMT | State Data, HPMS |
Source: Sample text, Cambridge Systematics, Inc., 2015.
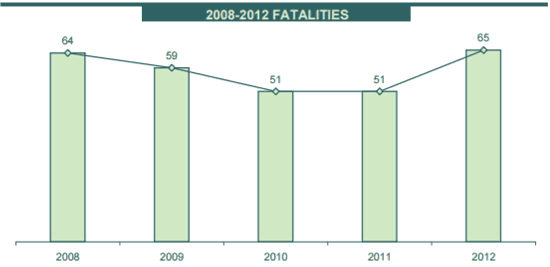
To track performance measures on a regular basis, agencies will utilize annual or average data (combining a certain number of years of data into an average for a single year) from FARS or the State crash database. An example of annual performance tracking is shown in figures 6.7 and 6.8 from the Lehigh Valley Planning Commission in Pennsylvania.
Figure 6.7 Chart. Tracking National Performance Measures, Fatalities, 2008-2012
Source: Lehigh Valley Planning Commission Traffic Safety Plan for the Lehigh Valley 2008 to 2012.
Figure 6.8 Chart. Tracking National Performance Measures, Major Injuries, 2008-2012
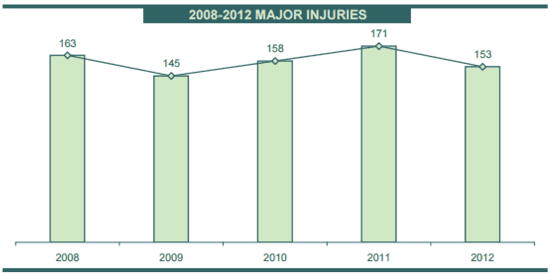
Source: Lehigh Valley Planning Commission Traffic Safety Plan for the Lehigh Valley 2008 to 2012.
Other agencies may want to set performance measures beyond what is nationally required. To identify other performance measures, the first step is to review the goals and objectives in a transportation plan and identify which performance measures will accurately track their progress. If goals and objectives were developed based on data, data also should be available to track performance. Table 6.3 provides an example of the direct relationship between goals, objectives, performance measures, and data.
| Goal | Objective | Performance Measure | Data Sources |
|---|---|---|---|
| Increase the safety of the transportation system for all users | Reduce roadway fatalities | Number of roadway fatalities per year | FARS |
| Increase the safety of the transportation system for all users | Reduce bicycle crashes | Number of bicycle crashes per year | Local law enforcement crash database |
| Increase the safety of the transportation system for all users | Reduce transit crashes | Number of preventable transit crashes per 100,000 miles | National Transit Database |
Source: Sample text, Cambridge Systematics, Inc., 2015.
6.3.2 Performance Targets
Performance targets are numeric and describe the extent to which an agency will address its performance measures, taking into account resources and funding. They should be developed in relationship to the goals, objectives, and performance measures. Whereas performance measures are a tool to help planners and communities assess progress towards goals and objectives, targets specify what your agency would like to achieve in those goal/objective areas. Table 6.4, from the RTC of Washoe County in Nevada, illustrates an example of the connectivity between goals, measures, and targets.
| Transportation Plan Goal | Annual Performance Measure | Target |
|---|---|---|
| Improve Safety | Preventable transit accidents per 100,000 miles of service | 0 |
| Improve Safety | Number of crashes and number of crashes per VMT | Reduce by 50% by 2020 |
| Improve Safety | Number of serious injuries per VMT | Reduce by 50% by 2020 |
| Improve Safety | Number of fatalities and fatalities per VMT | 0; Reduce by 50% by 2020 |
| Improve Safety | Miles of bicycle lane added and percent of Bicycle Pedestrian Master Plan completed | 3% to 7% of plan implemented per year |
| Improve Safety | Miles of sidewalk added or enhanced and percent of the Americans with Disabilities Act (ADA) Transition Plan completed | 3% to 7% of plan implemented per year |
Source: RTC of Washoe County Annual Report, 2013.
Target Setting Resource
Further information on the state of the practice in safety target setting as well as ideas for developing or updating transportation safety targets, can be found in the FHWA Safety Target Setting Final Report.
Some DOTs and MPOs have begun setting targets for the national performance measures (number and rate of fatalities and serious injuries) and other measures, as interested (as shown in the RTC example). Although a number of different target-setting approaches have been identified, at the core, is data and analysis. One of the primary data-driven ways to set targets is through trend analysis. Using this approach, multiple years of data can be reviewed to establish a baseline, and then targets can be set based on:
- Previous annual or average trend reductions (staying the course); and
- A prediction based on the expected safety benefits of programs and projects (this would entail an understanding of the crash reduction factors associated with types of transportation projects and the extent to which they would be implemented.)
Table 6.5 demonstrates how data is identified and trends are analyzed to set safety performance targets.
| Goal | Performance Measure | Baseline | Target | Data Source |
|---|---|---|---|---|
| Increase the safety and security of the transportation system for motorized and nonmotorized users | Decrease five-year average fatalities | 125 (2007 to 2011) | Decrease fatalities by 5% by 2020 | FARS |
| Increase the safety and security of the transportation system for motorized and nonmotorized users | Decrease five-year average serious injury crashes | 243 (2007 to 2011) | Decrease serious injury crashes by 8% by 2020 | State DOT database |
| Increase the safety and security of the transportation system for motorized and nonmotorized users | Decrease five-year average pedestrian and bicycle crash-related injuries | 36 (2007 to 2011) | Decrease pedestrian and bicycle crash-related injuries by 3% by 2020 | Local law enforcement crash data |
Source: Sample text, Cambridge Systematics, Inc., 2015.
Table 6.6 and figure 6.9 demonstrate another example of how trend data can be utilized to establish data-driven safety targets for identified goals and objectives. The recommended target is to reduce fatalities by five percent by 2020, but the graphic demonstrates the range of target options based on previous years trends.
| Goal | Objective | Performance Measure | Performance Target | Data Source |
|---|---|---|---|---|
| Improve safety | Reduce impaired driving fatalities | Number of impaired driving fatalities | Reduce impaired driving fatalities by 5% by 2020 based on five-year averages. | State DOT database |
Source: Sample data, Cambridge Systematics, Inc., 2015.
Figure 6.9 Chart. Data-Driven Performance Targets Related to Safety Goal
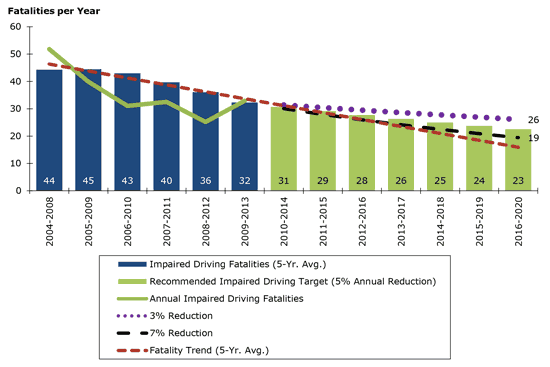
Source: Sample data, Cambridge Systematics, Inc., 2015.
6.3.3 Evaluating System Performance
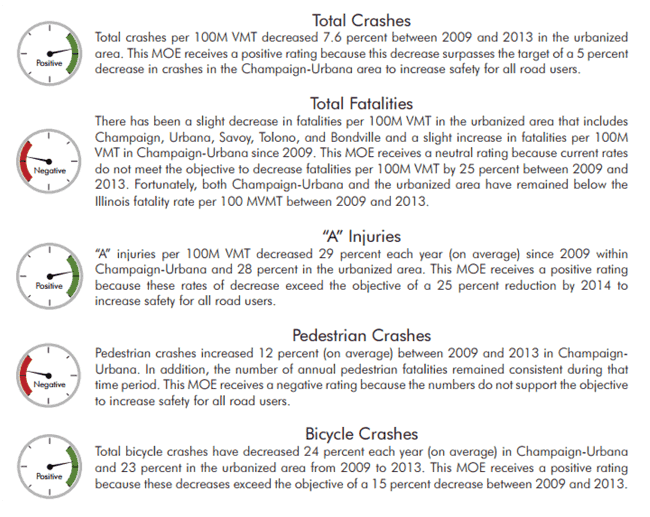
With limited resources, safety performance measures and targets help planners identify the extent to which safety goals and objectives are being met. Monitoring crash trends and targets over time will demonstrate whether crash numbers have increased or decreased. An increase would trigger a review of goals and objectives to determine where future funding could better be utilized to improve performance. Decreases would suggest that safety goals and objectives are working and would help determine whether to maintain future funding levels or direct resources to other safety issues. To evaluate performance, agencies may produce an annual report, report card, or utilize performance tracking information. For example, the Nevada DOT publishes a Performance Management Report on an annual basis. A portion of the 2014 Report focuses on the goal of reducing crashes, discussing current and future performance, what strategies have been initiated and worked to reduce crashes, those that have not been successful, and future strategies that have the potential to lower crash numbers. This annual evaluation process allows the Nevada DOT to review progress towards performance goals and targets to re-evaluate programmatic investments. The Champaign Urbana Urbanized Area Transportation Study, an MPO in Illinois, produces an annual LRTP Report Card, which details the progress made on the goals and objectives in the document. Figure 6.10 demonstrates tracking dials, which provide a quick snapshot of system-level performance. This information is used by the MPO to adjust performance information, if necessary and revisit objectives and strategies for meeting safety goals.
Figure 6.10 Graphic. Example Evaluation Report Card
6.4 Using Safety Data and Analysis for Project Prioritization and Programming
Tying together goals, objectives, performance measures and targets, are transportation and safety projects and programs. With limited resources, programs and projects should be identified, evaluated, and prioritized based on whether or not they address (or have the likelihood to address) the goals in the plan and the extent to which they contribute to meeting performance targets. Over time, it is possible to see the effect programs and projects have on the goals of the plan. These should be reevaluated regularly to ensure they are consistent with project and program outcomes. Figure 6.11 shows the relationship between the already discussed planning tasks and programs/projects.
Figure 6.11 Flowchart. Relationship between Data-Driven Planning Tasks and Programs/Projects
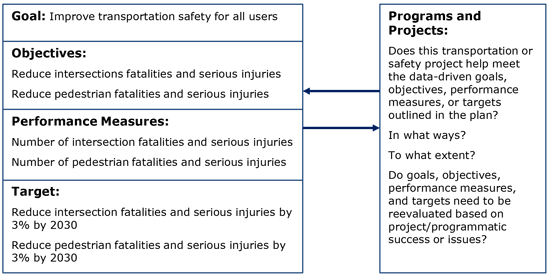
Source: Cambridge Systematics, Inc.
To get to this point in the planning process, data have been utilized to pinpoint the key goals, objectives, and a reliable means to measure success. Now, it is time to decide how programs and projects can contribute solutions to the identified issues. There are two opportunities to do this—one is to incorporate safety evaluation criteria into the scoring approach for all transportation projects; and the other is to identify safety projects (i.e., crash reduction factors, countermeasures).
6.4.1 Transportation Projects Integrating Safety
Safety Index
Utah DOT has a safety index on State routes, including a mapping tool, which represents the degree of risk to the driver, in terms of both crash rate and severity. This tool has been used during corridor and other planning efforts to evaluate how to meet transportation safety goals and targets.
Many common evaluation criteria for transportation projects, such as mobility, congestion, and air quality, can be generated by travel demand model results. A common challenge for safety is the difficulty in predicting how transportation projects will influence safety over the medium and long term. The HSM is a tool that can assist planners identify and assess safety benefits for specific projects, which is summarized here, but described in detail in Section 5.6. However, basic data analysis also can be used to identify the safety benefits for transportation projects, helping to meet the goals outlined in the plan.
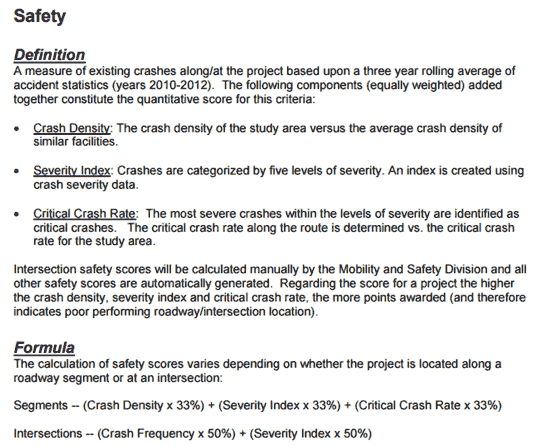
A range of data can be used during the transportation project prioritization process to help determine the safety benefits of a project. For instance, some States, including Utah, use a severity index to rank segments or intersections, determining where on the transportation system the safety issues lie. Planners then use this information when evaluating and prioritizing their transportation projects. If a potential transportation improvement is in a location with a high safety index or a comparable area, the opportunity exists to consider safety improvements within the context of the transportation project. As such, the project would score higher because, in addition to meeting other transportation goals, it also presents the opportunity to lower fatalities and serious injuries. Some States combine severity with other factors, use high-crash location lists, the results of network screening, or systemic analysis to consider how to incorporate safety considerations in the context of all their transportation projects. Figure 6.12 depicts the safety project prioritization criteria for highway and State bridge projects in the North Jersey Transportation Planning Agency metropolitan region. Figure 6.13 shows how the North Carolina DOT evaluates safety criteria for capacity projects to determine the need for future safety improvements with project limits.
Figure 6.12 Screenshot. Incorporating Safety into Project Prioritization
Source: NJTPA Project Prioritization Criteria, January 2007.
Figure 6.13 Screenshot. Incorporating Safety into Project Prioritization
Source: North Carolina DOT Strategic Prioritization Process.
Additional Prioritization Approaches
Examples from other agencies that incorporate safety criteria into their prioritization process to help meet the safety goals and objectives in their planning documents include: Erie County, Harrisburg Area Transportation Study, Indian Nations Council of Governments, and Centre County MPO.
Another example of using safety analysis during transportation project prioritization comes from the Virginia DOT. Legislation requires Virginia DOT to develop and implement a quantifiable prioritization process for their transportation projects. Safety evaluation criterion is considered very highly in the scoring process for transportation projects. Each project must demonstrate the expected reductions in fatalities and serious injuries and rate. This is calculated by summing the annual number of crashes where a project is located, and multiplying it by the expected crash modification factor (this will be based on FHWA and Virginia-specific CMF). This type of prioritization attempts to identify appropriate safety improvements in correlation with the project prioritization instead of waiting until the scoping or design phase to officially address any potential safety improvements.
In Louisiana, the DOTD and all the MPOs must complete a Stage 0 Preliminary Scope and Budget Checklist for highway projects. To advance to Stage 1, Planning and Environmental, a number of criteria must be identified and addressed, including the results of any safety analyses performed and whether abnormal crash locations or overrepresented crash types exist within the project limits. This early review of projects ensures safety issues are captured and can be factored into project planning and design.
States also are starting to use the HSM during corridor planning and alternatives analysis to predict the safety performance of a roadway or intersection project based on physical characteristics. Part C of the HSM allows planners to quantify the safety effects of alternatives and compare those with other project criteria, such as capacity, delay, community needs, and others.
6.4.2 Safety Projects
Chapter 5.0 outlines the range of analysis options that can be undertaken to identify safety programs and projects. However, these programs and projects should be identified based on how well they meet the safety goals, objectives, performance measures, and targets identified earlier in the planning process.
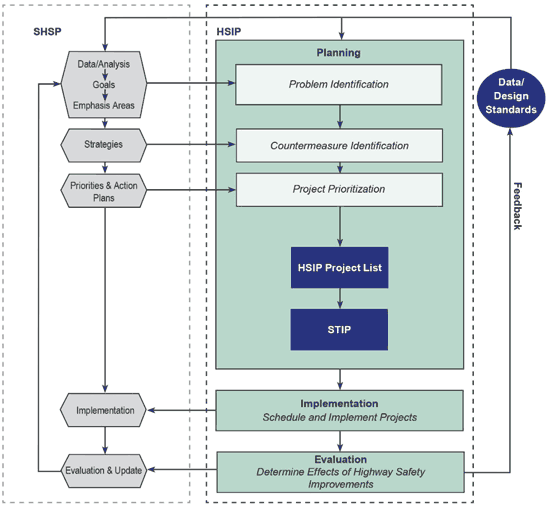
The SHSP planning process and HSIP prioritization process provide a good example of this linkage. At the statewide level, significant reductions in traffic fatalities and serious injuries on public roads are meant to be accomplished through the development and implementation of the SHSP. The SHSP, a strategic document, outlines a framework for addressing safety using goals, emphasis areas, and strategies. However, it does not typically identify safety projects. Instead, additional analysis is conducted within the context of the SHSP goal and emphasis areas to drive the States’ HSIP investment decisions. Figure 6.14 describes the relationship between the SHSP and HSIP process. A number of States also have developed HSIP project prioritization manuals to ensure planners understand how to identify safety projects—one such example is from the Ohio DOT.
Figure 6.14 Flowchart. Relationship between the SHSP and HSIP
Source: FHWA Highway Safety Improvement Program Manual, January 2010.
This same approach also can work to identify and prioritize safety projects during the transportation planning process. Similar to the SHSP, the LRTP outlines strategic goals, objectives, and policies, which are used to guide decisionmaking for transportation investments. From here, additional analysis is typically needed to identify transportation safety programs and projects that support this framework. The following example from the Lee County MPO demonstrates the link between strategic transportation safety goals and objectives with the identification and development of safety programs/projects:
- LRTP Goals: For the 2035 Collier and Lee County LRTP update, planners identified the following safety goal: A transportation system that is safe and secure for existing and future residents, visitors, and businesses.
- LRTP Objectives: To support this goal, a number of objectives were developed, but two of particular note are: Safety planning shall be consistent with and reflect the goals and objectives of the State’s SHSP; and Reduce crash rates that involve conflicts among different modes of transportation through engineering and public education (autos, trucks, buses, trains, motorcycles, pedestrians and bicyclists).
- From here, the question became how can safety in the region be enhanced and programs/‌projects identified to make progress towards these established goal and objectives? This is where additional plans or studies can be used to analyze data further, identify potential countermeasures, and prioritize and select projects. The Lee County MPO took this approach during the development of a Bicycle and Pedestrian Safety Action Plan. The Plan was initiated to further explore and support the bicycle and pedestrian safety goals outlined in the Florida SHSP and the Lee County LRTP.
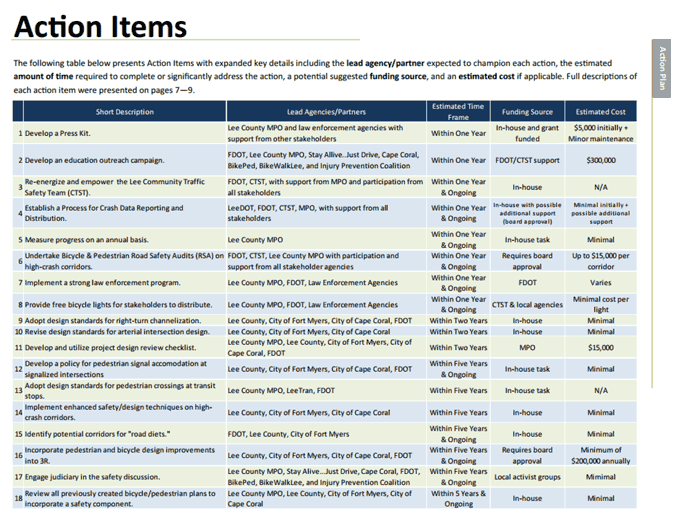
- Using crash data sources from the Florida Department of Highway Safety and Motor Vehicles as well as the FDOT Crash Analysis Reporting System, Lee County was able to identify a specific set of actions (figure 6.15), which included programs and projects, to support the overarching bicycle and pedestrian goals for the region.
Figure 6.15 Graphic. Data-Driven Safety Actions
Source: Lee County Bicycle and Pedestrian Safety Action Plan, September 2013.
FHWA Highway Safety Improvement Program Manual
Describes the relationship between the SHSP and HSIP and presents the HSIP’s four basic steps—analyze data, identify potential countermeasures, prioritize and select projects, and determine effectiveness.
Departments of Transportation and some MPOs and other agencies use a similar approach to meet SHSP or LRTP goals, but do so by specifically identifying projects for HSIP funding. For example, the North Central Pennsylvania Regional Planning and Development Commission developed a goal in their LRTP to increase safety for roadway users, especially on their Core System Roadways. To implement this goal, they developed the North Central Regional Safety Study, which utilizes a data-driven approach to identify and prioritize safety projects throughout the region. The analysis included a combination of data from PennDOT, including, but not limited to, high-crash locations, crash clusters, and public input. This was used to identify locations, investigate the safety issues further at those locations, and eventually identify countermeasures to implement. From there, they prioritized locations based on a cost-benefit analysis and came up with a list of 45 safety improvements. Many of the priority projects were then included in the TIP for funding.
Another example where data and analysis are being used to identify safety countermeasures for HSIP funding is the South Jersey Transportation Planning Organization (SJTPO). The MPO administers a Local Safety Program, consisting of a five-step data-driven process. SJTPO shares the results of network screening and systemic analyses with local jurisdictions to identify priority locations. Once locations are identified, road safety audits are conducted to better understand the problems and possible solutions. Based on the results of the audits, safety countermeasures are identified and a benefit costs analysis is run to understand the effectiveness of each improvement. As a last step, a technical committee reviews the projects. This process of data review; data analysis; and safety program/project (countermeasure) selection can be utilized by any agency wishing to identify transportation safety projects.
6.4.3 Evaluating Projects
With limited resources, programs and projects should be evaluated to identify if they address the goals in the plan and the extent to which they contribute to lowering fatalities and serious injuries. Options to better understand the contribution of a program or project to lowering fatalities and serious injuries is conducting before and after studies and employing proven countermeasures or crash modification factors whenever possible.
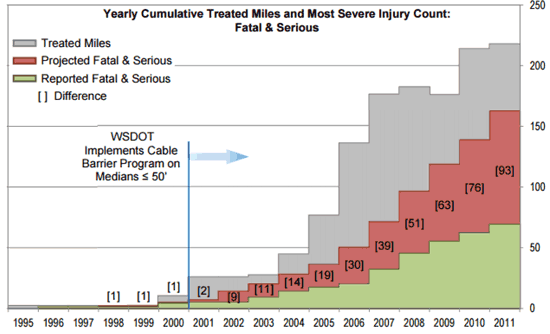
Before and after studies provide planners with information on the extent to which investment decisions are meeting expectations. For safety improvements, planners would expect to understand how well individual projects or programs of projects, such as systemic improvements, are performing to lower fatalities and serious injuries. If positive changes are not being seen, planner can refocus investments to other options. As an example, Washington DOT has studied and evaluated its cable median barrier program since 2007 to understand the effects of the program and how significantly it improves safety. In addition to reviewing the program systemwide, they also monitor and evaluate installations for specific locations. As a result of the ongoing before and after evaluation, Washington DOT has identified value in the cable median barrier program and plans to continue implementing it to save lives (figure 6.16).
Figure 6.16 Chart. Before and After Studies
Source: Cable Median Barrier Program in Washington State, June 2013.
In addition to before and after studies, proven safety countermeasures can be considered an evaluation tool. When implemented appropriately, countermeasures increase the chances of lowering fatalities and serious injuries. For example, in Florida, the implementation of longitudinal rumble strips and stripes in the center of two-lane urban roads has reduced head on collisions by 64 percent. Tracking the results of implemented countermeasures in a State or region and then sharing the results can increase the use of certain types of safety projects, yielding positive evaluation results. Resources for countermeasure selection include Countermeasures That Work, PEDBIKESAFE, FHWA Proven Countermeasures, and the CMF Clearinghouse. Some States, like Oregon, have identified State-specific countermeasures.


