U.S. Department of Transportation
Federal Highway Administration
1200 New Jersey Avenue, SE
Washington, DC 20590
202-366-4000
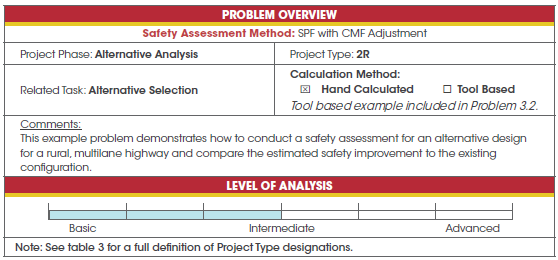
This example demonstrates hand calculations for Problem 3.2 and Alternative #1. The full problem in Chapter 3 includes two alternative options. For this assessment, the analyst can use the SPF with CMF Adjustment method. This will provide the number of predicted crashes (estimated for a type of facility). The SPFs can be locally derived or the analyst can use the Highway Safety Manual (HSM) equations. If the analyst uses the safety performance functions (SPF) from the HSM, they should be calibrated for local conditions where possible. To perform a relative comparison between two options for the same location, this procedure can be used and a calibration value of 1.0 assumed. This hand-calculated example uses the rural undivided multilane predictive procedures located in Chapter 11 of the HSM.
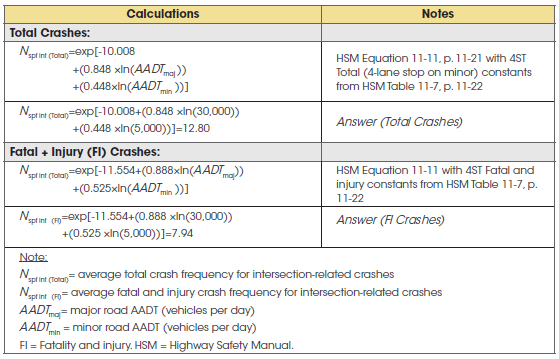
STEP 1: Calculate the predicted average total crash frequency and fatal and injury frequency for the intersection and major road segment base conditions (NSPF).
From the HSM, use the SPF equation for intersection-related crashes at undivided rural multi-lane highways to calculate the average intersection total crash frequency. This base condition SPF applies to the existing configuration as well as the alternative.
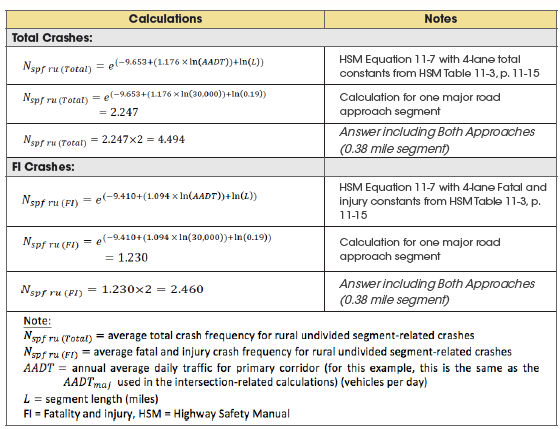
The HSM equation for undivided roadway segments can be used to calculate the average segment crash frequency. This SPF applies to the existing design as well as the alternative intersection configuration. Recall that each approach segment is 0.19 miles for a total study length of 0.38 miles.
STEP 2: Calculate the predicted average crash frequency for the segment and intersection unique design conditions (Npredicted).
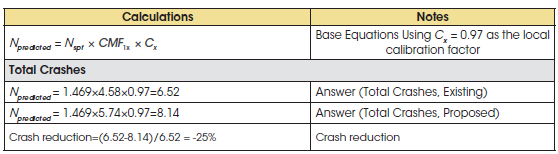
The predicted average crash frequency (Npredicted) for each option can be calculated using the following equation (HSM Equation 11-1, p. 11-2):
Npredicted = Nspf × (CMF1x × CMF2x ×...× CMFyx ) × Cx
Where: CMF = crash modification factor/function and C = calibration factor for SPF
[Notice that any countermeasure that matches base conditions will have a CMF value of 1.0 and does not change the value of Npredicted.]
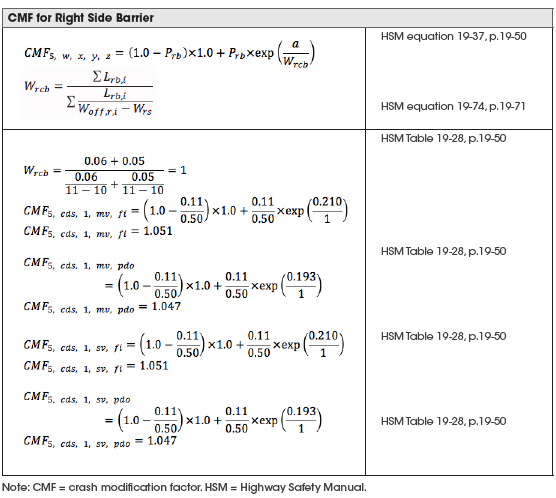
The intersection-related CMFs that do not match base conditions are next included in the calculations. For this example, a calibration factor of 1.0 is assumed (assuming the HSM predictive equations are representative of local conditions). The required CMFs are:
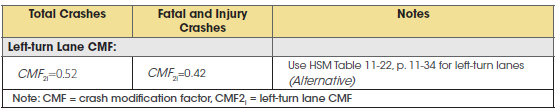
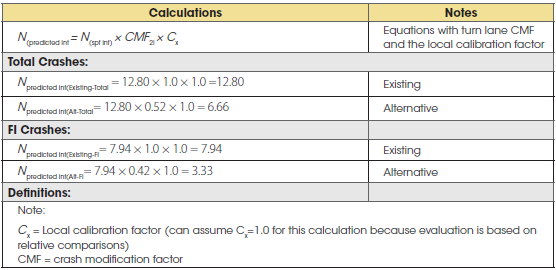
The predicted number of intersection-related crashes is then calculated by multiplying the CMFs and the calibration factor times the appropriate Nspf int value.
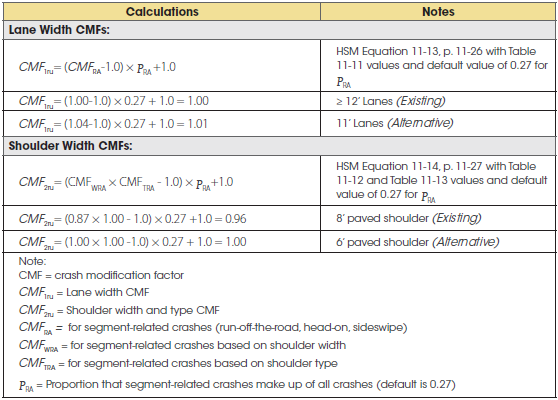
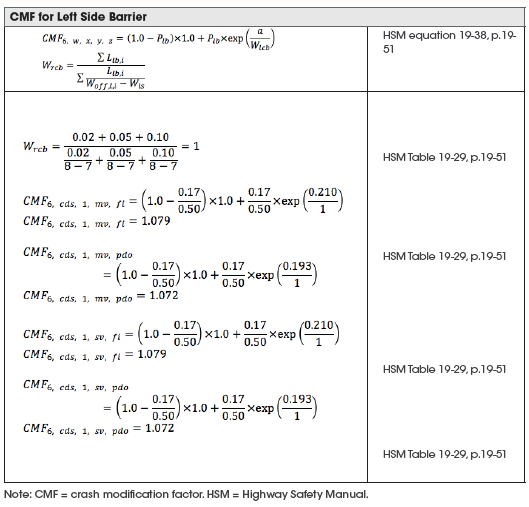
The segment-related CMFs that do not match base conditions are next included in the calculations. These are the required CMFs:
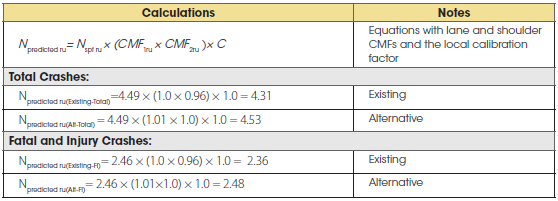
The predicted number of segment-related crashes is then calculated by multiplying the CMFs and the calibration factor times the appropriate Nspf ru value.
STEP 3: Add the intersection and segment crashes per year to calculate the total and FI predicted crashes (N(predicted (Total)) and (N(predicted (FI)).
| Alternative | Total Crashes per Year | Fatal and Injury Crashes per Year | ||||
|---|---|---|---|---|---|---|
| Intersection Crashes | Segment Crashes | Predicted Crashes | Intersection Crashes | Segment Crashes | Predicted Crashes | |
| Existing | 12.8 | 4.31 | 17.11 (say 18) |
7.94 | 2.36 | 10.30 (say 11) |
| Alternative #1 | 6.66 | 4.53 | 11.19 (say 12) |
3.33 | 2.48 | 5.81 (say 6) |
| Difference | 6.14 | -0.22 | 5.92 (say 6) |
4.61 | -0.12 | 4.49 (say 5) |
| Percent Reduction | 48.0% | -5.1% | 34.60% (say 34%) |
58.1% | -5.1% | 43.6% (say 43%) |
Manual calculations are shown only for total crashes. Calculations for fatal and injury (FI) and property damage only (PDO) crashes are calculated in a similar manner. The hand calculations include rounded values. The self-calculating spreadsheets do not truncate the numbers and so rounding errors are not included. Consequently, the hand calculated results may have minor differences than the spreadsheet calculated values.
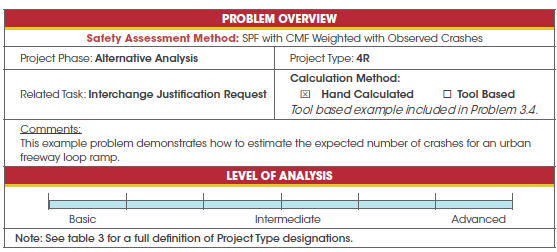
This example demonstrates hand calculations for Problem 3.4. The full problem in Chapter 3 includes calculations that demonstrate the use of the free ISATe self-calculating "Smart Spreadsheet." For this assessment, the analyst can use the SPF with CMF Weighted with Observed Crashes method. This assessment is for a specific location with a known crash history, so the expected number of crashes can be calculated. Because the ramp's cross-sectional characteristics are consistent along its entire length, the ramp can be modeled as one segment.
The following steps summarize the process for performing hand calculations to evaluate the expected crashes.
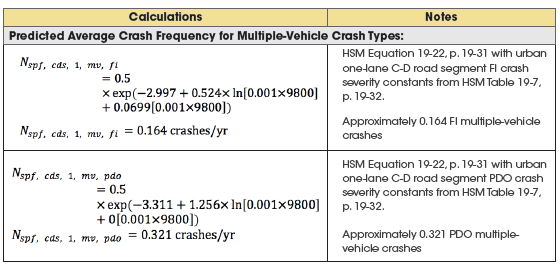
STEP 1: Calculate the predicted average crash frequency, Nspf.
The HSM equations for multiple-vehicle FI and PDO crashes at freeway ramps are summarized as follows:
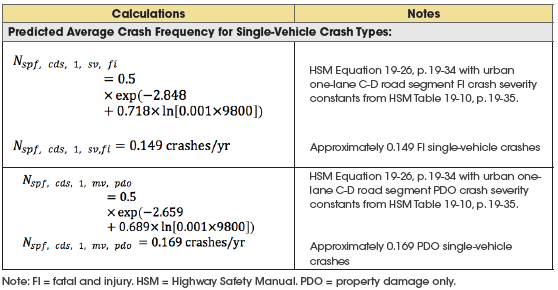
The HSM equations for single-vehicle FI and PDO crashes at freeway ramps are summarized as follows:
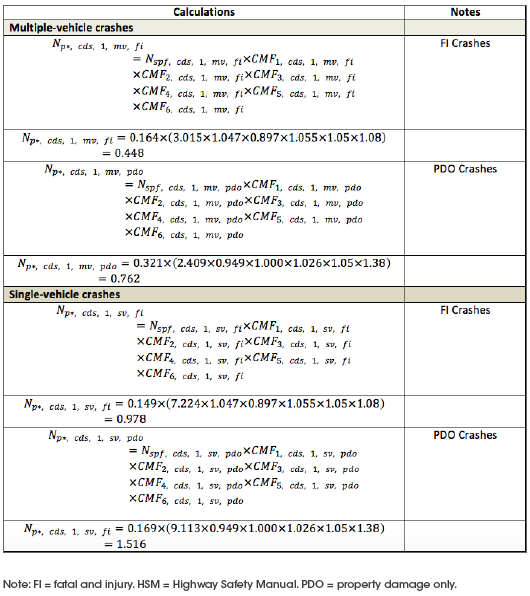
STEP 2: Apply the appropriate CMFs and calculate the predicted average crash frequency (Npredicted)
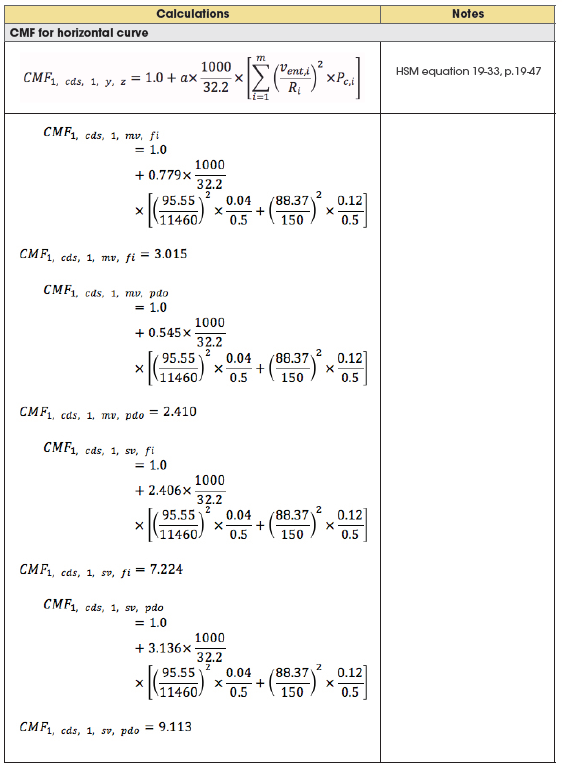
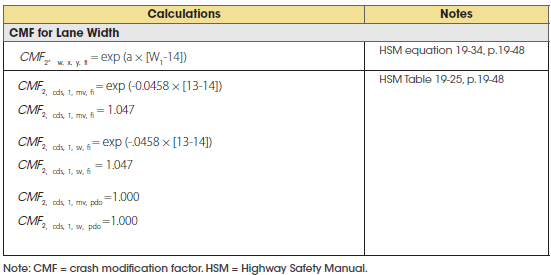
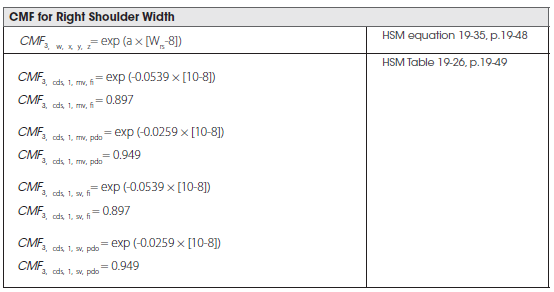
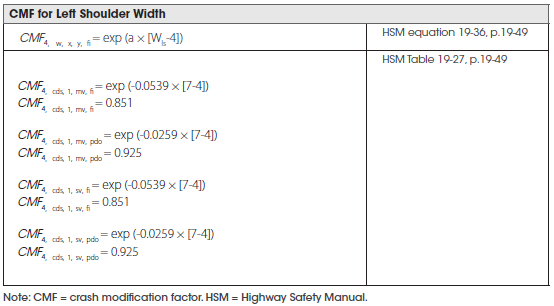
Calculate CMF values for any conditions that differ from the base conditions.
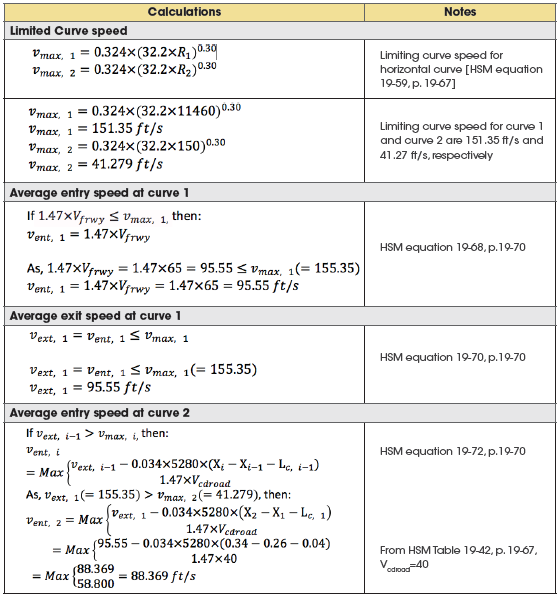
The horizontal curve CMF requires an average entry speed (vent,i), the radius for the entry curve (Ri), the proportion of the segment length with the curve (Pc,i), and the number of horizontal curves in the segment (m). To calculate this CMF value, the limited curve speed (curve with the sharpest radius) must first be identified.
STEP 3: Calculate the predicted average crash frequency for the segment under unique design conditions (Npredicted)
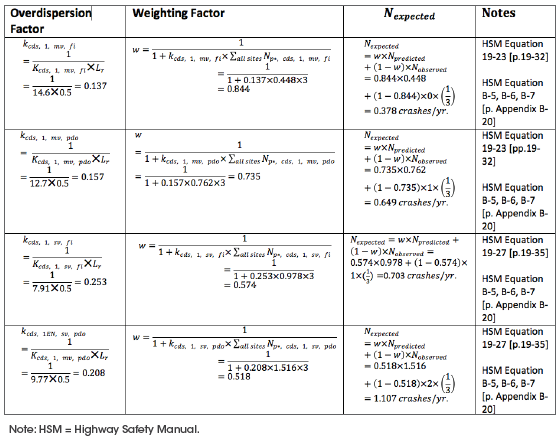
STEP 4: Calculate the expected crashes.
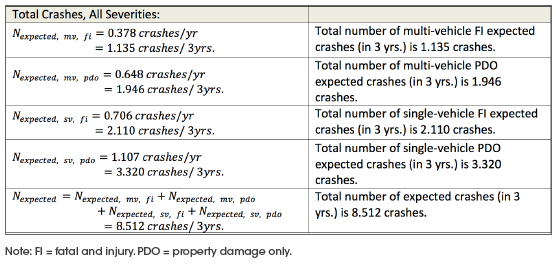
The next step is to evaluate the expected number of total crashes.
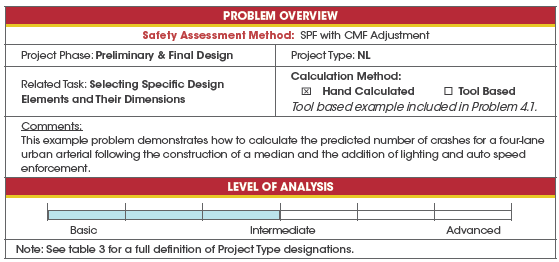
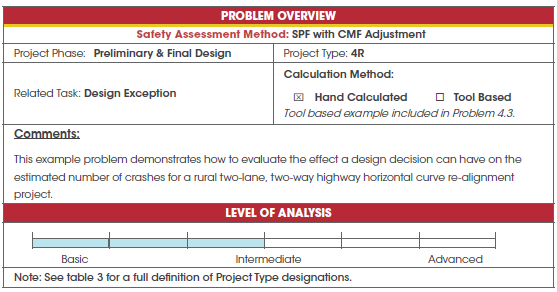
The urban multilane predictive method is located in Chapter 12 of the HSM. The following steps summarize the manual calculation for the proposed configurations as described in Problem 4.1.
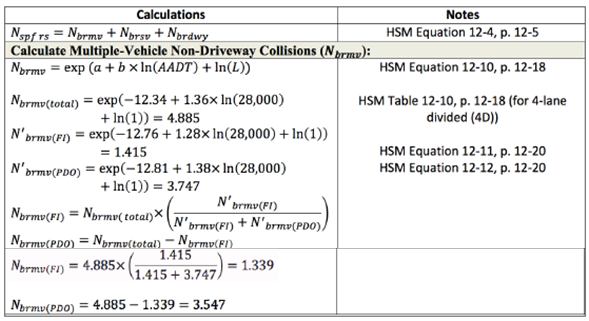
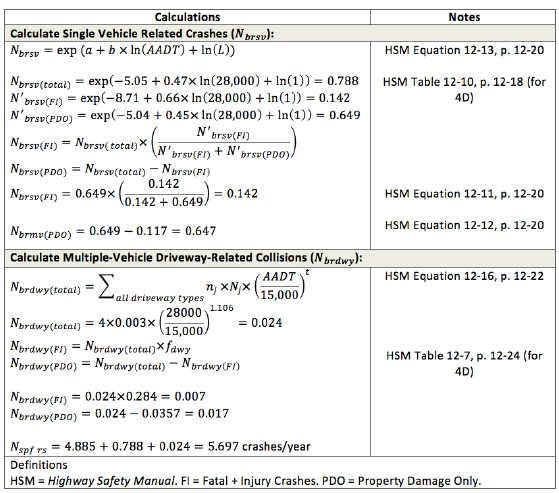
STEP 1: Calculate the predicted average crash frequency and fatal and injury frequency for the proposed road segment.
Use the SPF equation in the HSM for segment-related crashes at divided urban multi-lane arterials to calculate crash frequency:
STEP 2: Calculate the Crash Modification Factors:
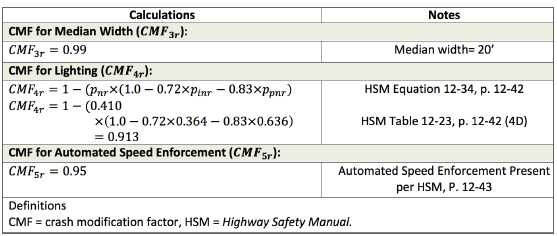
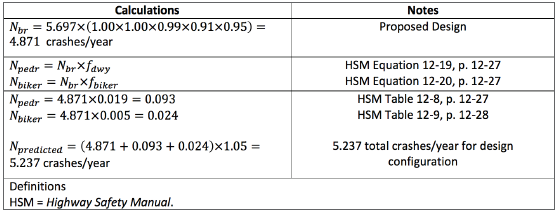
STEP 3: Calculate the predicted average crash frequency for the design conditions (Npredicted).
The predicted average crash frequency (Npredicted) can be calculated using the following equations:
Nbr = Nspf × (CMF1r × CMF2r × CMF3r × CMF4r × CMF5r )
Npredicted = (Nbr + Npedr + Nbiker) × Cr
Manual calculations are shown only for total crashes. Calculations for FI and PDO crashes are calculated in a similar manner. The hand calculations include rounded values. The self-calculating spreadsheets do not truncate the numbers and so rounding errors are not included. Consequently, the hand calculated results may have minor differences than the spreadsheet calculated values.
The predictive methods for rural two-lane highways and curved roadway segments are located in Chapter 10 of the HSM. The following steps summarize the process for performing hand calculations to evaluate safety treatments that can be included in the preliminary or final design phases.
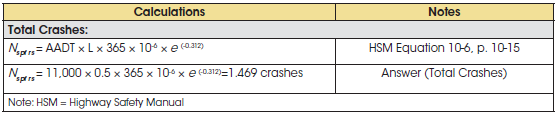
STEP 1: Calculate the average crash frequency for the rural two-lane road segments considering base conditions (NSPF). This value represents the number of crashes for any rural two-lane highway with a similar traffic volume and only base conditions.
Use the SPF equation from the HSM for rural two-lane undivided roadway segments to calculate the average segment crash frequency:
STEP 2: Calculate predicted average crash frequency for the segment under unique design conditions (Npredicted). This value represents the number of crashes for any rural two-lane highway with a similar traffic volume and similar geometric characteristics.
To calculate the estimated CMF due to decreasing the curve radii, the designer must first estimate the CMF of installing a curve compared to a base condition of a straight section of road.
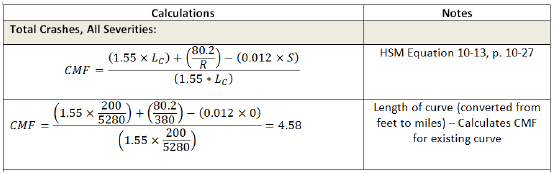
Next calculate the CMF for the new curve using the same method.
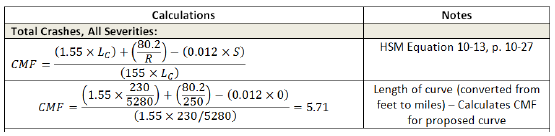
The predicted average crash frequency (Npredicted) can then be calculated using the following equation: