U.S. Department of Transportation
Federal Highway Administration
1200 New Jersey Avenue, SE
Washington, DC 20590
202-366-4000
Sign up to have Safety Compass delivered right to your inbox!
Best for printing: PDF Version (1.5 MB)
In this issue:
A Message from the FHWA Associate Administrator for Safety, Cheryl Walker
What's New?
FHWA Joins NHTSA in Celebrating the First National Pedestrian Safety Month
Re-Energizing the Highway Safety Improvement Program through Training and Technical Assistance
Safety-Driven Changes and Improvements
The HSIP Is Reducing Fatalities in Daviess County
Efforts to Reduce Commercial Motor Vehicle Involvement in Work Zone Crashes
The Road to Zero: Shifting from Vision to Action
Practical Safety Solutions for Local and Tribal Roads: A Human Factors Approach
Learning Together
Explaining the Rules of the Roundabout
Integrating Safety into Project Purpose and Need
What Are First Responder "Struck-by-Crashes," and How Are They Being Addressed?
Educating Young Pedestrians: STEP STEM Lessons for K–8 Students
Data and Analysis
New Resource Roundup
Speed Management Noteworthy Practices Report
USDOT Pedestrian Safety Action Plan and Summary Report Now Available Online
HFST Recommendations Report Now Available
Update to Pedestrian and Bicyclist Road Safety Audit Guide and Prompt List
Announcements
New Roadway Safety Champions—Partners for Zero Deaths Web Page Launched
Upcoming Conferences and Events
Visit the FHWA Office of Safety Virtual Booth in the TRB Exhibit Hall!

Cheryl Walker, FHWA Office of Safety Associate Administrator for Safety. (Source: FHWA)
Speeding is a major safety issue on our Nation's roadways. For the past two decades, speed has been a contributing factor in approximately one-third of all motor vehicle fatalities.1 Although traffic volume has decreased during 2020, preliminary data show a troubling increase in speeding this year. National Highway Traffic Safety Administration (NHTSA) research,2 released this October, suggests that driving patterns and behaviors changed significantly during the second quarter of 2020, and that drivers who traversed the now less-congested roads tended to engage in more risky behaviors, including speeding.
At the Federal Highway Administration (FHWA), we provide resources to our Federal, State, local, and Tribal safety partners to assist them in deploying engineering-based solutions to help keep road speeds safe. We encourage agencies to design roads for the speeds we want to see, and to set prudent speed limits on these roads. We also work to amplify the safety messages of NHTSA and other partners to help drivers modify their behaviors and drive at safe speeds.
FHWA's online speed-setting tool, USLIMITS2, helps practitioners set reasonable, safe, and consistent speed limits on their roads. When used in combination with other tools, such as speed studies, USLIMITS2 can provide an objective "second opinion" in speed-limit-setting decisions. In addition, this year we released a Noteworthy Speed Management Practices guide (see page 21) that provides case studies from eight communities highlighting speed management issues, including self-enforcing roadways, high-visibility enforcement, and successful adoption of speed safety cameras. We have a wealth of other resources on our speed management website, from basic information to educate the public to a detailed, interactive Traffic Calming ePrimer for professionals that has technical information on selecting and applying speed management countermeasures.
Please take advantage of our speed management resources to help you set reasonable speed limits and design safer roads. And please always be mindful of your speed when you are driving—it is better to be late than to never arrive at all.
By: Abdul Zineddin and Rebecca Crowe, FHWA Office of Safety
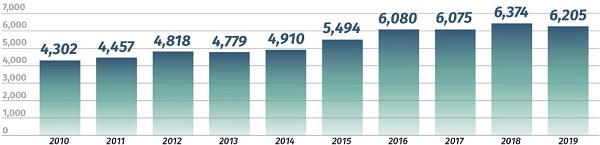
Pedestrian fatalities have been on the rise in recent years, both in number and in the percentage of overall highway fatalities. From 2010 to 2019, pedestrian fatalities in crashes increased 44 percent. However, the trend is starting to shift downward. NHTSA's Preview of Motor Vehicle Traffic Fatalities shows a decline in total traffic fatalities, including a reduction in pedestrian fatalities from 6,374 to 6,205 from 2018 to 2019.3 The bar graph below shows the number of annual pedestrian fatalities between 2010 and 2019. This is good news, and we will be working tirelessly to continue this downward trend.
To increase awareness of pedestrian safety, and to inform about initiatives and resources available for pedestrian safety, NHTSA launched the first National Pedestrian Safety Month in October. NHTSA, FHWA, and our safety partners kicked off National Pedestrian Safety Month with a webinar on Tuesday, September 29. During the webinar, NHTSA unveiled a new pedestrian data visualization tool designed to better communicate the issue of pedestrian-related crashes through data visualization.
Cheryl Walker, FHWA's Associate Administrator for the Office of Safety, highlighted various pedestrian safety programs and products during the webinar, including:
The webinar included remarks from Secretary of Transportation Elaine L. Chao, FHWA Administrator Nicole R. Nason, NHTSA Deputy Administrator James C. Owens, and speakers from transportation safety organizations. A recording of the kickoff webinar is available online at https://www.nhtsa.gov/events/national-pedestrian-safety-month-kickoff.
In preparation for National Pedestrian Safety Month, Administrator Nason launched two videos. In Walking at Night Does Not Have to Be Deadly, she discusses pedestrian safety at night, and in Take a STEP Forward and Enhance Pedestrian Safety, she shares information on life-saving countermeasures to improve pedestrian safety. Both videos are included in the pedestrian safety playlist available online.
Finally, National Pedestrian Safety Month included new pedestrian safety publications (see page 22) and a targeted social media campaign. To search this content, check out the campaign hashtag #PedestrianSafetyMonth.
For more information, contact Abdul Zineddin at abdul.zineddin@dot.gov.
By: Danielle Betkey and Karen Scurry, FHWA Office of Safety
The highway safety environment is ever changing, and highway safety needs can greatly vary among States. As States work to reduce highway fatalities and serious injuries through implementation of the Highway Safety Improvement Program (HSIP), it is important they are innovative and take advantage of the latest information and noteworthy practices to help advance their programs.
The HSIP is a core Federal-aid program that helps to reduce traffic fatalities and serious injuries on all public roads through the implementation of infrastructure-related highway safety improvements.
Every State has its own unique way of administering its HSIP. As such, the need for training and resources may also vary. For the HSIP, it is often more helpful for States to learn from each other. In an effort to "re-energize the HSIP," the Office of Safety is providing training and technical assistance to help States improve and advance their programs. We kicked off 2020 with a new webinar series that focused on HSIP-related topics, such as HSIP implementation plans, streamlining HSIP project delivery, marketing and communicating the Strategic Highway Safety Plan (SHSP), and evaluating and updating the SHSP. The webinar series will continue in 2021 and will focus on advancing the Safe System approach in the HSIP. Be sure to stay tuned for more details!
In addition to the webinar series, we have revamped our HSIP web page to include training resources that specifically support HSIP-related implementation efforts. These efforts also include the SHSP, Rail-Highway Crossing Program, and Safety Performance Management. We have compiled a list of current trainings, videos, and recorded webinars so that everything is available all in one place.
For States that need a more personalized solution, we offer free, customized technical assistance to meet State-specific needs. Technical assistance can be on-site (when available) or virtual through the following methods:
Peer Exchange Helps Texas Overcome Staff Development Hurdles
When the Texas Department of Transportation faced significant staffing changes, it looked to FHWA's peer exchange program to help update HSIP policies and educate new employees on current best practices. FHWA coordinated an information-sharing session with Texas, North Carolina, and Ohio. Following the peer exchange, Texas implemented a systemic safety program modeled by proven management systems that had been used by peer departments. The new system has helped prioritize projects and evenly distribute funding to match district needs.
"In a peer exchange, States dig in on similar issues they have and work with people they trust, which provides true value. The peer exchange helped us kick off a lot of change here in Texas." -Stephen Ratke, safety and traffic operations specialist, FHWA Texas Division.
Examples of the technical assistance that the Office of Safety has provided include:
The Office of Safety has resources to support your technical assistance requests, so challenge us and let us help you advance your State's safety program today! Agencies can request technical assistance through the Roadway Safety Professional Capacity Building Program by submitting an online application and selecting one of the following safety topics: HSIP, SHSP, RHCP or safety performance measures.
For more information, contact Danielle Betkey at Danielle.Betkey@dot.gov.
By: Becky Crowe, FHWA Office of Safety
The year 2020 has taught us to adapt and change course when needed. When restrictions for non-essential travel were implemented, FHWA's Safe Transportation for Every Pedestrian (STEP) program put one virtual foot in front of the other to bring States together. STEP had originally planned to host in-person scan tours (multiday knowledge-exchange and site-review events) between State departments of transportation (DOT). Not wanting to lose momentum, the STEP team adapted and moved the scan tours online in summer and fall 2020. The team facilitated conversations among States about STEP countermeasures and strategies for improving pedestrian safety.
The Florida DOT (FDOT) was the inspiration for a series of virtual events. FDOT requested FHWA support for a peer exchange on the STEP "Spectacular Seven" pedestrian countermeasures, such as the leading pedestrian interval (LPI), pedestrian refuge island, and raised crosswalk. The team hosted a five-part online series where State DOTs asked countermeasure-specific questions directly to other DOTs. FDOT hosted the first two sessions of the new State-to-State question-and-answer series on LPIs, raised crosswalks, and pedestrian refuge islands. DOT representatives from Washington, DC; Washington State; Maryland; New York; and North Carolina offered implementation recommendations, lessons learned, and design specifications. An average of 100 State DOT and FHWA personnel joined each online session.
"The opportunity to engage with colleagues throughout the country on ways to improve safety was very valuable to our team," shared Mary O'Brien, FDOT's host and State bicycle/pedestrian coordinator. "In particular, it was helpful to hear how LPIs are being used elsewhere."
The STEP team held another scan tour for the North Carolina, Oregon, Louisiana, Massachusetts, Michigan, Virginia, and Delaware DOTs to discuss major roadways that are over-represented in pedestrian fatalities and serious injuries. Together, these seven State DOTs shared their approaches, programs, modeling techniques, and challenges to pedestrian safety on suburban and arterial corridors. The group met three times in September and October and collaborated on a framework to proactively consider the needs of all road users in design, operations, and access of suburban corridors.
"The suburban roads scan tour was a great opportunity for my agency to look inward and outward for the most effective ways we can eliminate serious pedestrian crashes on these types of roads and streets," shared Gary Obery, Oregon DOT's bicycle and pedestrian traffic engineer. Eric Leaming, Oregon DOT's State traffic investigations engineer, shared, "I'd add this was good timing for Oregon because we are working on updating our crosswalk treatment guidelines now."
The STEP team adapted, once again, and brought Hawaii, Ohio, Tennessee, Washington, and Wisconsin DOTs together in a virtual environment to share their approaches to identifying high-risk areas for pedestrian fatalities, and to prioritize pedestrian projects. A key outcome from this two-day scan tour involved documenting noteworthy practices for translating data and systemic analysis into a program of projects and countermeasures.
The STEP program will continue hosting scan tours through spring 2021. If your agency is interested in learning more about STEP program resources, contact Becky Crowe at rebecca.crowe@dot.gov. To request a STEP workshop or additional training, contact Peter Eun at peter.eun@dot.gov.
By: Martha Horseman, KY LTAP, Joseph Martin, KY LTAP, and Rosemarie Anderson, FHWA Office of Safety
The HSIP is a core Federal-aid program designed to significantly reduce traffic fatalities and serious injuries on all public roads, including non-State-owned roads and roads on Tribal land. The HSIP focuses on performance and requires a data-driven, strategic approach to improving highway safety on all public roads.
In April 2019, the Kentucky HSIP identified a curve in Daviess County that had experienced more wet-pavement-related crashes than similar curves in the State. The curve is on Veach Road, a locally owned roadway classified as a collector road. This classification requires certain data to be collected that, in turn, allows the road to be included in the HSIP screening process. After identifying the curve as an area to be improved, HSIP staff conducted a field visit to determine what safety countermeasures would be a good application for the curve.
High-Friction Surface Treatments
52% reduction in wet road crashes
24% reduction in curve crashes
Source: CMF Clearinghouse, CMF IDs 7900 and 7901
These proven safety countermeasures for reducing crashes at curves include a variety of strategies that can be implemented in combination or individually. The strategies fall into two categories: enhanced delineation and increased pavement friction.
Enhanced Delineation
Enhanced delineation treatments can alert drivers in advance of a curve, and vary by the severity of the curvature and operating speed. Costs to implement these strategies are low to moderate. Treatments include the following:
Increased Pavement Friction
High-friction surface treatment (HFST) is another efficient countermeasure. HFST compensates for the high-friction demand at curves where the available pavement friction is inadequate to support operating speeds due to one or more of the following:
HFSTs are pavement treatments that effectively reduce all crashes—particularly wet-pavement-related crashes with friction demand issues typically seen on curves. KYTC reports a before/after total crash reduction of 90 percent for its HFST trial projects. HFSTs involve applying calcined bauxite, a high-quality aggregate, to the pavement using a polymer binder to restore and/or maintain pavement friction at existing or potentially high crash areas. The higher pavement friction helps motorists maintain better control in both dry and wet conditions and is most effective when used at curves and approaching intersections. Based on this assessment, HFST was chosen as the appropriate proven safety countermeasure for the Veach Road curve.
Implementing HFST
Kentucky Transportation Cabinet (KYTC) reports a before/after total crash reduction of 90 percent for its HFST trial projects.
Mark Brasher, Daviess County engineer, and Nathan Ridgeway described their experiences with the HFST application and the camaraderie between local governments and KYTC.
Were you familiar with Veach Road?
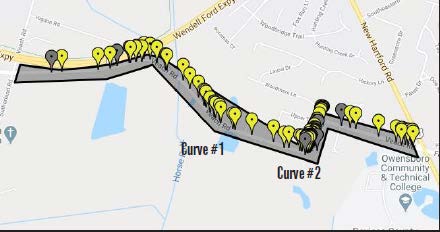
"When Nathan Ridgeway called and said this road was marked with a high crash rate, I was surprised by the particular curve he was referencing," said Brasher. KYTC had been aware of the two sharp 90-degree curves, and had previously done work to curve #2 before KYTC flagged curve #1. The curve not identified by the HSIP had a guardrail removed, added enhanced delineation, and—with permission from the landowner—cut back trees and adjusted shoulder to create a clear zone. The high crash rate curve was about 1,584 feet away.
What was the original problem and how did HFST solve it?
Curve #1 had been experiencing more wet-pavement-related crashes than other similar roadways in the State. After a separate analysis, curve #2 was determined to benefit from HFST as well. Combining both curves into one project made for a more cost-effective project.
Why was HFST the best choice?
Prior to deciding on HFST as the solution, KYTC and the HSIP conducted a field investigation and found that there were several driveways/entrances in the area. With any other method, you would have driveway and realignment issues because of the entrances. This made HFST a standout candidate. KYTC had looked into HFST but it was not affordable, which is why advanced delineation had been previously added. The curve is also located in a wooded area where pavement often remains wet and drivers underestimate the curves. Using HFST provided a good safety measure to ensure vehicles will remain on the roadway.
How is HFST applied?

High-friction calcined bauxite aggregate is used in conjunction with a cold-installed polymer resin binder. HFST is mechanically applied via dispensing vehicle. The polymer resin binder is evenly spread over the road surface at an approximate thickness of 50–55 millimeters. Immediately following, the high-friction aggregate is uniformly spread over the polymer resin binder. Once the polymer resin binder has cured, which can be just as short as a few hours depending on weather conditions, the excess aggregate is removed with a vacuum sweeper. The recovered aggregate is recycled and reused.
HFST Benefits and Effectiveness
HFST effectiveness varies by location, but overall, agencies have found that HFST can improve pavement surface friction by up to three times the existing condition, reduce needed stopping distance by 25–30 percent, and reduce crashes by 45–100 percent. In Kentucky, the average total crash reduction is 73 percent and the average wet-crash reduction is 86 percent.
"We were fortunate to have our cabinet HSIP, along with our FHWA Kentucky Division office, working with a local government (Daviess County) to install HFST. It's been less than a year, and there have been no crashes since the installation in two areas. We are looking forward to many more projects with our cabinet and local governments."
– Martha Horseman, Local Technical Assistance Program director
Who did the construction for this project?
It was a partnership between KYTC and Daviess County. Through FHWA, KYTC was able to fund up to 90 percent and Daviess County was responsible for the remaining 10 percent. Contractors performed the work, and KYTC were administrators and inspectors during the project.
What FHWA resources helped in this project?
FHWA recommends HFST as a low-cost safety countermeasure because it is effective and durable, especially as a spot application in critical locations. HFST dramatically and immediately reduces crashes, injuries, and fatalities associated with friction demand issues. This provided KYTC the reassurance that the treatment would provide long-term benefits.
This article was previously published in TheLink, Kentucky Technology Transfer Newsletter, spring 2020.
For more information, contact Rosemarie Anderson, FHWA Office of Safety, at rosemarie.anderson@dot.gov or Martha Horseman, LTAP director, at martha.horseman@uky.edu.
By Martha Kapitanov, FHWA Office of Operations
Each year, commercial motor vehicles (CMV) are involved in a significant number of fatal work zone crashes. CMVs consist of both buses and large trucks with a gross vehicle weight rating of more than 10,000 pounds. As the graphs illustrate:
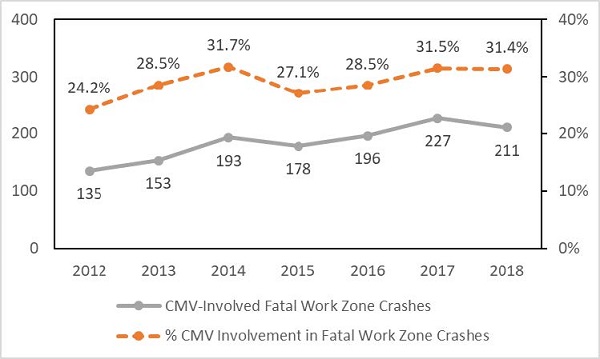
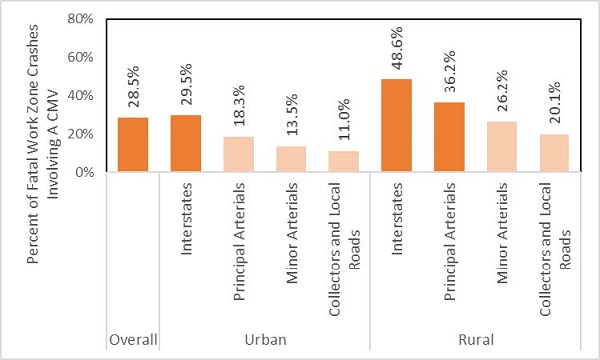
In recognition of this ongoing over-representation in work zone crashes, FHWA, in collaboration with Federal partners, State DOTs, and other stakeholders, has been leading efforts to mitigate CMV involvement in work zone crashes.
Development and Dissemination of Technical Resources and Outreach Materials
FHWA has used funding under the Work Zone Safety Grant program to develop technical resources to help State and local transportation agencies identify, select, and implement strategies to mitigate CMV crashes in work zones. These include:
FHWA and the Federal Motor Carrier Safety Administration (FMCSA) have also developed or sponsored outreach materials (brochures, social media graphics) to remind CMV drivers of the unique challenges of driving through work zones and defensive driving strategies to better accommodate those challenges. Outreach materials have also been developed to remind automobile drivers to drive defensively near CMVs around work zones.
Access to resources that help mitigate CMV crashes in work zones has been simplified by collating the resources on the Improving Large Truck Safety in Work Zones web page within the National Work Zone Safety Information Clearinghouse website. To access this page, visit www.workzonesafety.org/, hover over the Hot Topics tile, and click the top item.
Targeted Technical Assistance to Stakeholders
FHWA has begun engaging with stakeholders in several opportunity States to assist their efforts to identify and implement targeted mitigation strategies for reducing CMV involvement in work zone crashes at the State and local level. In 2019, representatives from these States, and other stakeholders (e.g., Federal administrations, tolling agencies, trucking industry entities, transportation safety groups, law enforcement, and academic transportation centers), participated in a virtual roundtable and in-person workshop to:
Currently, FHWA is leading a targeted effort to better understand the unique circumstances in each opportunity State that lead to CMV crashes in work zones. FHWA is also providing technical assistance and scheduling workshops in each opportunity State. In coordination with FMCSA and NHTSA, these workshops will include session topics, training materials, and other resources that assist stakeholders with identifying, adopting, and evaluating strategies to improve CMV safety in work zones. The culmination of this effort will be State-specific action plans and recommendations to improve safety and reduce CMV incidents in and around work zones.
For more information, contact Martha Kapitanov at Martha.kapitanov@dot.gov.
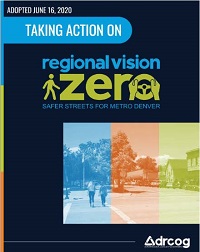
By Leah Shahum, Vision Zero Network
No one ever said getting to zero would be easy. That is clear to the 40+ communities across the Nation that have committed to the goal of Vision Zero: eliminating traffic fatalities and severe injuries among all road users.
Whether in cities that are recent adopters, such as Tampa, Florida, and Houston, Texas, or early adopters, such as Fremont, California, and Washington, DC, community leaders recognize that significant safety improvements on our roadways, sidewalks, and bikeways require time, energy, and the willingness to change some long-held practices and policies. And, let's be honest, change is not always easy.
Still, support for evolving our approach to traffic safety is growing across the country. Shifting to the Safe System approach—as detailed in the Fall 2020 edition of FHWA's Safety Compass Newsletter, and upon which Vision Zero programs are built—is feasible and valuable.
At the nonprofit Vision Zero Network, we've assessed these early years of Vision Zero's growth and evolution in the United States and considered best practices and experiences from other fields and other nations. While the various levels of progress in "zero traffic deaths" initiatives, such as Toward Zero Deaths and Road to Zero, are encouraging, it is clear that much work lies ahead. The following are three areas we consider important to advance Vision Zero and safe mobility for all.

1. Speeding up efforts to slow down
As detailed in the Fall 2020 edition of Safety Compass Newsletter, the Safe System approach "involves anticipating human mistakes by designing and managing the road infrastructure to keep the risk of mistakes low, and to ensure that when mistakes lead to a crash, the impact energy on the human body stays at tolerable levels."
A growing number of communities at the local, regional, and State levels are speeding up efforts to slow travel to a safer pace, particularly where motorists share space with those walking and biking. Recent examples include:
You can learn more about effective speed management strategies in the following resources: Institute of Transportation Engineers' (ITE) Speed Management for Safety, FHWA's Speed Management Safety, and the National Association of City Transportation Officials' City Limits.
2. Elevating equity in safe mobility strategies
Research and experience demonstrate that not all communities have been built or treated the same over time, which leads to different levels of safe mobility choices and inequities in outcomes.
Vision Zero—a data-driven approach that is complemented by meaningful community engagement—is increasing the awareness of and commitment to addressing these traditionally underserved communities. A key strategy is recognizing and building on the intersectionality of traffic safety and issues such as income level; environmental health conditions; and access to jobs, schools, and other basic needs. Many cities are overlaying their high-injury maps of severe traffic injuries and deaths with data that highlight relevant economic and social factors, bringing greater understanding and focus to their efforts.
Examples include the new Vision Zero Plan developed by the Denver Regional Council of Governments in Colorado, and the Minneapolis, Minnesota, Vision Zero Action Plan. Analyses in these communities show a disproportionate number of serious injuries and deaths concentrated in a relatively small percentage of streets that are more likely in low-income neighborhoods and communities of color. Vision Zero plans are also increasingly recognizing the intersectionality of traffic safety and issues of land use and affordable housing, such as the Austin Strategic Mobility Plan.
3. Think BIG and small for safety
Shifting toward the Safe System approach and making transformative change entail thinking differently about how we gather and use safety data. This new approach requires shifts in our culture, as well as shifts in the attitudes within our own institutions and among policymakers and the public. It also requires prioritizing safety over speed in policy and planning decisions.
Now is the time for action, evidenced most starkly by the disturbing rise in pedestrian deaths in the past decade in the United States, and as outlined in The Road to Zero report that lays out three focus areas:

At the same time, there is value in working at a smaller scale and more expediently bringing safety changes to our streets. This includes using pilot projects to learn what works and make modifications where needed. This tactical urbanism strategy offers the chance to act nimbly and cost-effectively, while also gauging public input and involvement. Recent examples include the fast-growing movement to create "slow streets" or "open streets," in which traffic volume and speed are reduced so people can walk, bike, and run safely.
Ultimately, the road to zero traffic deaths and severe injuries is not just about working harder or caring more, but also making decisions to prioritize safety. This includes a willingness to change, assess progress, and learn from mistakes. It will take time and a lot of hard work, but communities across the country are showing they are ready to move vision to action.
For more information, contact Vision Zero Network Executive Director Leah Shahum at leah@visionzeronetwork.org.
By Rosemarie Anderson, FHWA Office of Safety
It is widely acknowledged that traffic safety considers and integrates three components: the roadway environment, the vehicle, and the roadway user. Human factors principles explain how road users gather information, make sense of that information, make decisions, and execute actions when traveling on the roadways. Understanding these principles can help identify safety issues and select the most effective countermeasures that address those issues on the roadways. As we move toward a Safe System approach, which aims to eliminate fatal and serious injuries for all road users by accommodating human mistakes and keeping impacts on the human body at tolerable levels, a basic understanding and application of human factors principles will be viable tools for our safety toolbox. With this in mind, the FHWA Office of Safety has developed a technical report, Practical Safety Solutions for Local and Tribal Roads: A Human Factors Approach, aimed at Tribal and local transportation safety practitioners.
Understanding basic human factors principles can be useful when identifying and addressing local and Tribal road safety issues. This understanding can help select the most effective countermeasures for safety challenges. Using plain language, this report provides information on the effects of road users' actions on roadway safety, and how, when, and where practitioners can use this information to improve safety on their roadways. This report helps road practitioners understand road user capabilities and limitations. Practitioners can then use that understanding to improve safety. The report is a complement, not a substitute, to technical information found in other guidance, such as the Manual on Uniform Traffic Control Devices and the Highway Safety Manual (HSM).
The report defines six basic human factors principles and provides information about using the principles to improve safety:
These principles can help practitioners identify issues and select potential solutions. The report addresses 11 common safety challenges, such as unsignalized intersections and issues on unpaved roadways. It explains how the human factors principles relate to each safety challenge, how they help practitioners anticipate and mitigate human error, and how practitioners can use the principles to select effective, practical solutions. Each safety challenge offers online and print resources and defines technical terms often used when discussing that topic. This easy-to-use report addresses each topic with:
For more information, contact Rosemarie Anderson at rosemarie.anderson@dot.gov.
By Jeffrey B. Shaw, P.E., FHWA Office of Safety
The FHWA Intersection Safety Program recently published two Rules of the Roundabout products—a video and a print handout—that educate stakeholders about how to navigate multilane roundabouts.
Because not all roundabouts are identical, it is important to communicate how multilane roundabouts differ from single-lane roundabouts. With multiple lanes for entering, circulating, and exiting a multilane roundabout, drivers have more decisions to make as they approach. These decisions include which lane to use for entry and circulation so they can exit to their desired destination from the proper lane. By remembering three basic rules, successfully driving through a multilane roundabout should be as easy as 1-2-3!
The Rules of the Roundabout—Slow Down, Look around, Be Ready to Yield
"The rules" are by no means exclusive to multilane roundabouts. In fact, these are good rules to apply at any intersection, whether it is a roundabout or not! As a matter of educating motorists about multilane roundabouts, these rules are basic and the keys for success.
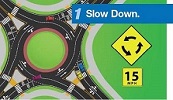
Rule 1: Slow Down
Roundabouts are geometrically designed to require vehicles to slow on the approach and to circulate at speeds of 15–25 miles per hour. Slowing down is beneficial for several reasons—perhaps most obviously that if a crash occurs, the severity is significantly decreased and the chance of serious injury or death is much less. Lower speeds also make it possible for drivers to take in more visual information and identify people walking and bicycling in time to share the road, as well as react and yield to other road users when necessary.
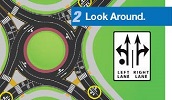
Rule 2: Look around
For a motorist approaching a roundabout, the process of looking around to determine which lane to use begins well ahead of reaching the yield line. Signs and pavement markings indicate which lanes to use to go straight through, and which lanes to use to turn left or right. It is also critical that drivers pay attention to whether people are walking and bicycling at the roundabout, and yield the right-of-way to allow them to safely cross or move through the roundabout.
Rule 3. Be Ready to Yield

Being ready to yield is the name of the game at all roundabouts, but at multilane roundabouts, there are a few important things to remember. First, vehicles in all lanes of the roundabout have the right-of-way, so an entering vehicle must yield to traffic in all lanes. Second, when approaching, entering, and exiting, it's always safer and more courteous to yield the right-of-way to people waiting at crosswalks or bicycling through the roundabout. Finally, if there is a large truck or bus in an adjacent lane, it is better to give them space and avoid driving next to them in the roundabout (in some States, it is the law).
These new Rules of the Roundabout products have been added to the toolbox for conducting outreach and education. The video is short enough to be widely shared on social media platforms and used in public education campaigns. The print handout features a customizable "for more information" field so the right person from your agency can be the main point of contact. We hope you find them very useful in engaging stakeholders in your community!
For more information, contact Jeff Shaw at Jeffrey.Shaw@dot.gov.
By Phillip Bobitz, FHWA Office of Safety
Establishing the purpose and need for a project is a key step in project development. Although a purpose and need statement is only required for projects that require environmental assessments or environmental impact statements, it is a good practice to establish for projects that can be processed as categorical exclusions because it demonstrates the reason for moving forward with the project. For environmental assessments and environmental impact statements, the purpose and need statement identifies reasonable alternatives. The need for a project may be related to safety, mobility, congestion, geometry, asset condition, state of repair, or facility deficiencies. In any case, transportation professionals should always consider future safety performance when establishing the purpose and need of a project.
As noted in FHWA's primer, Integrating Road Safety into NEPA Analysis, there are several considerations for transportation professionals when incorporating safety into a purpose and need statement:
A facility's compromised safety is often the result of another known deficiency, such as mobility or facility deficiencies. Yet purpose and need statements routinely cite that geometric features not up to the most recent design standards justify that a safety problem exists. If safety will be included in the need for action and purpose for a project, then there should be sufficient information to determine why safety is an issue.
Applying data-driven safety analysis approaches to determine the extent and nature of the safety problem during the development of a project's purpose and need can be effective when defining the true safety performance of the roadway. Additionally, Road Safety Audits (RSA) are an effective tool to identify and describe a safety problem to support a purpose and need statement when crash data are limited or a diagnosis is necessary.
Generic statements and lack of justification when defining safety in purpose and need statements posed challenges for projects in Pennsylvania. To encourage a more data-driven process and facilitate more objective analysis, the Pennsylvania Department of Transportation (PennDOT) and FHWA Pennsylvania Division office collaborated on an update to the Needs Study Handbook, PennDOT Publication 319. The updated guidance transitions from using historical crash rates to HSM analysis procedures to assess if a safety problem exists. The handbook provides information on the crash data analysis, HSM analysis procedures during purpose and need development, RSAs that can be used to substantiate a safety problem, and examples of correct and incorrect purpose and need statements. Although this was a culture shift in how safety had typically been addressed at this stage of project development, the changes have enhanced the validity of purpose and need statements, and they have improved efficiency when transitioning to the alternative analysis stage.
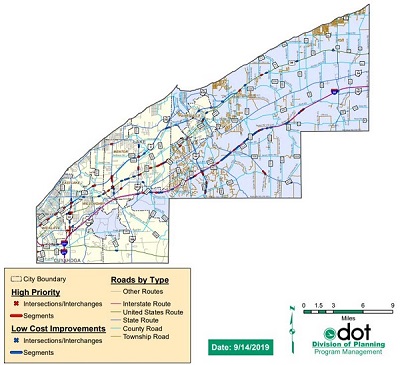
Ohio Department of Transportation (ODOT) published its Guidance for Developing Purpose and Need in 2018, which details the process for establishing safety as a need. ODOT developed Safety Integrated Project (SIP) maps that are updated annually through AASHTOWare® Safety Analyst™4 to provide Ohio's safety and priority locations. Safety Analyst uses HSM methodologies to identify roadway locations with the highest potential for reducing crashes, and flags spot locations and road segments that have higher than predicted crash frequencies. If a project study area includes a high crash or high-priority location (i.e., a location where low-cost improvements should be considered) that is not on a SIP map, but recent crash data suggest there is a safety problem, additional analysis and consideration are required. Any project purpose and need statement that identifies safety must analyze proposed alternatives using HSM methodologies. Additionally, in Safety Analysis Guidelines, ODOT establishes safety assessment processes (section 2.4) and corresponding flowcharts (appendix C) based on project complexity, if alternatives are being analyzed, and if safety is a component of the project's purpose and need. The processes have been successful in reducing the identification of safety as a need if not supported by data.
FDOT's Safety Analysis Guidebook for Project Development and Environment (PD&E) Studies provides guidance on integrating quantitative safety analysis into the PD&E process. The guidebook includes considerations for incorporating safety in purpose and need statements, encourages the use of HSM methods, and defines how practitioners should apply HSM methods to quantify safety performance. The guidebook also provides examples of documentation and analyses used for safety in PD&E studies.
Identifying, developing, and documenting a safety need is an iterative process. This iterative process starts during planning and programming. It is refined during project scoping and further refined during the environmental process. Agencies can capitalize on this opportunity to address safety by using objective analysis and proven safety countermeasures. Taking a proactive approach to roadway safety before and during the environmental process can save time and money—and most importantly, lives.
For more information, contact Phillip Bobitz, FHWA Office of Safety, at Phillip.bobitz@dot.gov.
By Ana Maria Eigen, D.Sc., Office of Safety Research and Development, and James G. Austrich, Office of Operations
Struck-by crashes involve law enforcement, fire/rescue, emergency medical services, transportation/public works, and tower personnel who sustain serious and fatal injuries while conducting their duties. Often, these crashes are not captured in traditional data systems, but they can result in serious or fatal injuries and compromise the safety of the entire roadway system.
The FHWA Office of Safety Research and Development and FHWA Office of Operations are undertaking a task to assess current data sources, compile extant data, review gaps, and propose a data collection strategy that will start to quantify this little-understood issue. FHWA seeks to:
Not Captured in Traditional Systems…Yet
With the support of the Office of Safety, we seek to rely upon forthcoming changes to the Minimum Model Uniform Crash Criteria (MMUCC) and Model Inventory of Roadway Elements (MIRE).
MMUCC recommends a specific minimum set of data elements and attributes to describe a crash. The MIRE guide identifies traffic elements critical to safety management. As part of the guidance, States will start to populate a struck-by variable. It will take at least 3–5 years before a significant sample of struck-by crashes might be examined. For this reason, we are taking a grassroots approach within representative States.
Minimize and Mitigate Serious or Fatal Injury
Decades ago, biomechanics researchers aimed to identify injury patterns and mitigate the effects of serious and fatal crashes. Earlier biomechanics research that had relied on extensive data sets gave rise to protective countermeasures, which made previously non-survivable crashes survivable. With new vehicle technology, driver education, and enforcement countermeasures, some crash injuries evolved from non-survivable to serious injuries that might be addressed by countermeasures. Similarly, some serious injury crashes evolved to minor injuries or no injuries.
With adequate public education and outreach, responder training, and operations countermeasures, the same goal is now present for law enforcement and other first responders. The recently initiated data assessment task seeks to identify and compile disparate data sets that will lead to countermeasures—to protect those who protect us. As with the biomechanics countermeasures, the goal is to transform struck-by crashes from an abstract, career-ending problem to a quantifiable problem that can be analyzed and addressed.
How Can Operations Countermeasures Make a Roadway System Safer?
By identifying data sources and providing these data to safety and operations experts for analysis, a suite of countermeasures is envisioned to minimize first responder exposure, allowing them to secure roadway operations and carry out their missions.
If you have questions about this research, contact Ana Maria Eigen at ana.eigen@dot.gov.
By Becky Crowe, FHWA Office of Safety
Congratulations, you have been invited to lead an activity for a group of students as part of a school event or scouting activity! Now what? You could search the Internet for ideas, you could ask your colleagues, or you could use one of the five science, technology, engineering, and math (STEM) lessons recently developed by FHWA's STEP program. The STEP program promotes seven countermeasures that help reduce pedestrian fatalities at crossing locations:
STEM educational materials help K–8 students consider the design of our roadways and discover how changes can make it safer for people to walk and cross the roadway.
The five STEM lessons introduce and reiterate the following concepts related to roadway design and pedestrian safety:
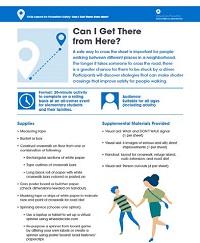
Many transportation and engineering professional associations and university transportation research centers offer publicly available STEM lessons. However, most lessons are designed for middle school and high school students, and very few mention walking, bicycling, and transit while covering transportation topics. Each FHWA STEP STEM lesson focuses on the importance of pedestrian safety and offers an easy-to-follow format with step-by-step instructions, lists of suggested materials, and visual aids.
A supplementary primer describes key concepts in an accessible manner and offers tips for doing hands-on STEM activities with kids. The lessons are also flexible and include information about tailoring the activity for different ages, group sizes, educational settings, and available space and materials.
An additional benefit of teaching these lessons is that accompanying adults will be reminded that the built environment serves children just as much as it serves adults, and hopefully the students will leave your activity with a renewed appreciation for roadway design and operation.
To learn more about the STEP STEM lessons, contact Becky Crowe at rebecca.crowe@dot.gov.
By Robert Pollack, FHWA Office of Safety
With the clock ticking toward the deadline for when States must have access to the MIRE Fundamental Data Elements (FDE), the FHWA Office of Safety has initiated a new technical assistance program for providing MIRE and MIRE FDE technical assistance.
FHWA can provide subject matter experts for technical assistance to State and local agencies on issues related to MIRE and MIRE FDEs. The technical assistance can be used to address what data to collect, how to collect it, how to manage and maintain the data (governance), and how State and local agencies can transfer and share data.
Background
MIRE is a list of more than 200 data elements that are essential for an adequate roadway inventory database that supports the State's HSIP. The MIRE FDEs are a subset of the MIRE data elements required by the Moving Ahead for Progress in the 21st Century Act and the Fixing America's Surface Transportation (FAST) Act. These data elements are useful for State roadway inventories because they support an analytic approach in developing and maintaining the State's HSIP and the SHSP.
This program will also provide technical assistance to the FHWA Office of Safety for several additional MIRE and MIRE FDE-related activities, which include:
This MIRE–MIRE FDE technical assistance project is now underway.
For more information, contact Robert Pollack, project manager, at Robert.pollack@dot.gov.
By Jerry Roche, FHWA Office of Safety, Matthew Enders, WSDOT, Catherine Chestnutt, VHB, Jeff Gooch, VHB, and Frank Gross, VHB
Washington State Department of Transportation (WSDOT) developed a Crash Data Summary Template as a diagnostic tool to support a systemic approach to safety across WSDOT and its local agency partners. FHWA recognized the value of this tool for other State DOTs and local agencies and added features and functions to the template, including accessibility enhancements for people with visual impairments.
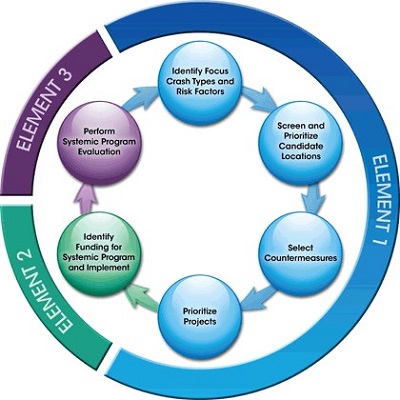
Complementary to the hot-spot approach that addresses high-crash locations, the systemic approach addresses high-risk locations. As shown in the figure below, the systemic approach identifies common contributing factors for a focus crash type, such as fatal and serious injury crashes involving a roadway departure, and implements countermeasures on roadways with characteristics similar to those that have experienced the focus crash type. FHWA's systemic safety project selection tool outlines steps to identify focus crash types.
The Crash Data Summary Template can help agencies organize and review their crash data in support of the systemic approach. Specifically, analysts can use the spreadsheet to summarize the distribution of available data and identify factors that contribute to crashes. As shown in the first table, analysts enter crash data by attribute for the study period of interest. The spreadsheet then sums the data, calculates the proportion for each attribute, and highlights attributes that are over-represented. Note the spreadsheet contains many more rows and individual columns for up to 5 years of individual data. Users can insert additional years or rows as needed.
The key to using the spreadsheet is to identify when the proportion of crashes is much higher in one group compared to another, which indicates over-representation. One way to identify over-representation is to compare the proportion of fatal and serious injury crashes to total crashes, as shown in the first table. In this example, alcohol-related collisions are over-represented on Example County roads—they account for 6.1 percent of fatal and serious injury crashes compared to 1.9 percent of total crashes. Similarly, single-vehicle and head-on crashes are over-represented. These could be areas to focus on for addressing fatal and serious injury crashes in Example County. The Crash Data Summary Template automatically highlights cells if the proportion of fatal and serious injury crashes is either 5 percent higher or at least two times greater than the proportion of total crashes.
| Fatal and Serious Injury Crashes | All Crashes | |||
|---|---|---|---|---|
| Example County Roads | Example County Roads | |||
| Year 1–5 Subject Data | Year 1–5 | % | Year 1–5 | % |
| Overall Numbers | ||||
| Total # Collisions | 213 | N/A | 13,628 | N/A |
| # Fatal Collisions | 38 | 17.8 | 38 | 0.3 |
| # Serious Injury Collisions | 175 | 82.2 | 175 | 1.3 |
| # Alcohol-Related Collisions | 13 | 6.1 | 254 | 1.9 |
| Total # Fatalities | 41 | N/A | 41 | N/A |
| Total # Serious Injuries | 211 | N/A | 211 | N/A |
| Manner of Crash | ||||
| Single Vehicle | 89 | 41.8 | 2,552 | 18.7 |
| Angle | 65 | 30.5 | 3,751 | 27.5 |
| Head On | 27 | 12.7 | 328 | 2.4 |
| Rear End | 24 | 11.3 | 5,301 | 38.9 |
| Sideswipe – Same Direction | 5 | 2.3 | 1,225 | 9.0 |
| Sideswipe – Opposite Direction | 3 | 1.4 | 450 | 3.3 |
| (Blank) | 0 | 0.0 | 21 | 0.2 |
Crash data input for Example County roads.
Another way to identify over-representation is to establish one or more groups to compare against. This is shown in the second table on the following page. Over-representation is still indicated by a higher proportion of crashes in one group compared to another, but now the comparison is against similar jurisdictions or the statewide average. In this example, the number of fatal collisions is over-represented on county roads in the Example County compared to county roads in comparison group 1. It also shows that single-vehicle and head-on crashes are over-represented for total crashes, but only head-on crashes in Example County are significantly over-represented for fatal and serious injury crashes compared to county roads in comparison group 1. While the table only shows a comparison to one group, the spreadsheet tool includes three comparison groups, and you can add more as desired.
| Fatal/Serious Injury Crashes Only | Total Crashes | |||||||
|---|---|---|---|---|---|---|---|---|
| County Roads in Comparison Group 1 | Example County Roads | County Roads in Comparison Group 1 | Example County Roads | |||||
| Crash-Related Statistics | Year 1–5 | % | Year 1–5 | % | Year 1–5 | % | Year 1–5 | % |
| Overall Numbers | ||||||||
| Total # Collisions | 70,986 | N/A | 213 | N/A | 2,235,038 | N/A | 13,628 | N/A |
| # Fatal Collisions | 7,053 | 9.9 | 38 | 17.8 | 7,053 | 0.3 | 38 | 0.3 |
| # Serious Injury Collisions | 63,933 | 90.1 | 175 | 82.2 | 63,933 | 2.9 | 175 | 1.3 |
| # Alcohol-Related Collisions | 3,764 | 5.3 | 13 | 6.1 | 45,184 | 2.0 | 254 | 1.9 |
| Total # Fatalities | 8,155 | N/A | 41 | N/A | 8,155 | N/A | 41 | N/A |
| Total # Serious Injuries | 74,136 | N/A | 211 | N/A | 74,136 | N/A | 211 | N/A |
| Manner of Crash | ||||||||
| Single-Vehicle | 28,315 | 39.9 | 89 | 41.8 | 346,486 | 15.5 | 2,552 | 18.7 |
| Angle | 19,602 | 27.6 | 65 | 30.5 | 618,408 | 27.7 | 3,751 | 27.5 |
| Head On | 5,002 | 7.0 | 27 | 12.7 | 62,105 | 2.8 | 328 | 2.4 |
| Rear End | 14,208 | 20.0 | 24 | 11.3 | 816,812 | 36.5 | 5,301 | 38.9 |
| Sideswipe – Same Direction | 2,623 | 3.7 | 5 | 2.3 | 243,479 | 10.9 | 1,225 | 9.0 |
| Sideswipe – Opposite Direction | 1,028 | 1.4 | 3 | 1.4 | 51,444 | 2.3 | 450 | 3.3 |
| (Blank) | 208 | 0.3 | 0 | 0.0 | 96,304 | 4.3 | 21 | 0.2 |
Crash data summary for Example County and roads in comparison group 1.
The only requirement for using the spreadsheet is having access to crash data. Most local agencies have access to crash data for their jurisdictions, or they can obtain data from the data steward agency in their State (e.g., DOT, department of public safety, or department of motor vehicles). Agencies can access crash data for free from the Fatality and Injury Reporting System Tool (FIRST) if they don't have ready access. FIRST is maintained by NHTSA and includes data for crashes involving a fatality.
The Crash Data Summary Template is highly editable and customizable. Even if the crash data do not represent the same variables used in the Washington State example, the tool can still meet agencies' needs. Users can simply modify the crash/vehicle attributes in the tool to match their data by leaving a column blank or inserting or deleting rows. Agencies are also not limited by the years of available crash data. Importing more years into the tool provides a larger sample and increases the ability to detect over-representation; however, at the same time, more years of data can create challenges if there are changes in the data set over time.
Successful Implementation
WSDOT has provided the Crash Data Summary Template to all counties as the first step in developing their county road safety plans. WSDOT has begun using the tool to support cities as well. Specifically, Washington compares the data for a given city or county to other cities or counties in the region and State. The goal is to summarize crash data to identify focus areas (i.e., emphasis areas) and priorities for the plan.
Matthew Enders, who works with the local programs division for WSDOT, said, "Sharing this tool with every agency developing a safety plan has been a significant benefit to the local safety program in Washington. Each agency has a better understanding of which crash types and factors to analyze in their plan. This, in turn, has made the plans and projects more effective and has given everyone a good starting point as they begin drafting their safety plans."
The Crash Data Summary Template has also been used by local agencies all over the United States as part of the Every Day Counts Data-Driven Safety Analysis initiative. This initiative provides support for local road safety plans (LRSP) by identifying focus crash types, focus facility types, and potential risk factors. FHWA has worked with local agencies to summarize data, making it easier to digest and communicate issues to colleagues, stakeholders, and in LRSPs. These include agencies in the following States and Tribes:
A workshop attendee from a county in Alabama shared, "In reviewing our crash data, there were not clear areas of crashes. Very few if any hot spots existed, so learning about systemic approaches and seeing which severe crash types were over-represented was very helpful in our county's regard."
Benefits
The Crash Data Summary Template is an accessible, easy-to-use, editable tool that supports systemic analysis for any agency. The tool presents the data in an easily digestible format. With the spreadsheet, agencies can identify focus crash types and focus facility types to inform the risk factor analysis and identify potential risk factors to study further. Agencies can also compare the crashes in their local jurisdictions to other jurisdictions. The tool is fully accessible for people who have visual impairments, and people can toggle the Accessibility switch on and off in each worksheet, using cell A1 or using ctrl+shift+A.
Limitations
While the Crash Data Summary Template can help identify potential risk factors, there is a need to use other tools to further investigate and confirm risk factors because the Crash Data Summary Template spreadsheet does not include non-crash locations. By integrating roadway and exposure data, there is an opportunity to identify which factors are over-represented at crash locations compared to non-crash locations. FHWA's Crash Tree Maker—available at FHWA's LRSP Do-it-Yourself (DIY) website—is one tool that can assist with this analysis. For more information about the tool, refer to FHWA's Winter 2020 Safety Compass Newsletter. Since the Winter 2020 edition, the Crash Tree Maker has been updated to make the tool more accessible, and to add several export options and eliminate nodes with zero crashes from the crash tree.
Availability
The Crash Data Summary Template is available for free from the LRSP DIY website. Contact Jerry Roche at Jerry.Roche@dot.gov for training or technical assistance on the systemic safety analysis process, including the Crash Data Summary Template and Crash Tree Maker.
By Guan Xu, P.E., FHWA Office of Safety Technologies
Speeding is a significant threat to safety and results in about 10,000 deaths each year. Speeding is defined as exceeding the posted speed limit or driving too fast for conditions. It is also a crosscutting safety issue that impacts many safety areas, such as pedestrians, bicyclists, rural road safety, impaired driving, and distracted driving. Speeding is a complex safety problem to solve, as it involves many factors. These factors include public attitudes, vehicle performance, enforcement strategies, judicial decisions, and road user behavior. These are in addition to factors of roadway design and operations and posted speed limits that transportation professionals normally deal with.
Over the past couple decades, the FHWA and USDOT speed management team has collaborated with safety partners, such as ITE, to tackle speeding safety issues. We have also recognized that while speeding is a national problem, effective solutions must be applied locally. In recent years, speed management has received increased attention from State and local agencies, especially those that have embraced a Vision Zero approach to safety. Realizing the situation, and the challenges and needs coupled with it, we have been redirecting our efforts toward providing direct assistance and training to agencies and practitioners.
Delivery of eight noteworthy practices is another result of FHWA's leadership efforts toward creating effective resources for practitioners at State and local levels. The newly published Noteworthy Speed Management Practices is the result of extensive outreach with many different agency types across the United States. Outreach efforts have included roundtable workshops, webinars, meetings with relevant associations (e.g., Insurance Institute for Highway Safety's national forum on speeding, Vision Zero), solicitation through committees (e.g., TRB, ITE), and extensive literature reviews. Ultimately, the project's Technical Advisory Committee selected eight practice cases from 93 potential noteworthy practices.
Noteworthy practices cover the most important aspects of speed management, including:
Detailed information on the noteworthy speed management practices is provided in the Noteworthy Speed Management Practices report, which summarizes challenges, takeaways, and lessons learned.
For more information, contact Guan Xu at Guan.Xu@dot.gov.
By Abdul Zineddin, FHWA Office of Safety
Pedestrian safety is one of the FHWA's top priorities. This past summer the FHWA hosted three webinars that formed the USDOT Pedestrian Safety Summit. These webinars helped collect input on actions USDOT might take in the near term to address pedestrian safety. Based on the webinars and the input received, USDOT developed the following two documents:
These documents are included on the Pedestrian Safety Summit website, which also includes links to the summit webinars and other resources.
For more information, contact Abdul Zineddin at abdul.zineddin@dot.gov.
By Joseph Cheung, FHWA Office of Safety
The FHWA Office of Safety recently published Recommendations Report for High Friction Surface Treatments: Candidate Sites, Materials, and Construction.
HFSTs are intended to restore and maintain pavement friction to reduce crashes. They are most effective in reducing run-off-the-road and other wet-weather crashes. HFSTs have proven most effective on rural and urban horizontal curves and tight-radius loop ramps. They have also been applied at high-volume intersections and downhill approaches where stopping sight distance is limited. HFST is a thin layer of high-quality polish-resistant aggregate bonded to the pavement surface with a polymer resin binder. HFST was one of the Every Day Counts 2 (EDC-2) safety initiatives. When applied to targeted locations, it has been proven highly effective in reducing wet-pavement-related crashes.
Highlights of the report include:
The report synthesizes the noteworthy practices for HFST based on Federal agency, State agency, and industry experience, including relevant recommendations from the recently completed Long-Term HFST Performance Monitoring Study. By properly identifying candidate sites, selecting the best materials, and implementing high-quality construction practices, agencies will have the best return on investment for their HFST installations. Agencies can see more widespread HFST deployment and a longer-lasting safety countermeasure, resulting in greater crash reductions.
For more information, contact Joseph Cheung at joseph.cheung@dot.gov.
By Tamara Redmon, FHWA Office of Safety
The FHWA Office of Safety recently completed the Pedestrian and Bicycle Road Safety Audit Guide and Prompt List, which is an update to the Pedestrian Road Safety Audit Guidelines and Prompt Lists (2007) and Bicycle Road Safety Audit Guidelines and Prompt Lists (2012). Because pedestrian- and bicycle-focused RSAs are often simultaneously conducted, this new guide provides content for both modes in one concise document.
An RSA is a formal safety performance examination of existing or future roads or intersections by an independent, multidisciplinary team. It qualitatively estimates and reports on potential road safety issues and identifies opportunities for improvements in safety for all road users.
This guide is intended to support agencies interested in conducting pedestrian- and bicycle-focused RSAs. It includes information on safety risks for both modes, the RSA process, necessary data, and the roles and responsibilities of the RSA team. Also included are updated prompt lists for pedestrians and bicyclists to use in the field.
This guide will help practitioners understand pedestrian and bicyclist issues in their jurisdictions. It can also support transportation agencies in achieving other goals, such as enhancing quality of life, improving community health, and increasing pedestrian and bicycle mode share.
The aim of an RSA is to answer the following questions, which will also apply to pedestrian- and bicycle-focused RSAs:
The focus of an RSA is safety while working within the context of mobility, access, surrounding land use, and aesthetics. RSAs enhance safety by bringing together a multidisciplinary team that identifies potential safety issues affecting all road users under all conditions, and suggests measures for the design team or responsible agency to consider. While all RSAs should include a review of multimodal safety, a pedestrian- and bicycle-focused RSA strives to improve identified safety issues that may have resulted from changes in land use and mode choice over time, or from inadequate consideration of walking and cycling in previous planning and design processes.
For more information, contact Tamara Redmon at Tamara.redmon@dot.gov.
By Adam Larsen, FHWA Office of Tribal Transportation, and Tom Bragan, NHTSA National Center for Statistics Analysis
The new Tribal Crash Reporting Toolkit enables Tribal governments to improve collection and use of crash data. The toolkit helps Tribal governments maintain data sovereignty while consistently collecting a standardized set of data elements for each crash.
NHTSA published the toolkit in October 2020 to help Tribes in all phases of safety data improvement. The self-assessment tool identifies elements of safety data management that could be improved. The crash reporting facts and fictions tool further enhances the planning of safety data improvements by dispelling common barriers to crash data improvement. A data analysis tool describes common ways that safety data are used to improve transportation safety. Other tools contain the framework needed to establish a crash reporting system. These include a crash reporting form, officer's instruction manual, database, quality control guide, and a manual that describes all of the available tools. All of these tools are available at no cost at https://www.tribalsafety.org/tribal-crash-reporting-toolkit.
The toolkit is based on the Model Minimum Uniform Crash Criteria (MMUCC) and was developed by NHTSA in partnership with FHWA. Several Tribes participated in a pilot of the toolkit contents. The Cheyenne River Sioux Tribe police department tested the crash reporting form and database.
The FAST Act addressed crash reporting in Tribal areas by stating, "Without more accurate reporting of crashes…it is difficult or impossible to fully understand the nature of the problem and develop appropriate countermeasures," and "Improved crash reporting by Tribal law enforcement agencies would facilitate safety planning and would enable Indian tribes to apply more successfully for State and Federal funds for safety improvements." In response to the FAST Act, FHWA developed a report to Congress, entitled Tribal Governments and Transportation Safety Data. Later, the Bureau of Indian Affairs Office of Justice Services published Indian Highway Safety Program: Tribal Crash Reporting Assessments.
Based on this research, at least 20 percent of Tribal police departments may not be using a standardized crash report. Also, half of the Tribes that had participated in a recent study said they use a paper reporting system rather than an electronic system. The Tribal Crash Reporting Toolkit addresses these, and many other, improvements for crash reporting.
For more information, contact Tom Bragan at Tom.Bragan@dot.gov or Adam Larsen at Adam.Larsen@dot.gov.
By Hillary Isebrands, FHWA Resource Center Safety and Design Team, and Jerry Roche, FHWA Office of Safety
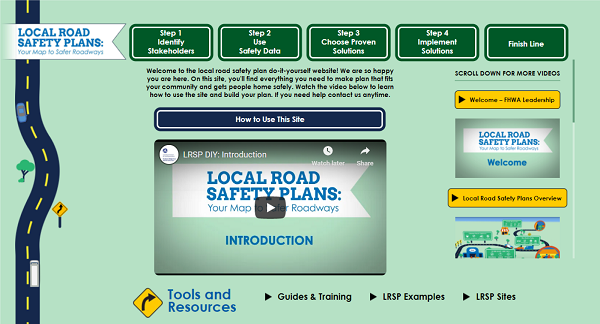
For more information on LRSPs, check out our 2.5-minute video: https://www.youtube.com/watch?v=Wzdm798MoI8
FHWA recently unveiled a unique website to help local agencies reduce serious and fatal crashes on their roadways. The LRSP DIY website includes resources local agencies and their partners need to create these lifesaving plans.
Approximately 40 percent of the Nation's fatalities occur on local roadways—an average of 12,000 deaths a year. LRSP is an FHWA Proven Safety Countermeasure that local agencies can use to effectively identify at-risk locations and deploy safety solutions. Matthew Enders, technical services manager and LTAP director, said developing LRSPs "has been probably the most positive experience I've had in working with safety over a couple of decades. This is something where I've seen growth and benefit for the individual local agencies."
FHWA, in cooperation with the National Association of County Engineers and the National LTAP, has spent the past 5 years helping local agencies create these plans. With more than 23,000 local agencies in the country, it is impossible to deliver in-person training to all of them. In fall 2019, FHWA began developing a one-stop-shop website, with a goal to make it as personable and intuitive as possible to emulate in-person training in a virtual environment.
Each page has an introduction video that explains the primary objectives of that step. Additional videos on the right sidebar, such as Local Agency Insights, feature more than 26 practitioners sharing their experiences in developing LRSPs, which enables users to learn from their peers.
Each page includes a Tools and Resources section with a wealth of information in the form of guides, templates, tools, tutorials, training, examples, and helpful links. Users can view and download pertinent material at the right time and place as they work through the steps of developing their LRSPs.
The site was officially launched October 1, 2020, during Rural Road Safety Awareness Week, and announced by Administrator Nason. "Our goal is to connect FHWA to America's 3,000 counties and 20,000 cities and towns that could benefit from a local road safety plan," Nason said. "This innovative new tool includes everything local agencies need to develop an LRSP to help reduce fatalities on their local roads."
This website is the first of its kind for the Office of Safety, and it has the potential to draw in new agencies and reach thousands of local agencies that have not yet embarked on this journey of getting people home safely. In just the first month, the site surpassed 17,000 page views.
For more information, contact Jerry Roche at jerry.roche@dot.gov or Hillary Isebrands at Hillary.isebrands@dot.gov.
By: Norah Ocel, FHWA Office of Safety
It is not only necessary to recognize those within our communities who spend time and energy prioritizing roadway safety and saving lives, but it is also critical to encourage others to do the same. Having access to those champions, knowing who they are, what they do, how they do it, and highlighting the importance of their efforts is a great way to build a stronger and more collaborative transportation safety community.
With that in mind, the Office of Safety has created a Roadway Safety Champions-Partners for Zero Traffic Deaths web page. It will highlight on a monthly basis the great work many communities do. The purpose of this site is to show our appreciation to those road safety champions for their critical work in saving lives on the nation's roads. The web page is scheduled to go live on January 1, 2021.
If you are a roadway safety champion, THANK YOU!—because only working together…we'll get to zero.
FHWA-Federal Railroad Administration (FRA) Joint Webinar Series: Interconnection Technology, February 3, 2021, 2–3:30 p.m. EST.
Don't miss the upcoming FHWA-FRA joint webinar on interconnection technology! This quarter, we'll be taking a deeper dive into interconnection technology, building on October's webinar on interconnection and the Ohio experience.
Please register at the link here. Note: non-FHWA registrants will need to log in with an FHWA webinar account, or create a new account.
For more information, contact Esther Strawder at esther.strawder@dot.gov, or to troubleshoot registration, contact Kayce Georgi at kayce.georgi.ctr@dot.gov.
22nd Annual National Bike Summit, February 28–March 3, 2021.
(https://bikeleague.org/summit)
The 2021 National Bike Summit will take place online, February 28–March 3, 2021. The theme is "Bikes: Our Vehicle for Change."
2021 Lifesavers National Conference on Highway Safety Priorities, April 26–28, 2021, Online.
(https://lifesaversconference.org/
The 2021 National Lifesavers Conference on Highway Safety Priorities, originally scheduled to take place in Long Beach, California, will be held entirely online. The Lifesavers conference brings together a unique combination of public health and safety professionals, researchers, advocates, practitioners, and students committed to sharing best practices, research, and policy initiatives that are proven to work.
Joint ITE International and Southern District Annual Meeting and Exhibition, August 4–20, 2021, Online.
(https://www.ite.org/events-meetings/ite-virtual-annual-meeting-and-exhibition/)
This meeting and exhibition is an international membership platform for professionals working to improve transportation mobility and safety.
Transportation Research Board Meeting, January 2021, Online.
(http://www.trb.org/AnnualMeeting/AnnualMeeting.aspx)
The 100th Annual Meeting will be a virtual event featuring a series of events scheduled throughout the month of January 2021. Committee Meetings will be held January 5 – 8 and 11 – 15. Sessions and Exhibits will occur January 21 – 22 and 25 – 29. The theme for the 2021 meeting is Launching a New Century of Mobility and Quality of Life.
Visit the FHWA Office of Safety Virtual Booth in the TRB Exhibit Hall!
If you are attending the annual meeting of the Transportation Research Board, be sure to "visit" our virtual booth in the exhibit hall to check out all the Office of Safety has to offer! During the hours listed below, you can chat live with one of our experts. A schedule of topics and times will be available in the booth.
Exhibits will be available 24/7 during the meeting, but they will be staffed from 11:00 a.m. to 3:00 p.m. Eastern Standard Time on the following days:
January 21, 22, 25, 26, 27, 28, and 29
For more information, please contact Tara McLoughlin at 202-366-2176 or tara.mcloughlin@dot.gov.
is a publication of the U.S. Department of Transportation, Federal Highway Administration.
The Federal Highway Administration publishes the Safety Compass newsletter three times a year. We can be reached at:
FHWA Office of Safety
1200 New Jersey Ave. SE
Room E71-320
Washington, DC 20590
The Safety Compass is available online at the FHWA Office of Safety web site at: /newsletter/safetycompass/.
We welcome your comments and highway safety-related articles. The purpose of this newsletter is to increase highway safety awareness and information and to provide resources to help save lives.
We encourage readers to submit highway safety articles that might be of value to the highway safety community. Send your comments, questions and articles for review electronically to Tara McLoughlin at: tara.mcloughlin@dot.gov
1 https://www.nhtsa.gov/risky-driving/speeding. [ Return to note 1. ]
2 https://www.nhtsa.gov/press-releases/2019-fatality-data-traffic-deaths-2020-q2-projections. [ Return to note 2. ]
3 https://crashstats.nhtsa.dot.gov/Api/Public/ViewPublication/813021. [ Return to note 3. ]
4 The U.S. Government does not endorse any products, manufacturers or entities. Trademarks, manufacturers' names or entity names appear in The Safety Compass only because they are considered essential to the objective of the document. They are included for informational purposes only and are not intended to reflect a preference, approval, or endorsement of any one product or entity. [ Return to note 4. ]

